| Param | Original file | Final file |
|---|---|---|
| Filename | modeM0/AS1A02_124T01_9000000842_06362cztM0_level2.evt | modeM0/AS1A02_124T01_9000000842_06362cztM0_level2_quad_clean.evt |
| Size (bytes) | 743,008,320 | 135,506,880 |
| Size | 708.6 MB | 129.2 MB |
| Events in quadrant A | 5,169,179 | 843,028 |
| Events in quadrant B | 5,635,360 | 850,253 |
| Events in quadrant C | 4,961,356 | 831,449 |
| Events in quadrant D | 5,973,876 | 800,814 |
| Mode M9 | |||
|---|---|---|---|
| Quadrant | BADHDUFLAG | Total packets | Discarded packets |
| A | 0 | 8 | 0 |
| B | 0 | 8 | 0 |
| C | 0 | 8 | 0 |
| D | 0 | 8 | 0 |
| Mode M0 | |||
|---|---|---|---|
| Quadrant | BADHDUFLAG | Total packets | Discarded packets |
| A | 0 | 23236 | 3 |
| B | 0 | 24212 | 2 |
| C | 0 | 22924 | 2 |
| D | 0 | 25890 | 2 |
| Mode SS | |||
|---|---|---|---|
| Quadrant | BADHDUFLAG | Total packets | Discarded packets |
| A | 0 | 230 | 0 |
| B | 0 | 230 | 0 |
| C | 0 | 230 | 0 |
| D | 0 | 230 | 0 |
| Quadrant | Total seconds | Saturated seconds | Saturation percentage |
|---|---|---|---|
| A | 11251 | 48 | 0.426629% |
| B | 11251 | 78 | 0.693272% |
| C | 11251 | 19 | 0.168874% |
| D | 11251 | 177 | 1.573193% |
Noise dominated data is calculated using 1-second bins in cleaned event files. If a bin has >2000 counts, and if more than 50% of those come from <1% of pixels, then it is considered to be noise-dominated and hence unusable.
| Quadrant | # 1 sec bins | Bins with >0 counts | Bins with >2000 counts | High rate bins dominated by noise | Noise dominated (total time) | Noise dominated (detector-on time) | Marked lightcurve |
|---|---|---|---|---|---|---|---|
| A | 11981 | 11254 | 3 | 3 | 0.03% | 0.03% | 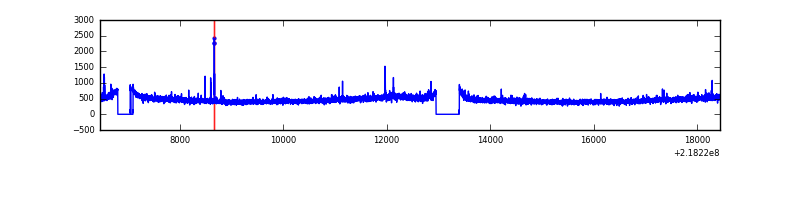 |
| B | 11981 | 11254 | 9 | 9 | 0.08% | 0.08% | 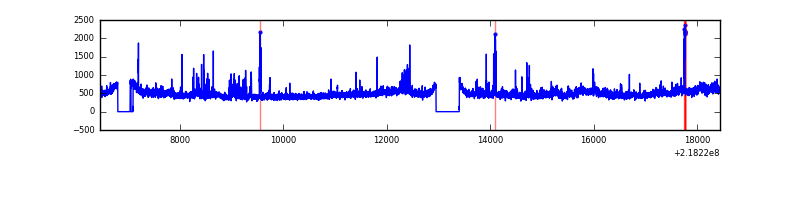 |
| C | 11981 | 11254 | 0 | 0 | 0.00% | 0.00% | 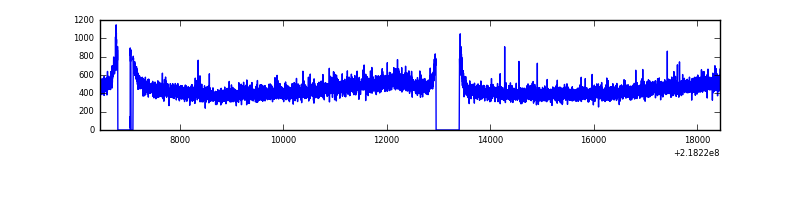 |
| D | 11981 | 11254 | 77 | 77 | 0.64% | 0.68% | 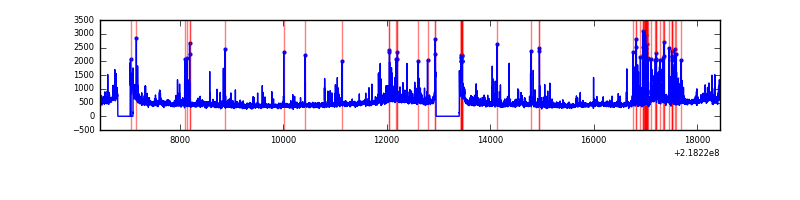 |
Top three noisy pixels from each quadrant. If the there are fewer than three noisy pixels in the level2.evt file, extra rows are filled as -1
| Pixel properties | Quadrant properties | ||||||
|---|---|---|---|---|---|---|---|
| Quadrant | DetID | PixID | Counts | Sigma | Mean | Median | Sigma |
| A | 15 | 236 | 167307 | 638.73 | 1274 | 1242 | 260.0 |
| A | 13 | 251 | 34437 | 127.68 | 1274 | 1242 | 260.0 |
| A | 8 | 15 | 25547 | 93.48 | 1274 | 1242 | 260.0 |
| B | 0 | 228 | 391678 | 1573.94 | 1290 | 1256 | 248.1 |
| B | 0 | 219 | 70254 | 278.16 | 1290 | 1256 | 248.1 |
| B | 15 | 204 | 69858 | 276.56 | 1290 | 1256 | 248.1 |
| C | 4 | 254 | 47947 | 161.75 | 1242 | 1244 | 288.7 |
| C | 1 | 241 | 24800 | 81.58 | 1242 | 1244 | 288.7 |
| C | 8 | 128 | 16572 | 53.09 | 1242 | 1244 | 288.7 |
| D | 4 | 95 | 400512 | 1334.42 | 1231 | 1191 | 299.2 |
| D | 2 | 63 | 293906 | 978.17 | 1231 | 1191 | 299.2 |
| D | 2 | 152 | 195743 | 650.14 | 1231 | 1191 | 299.2 |
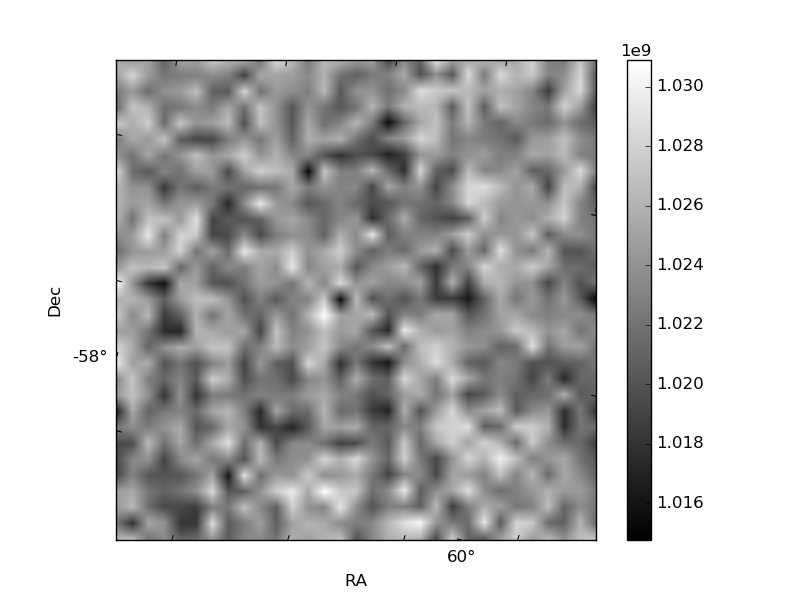
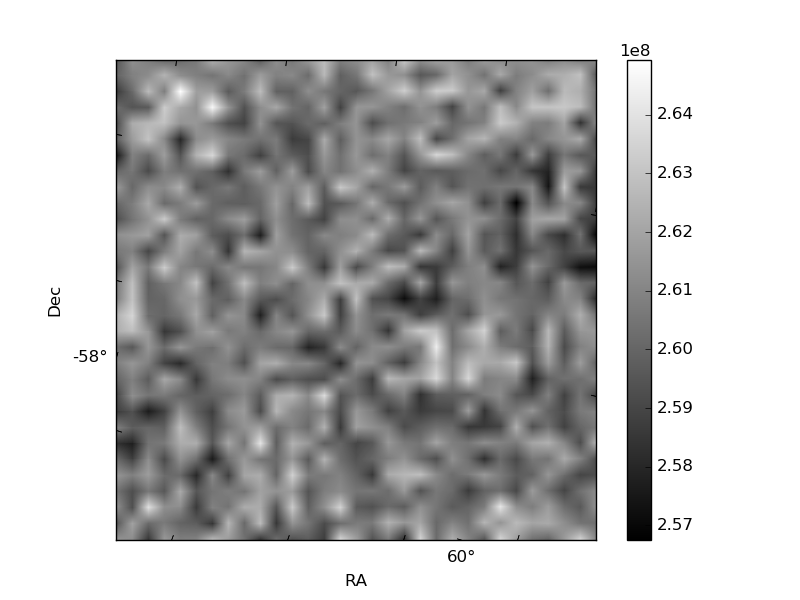
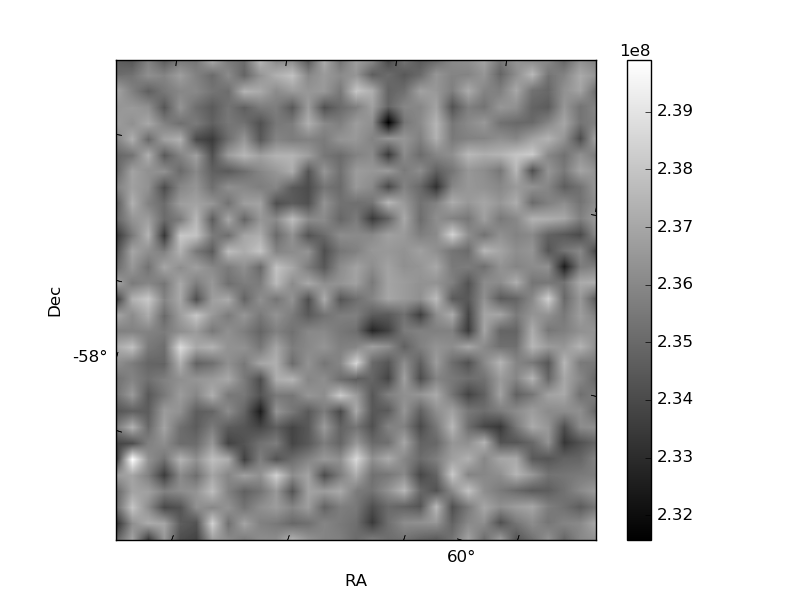
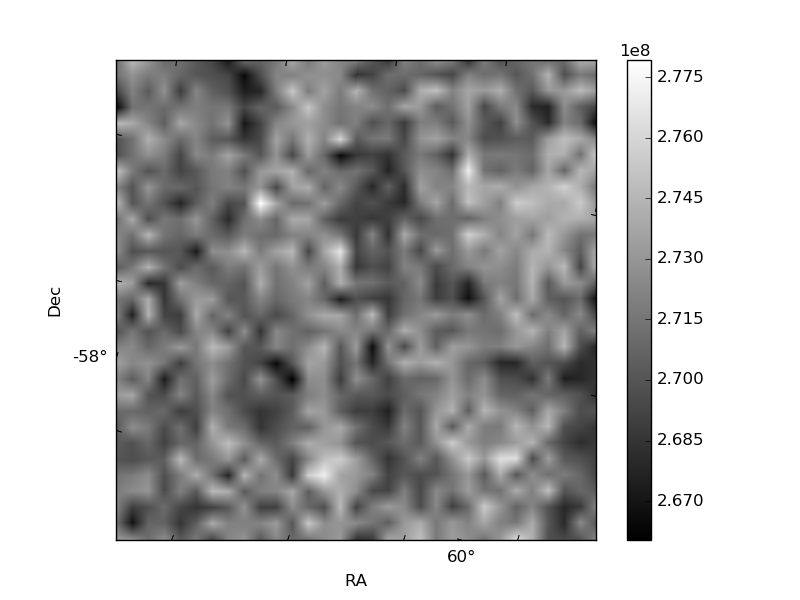
Histogram calculated using DETX and DETY for each event in the final _common_clean file
| Quadrant A | 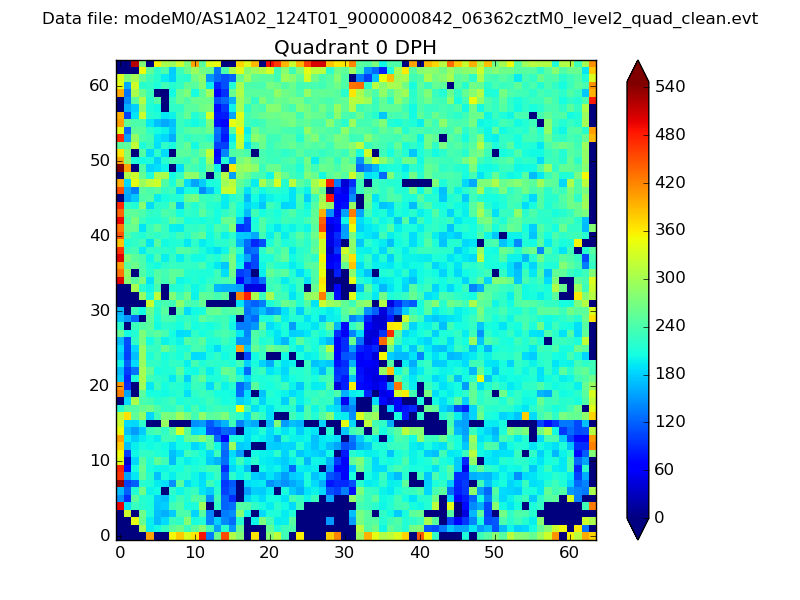 |
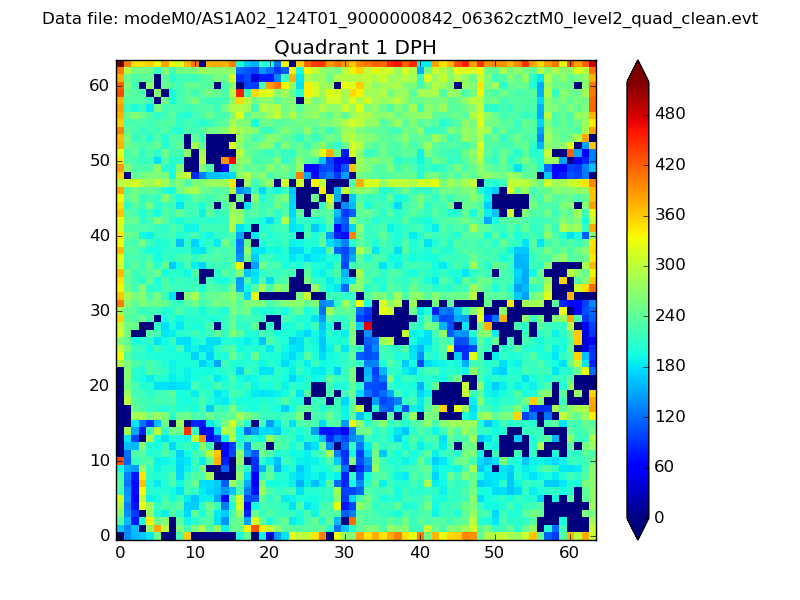 |
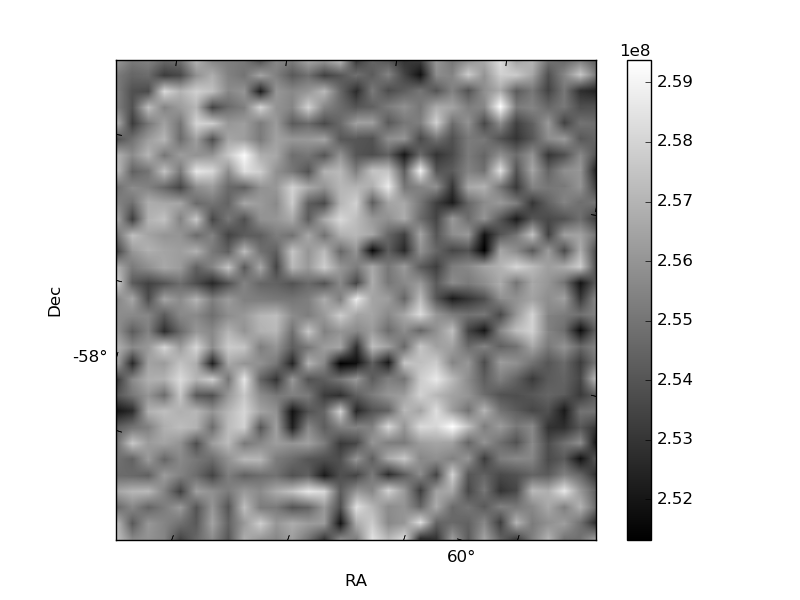
Quadrant B |
|---|---|---|---|
| Quadrant D | 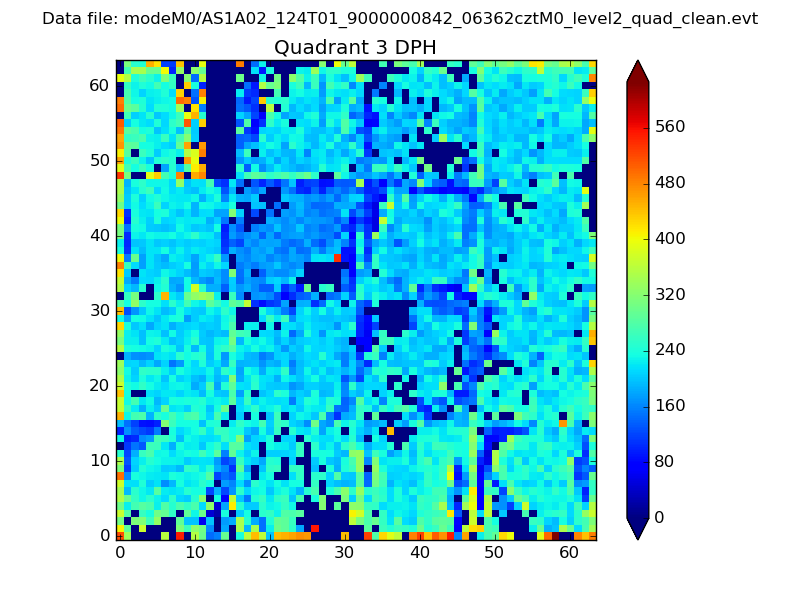 |
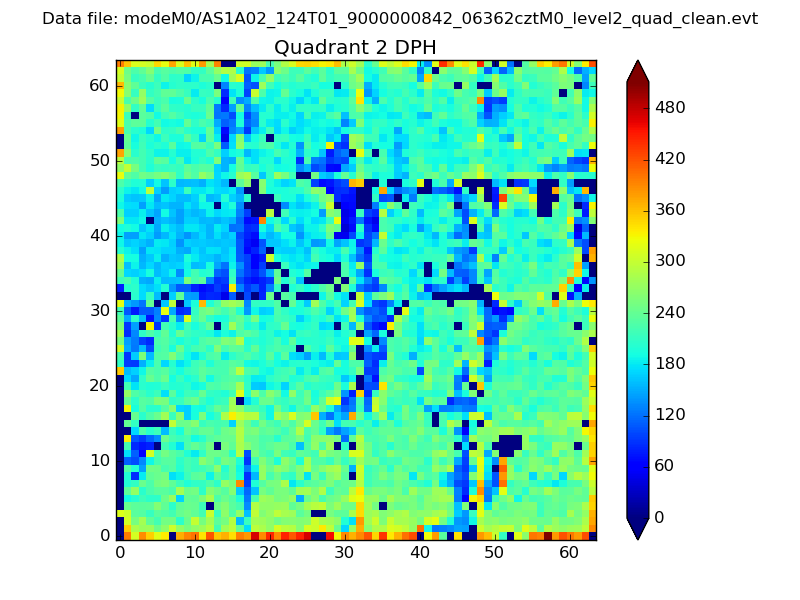 |
Quadrant C |
| Plot type | Count rate plots | Images |
|---|---|---|
| Comparison with Poisson distribution Blue bars denote a histogram of data divided into 1 sec bins. Red curve is a Poisson curve with rate = median count rate of data. |
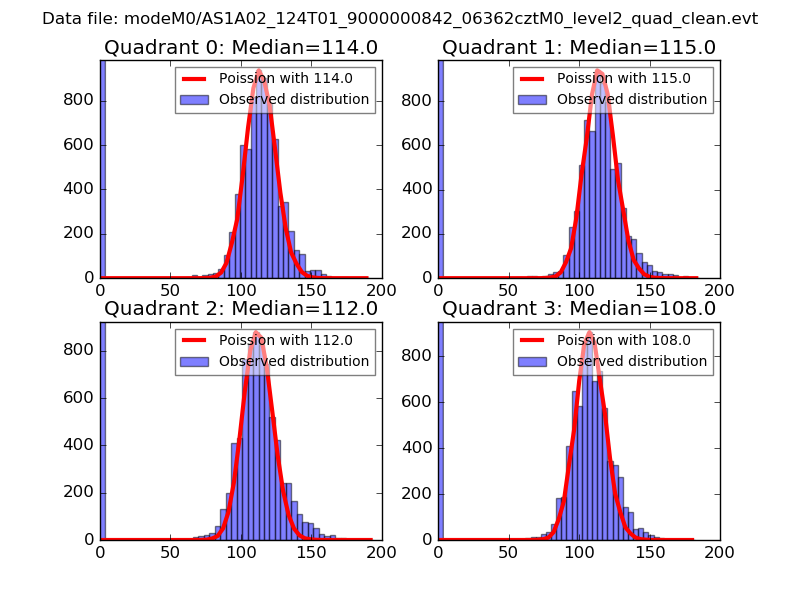 |
 |
| Quadrant-wise count rates Data is divided into 100 sec bins |
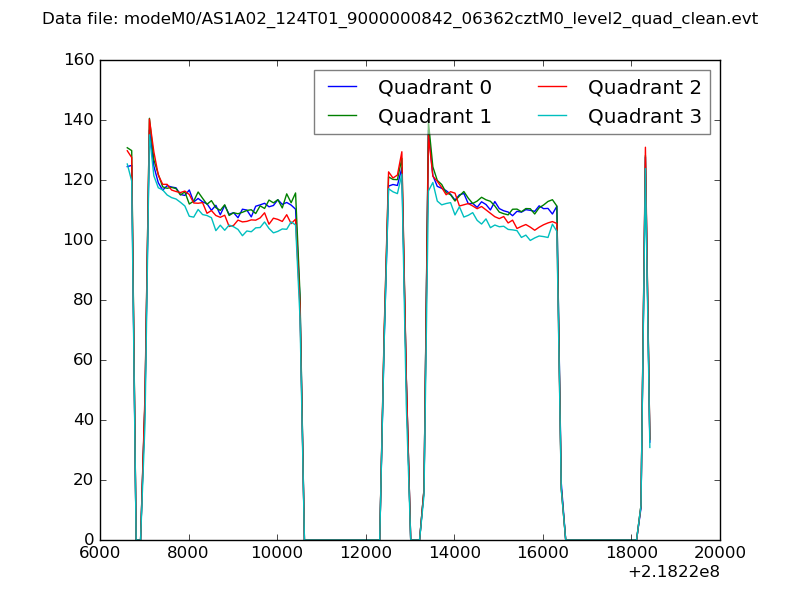 |
|
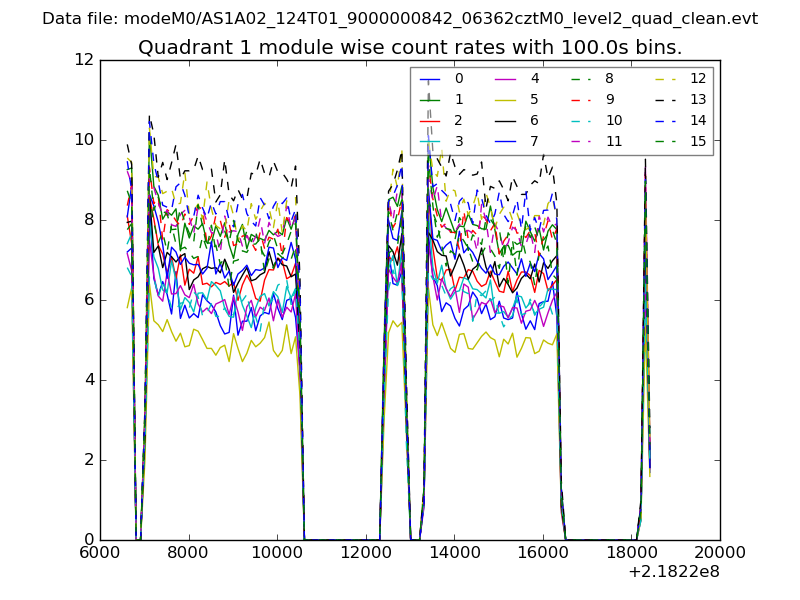
| Module-wise count rates for Quadrant A Data is divided into 100 sec bins |
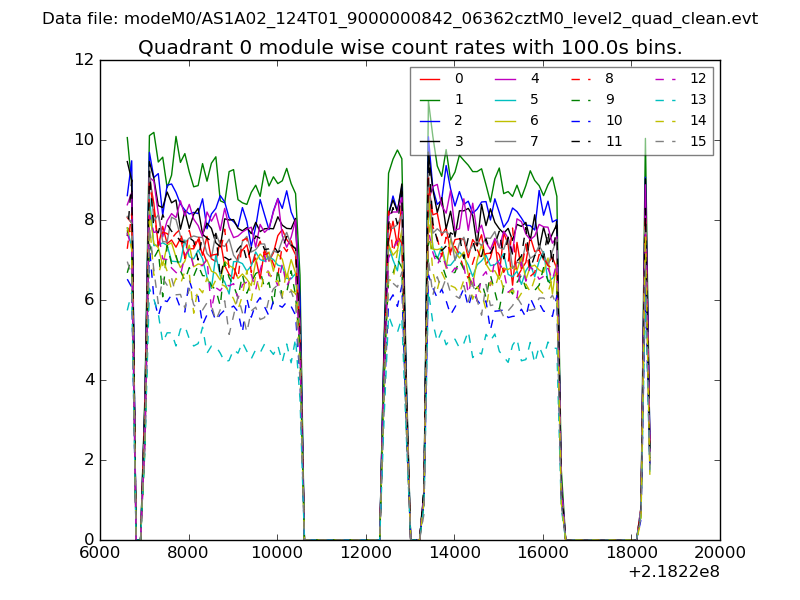 |
 |
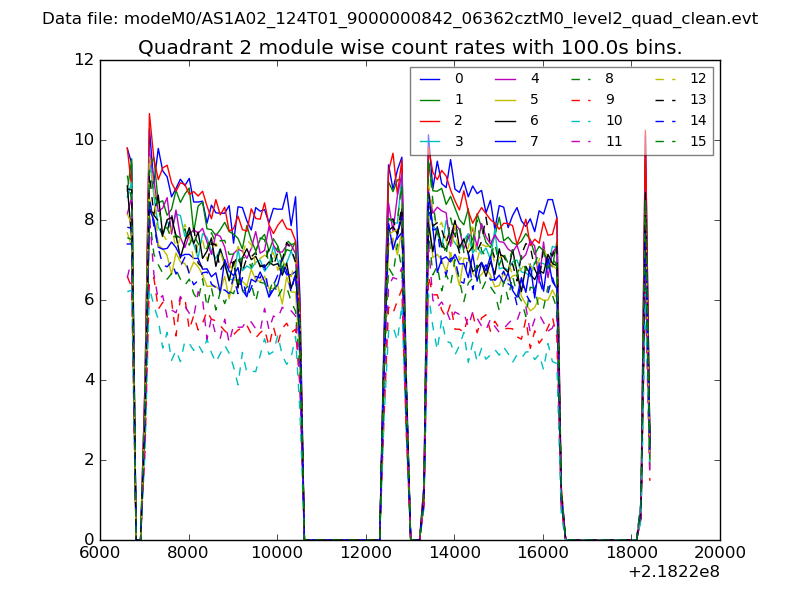
| Module-wise count rates for Quadrant B Data is divided into 100 sec bins |
 |
 |
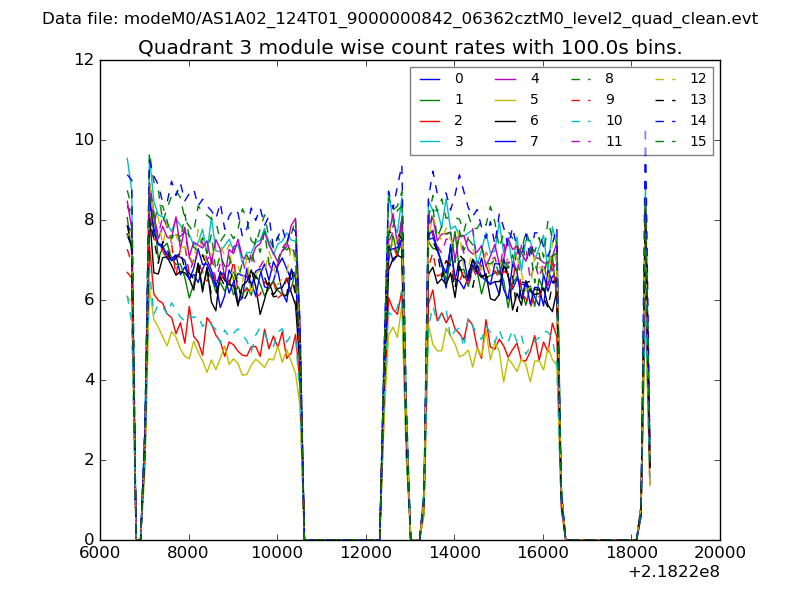
| Module-wise count rates for Quadrant C Data is divided into 100 sec bins |
 |
 |
| Module-wise count rates for Quadrant D Data is divided into 100 sec bins |
 |
 |
| Parameter | Plot |
|---|---|
| CZT HV Monitor | 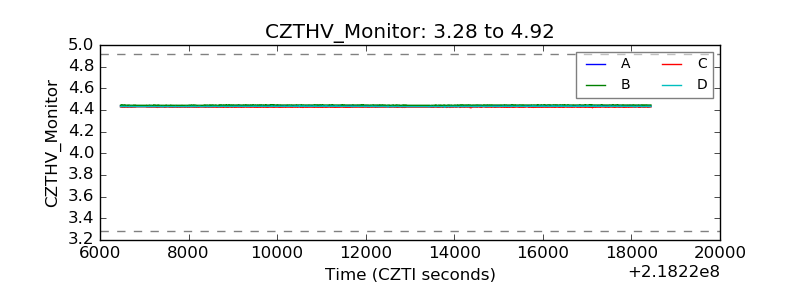 |
| D_VDD | 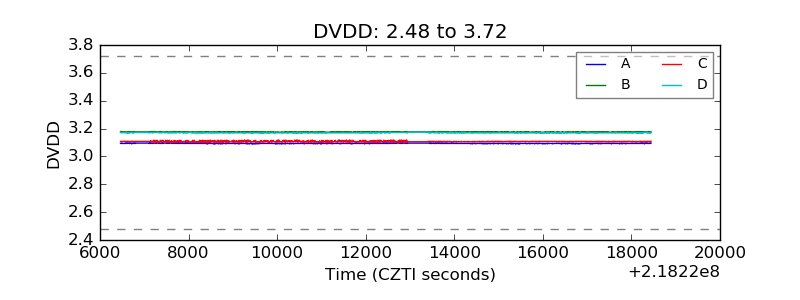 |
| Temperature 1 | 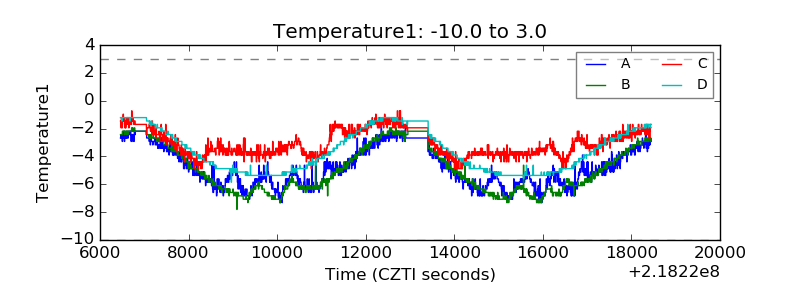 |
| Veto HV Monitor | 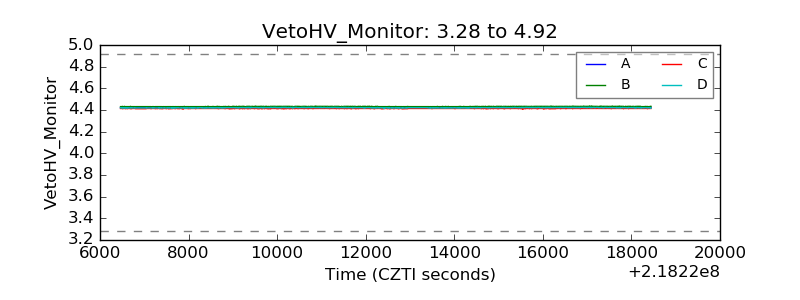 |
| Veto LLD | 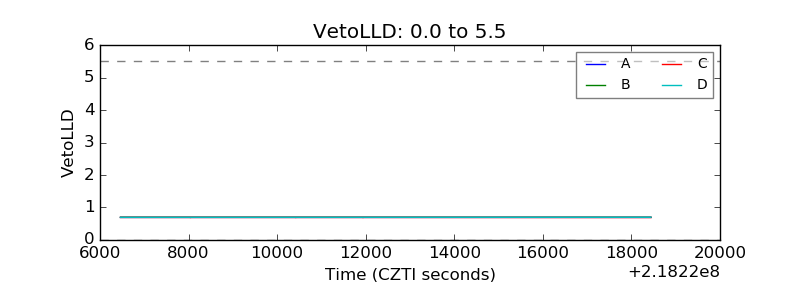 |
| Alpha Counter | 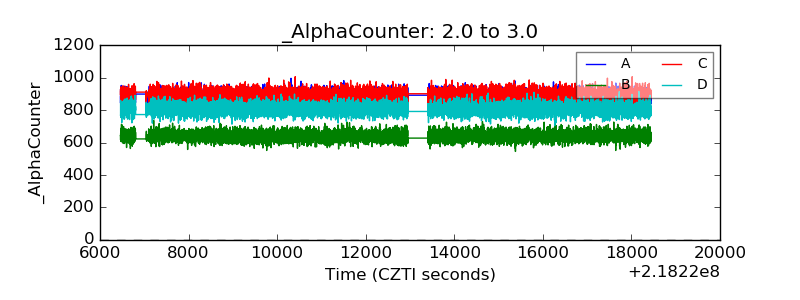 |
| _CPM_Rate | 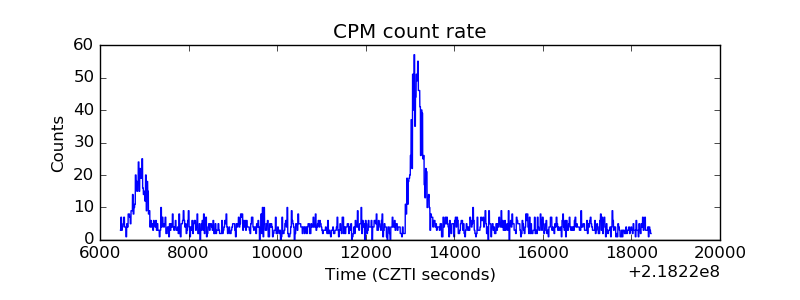 |
| CZT Counter | 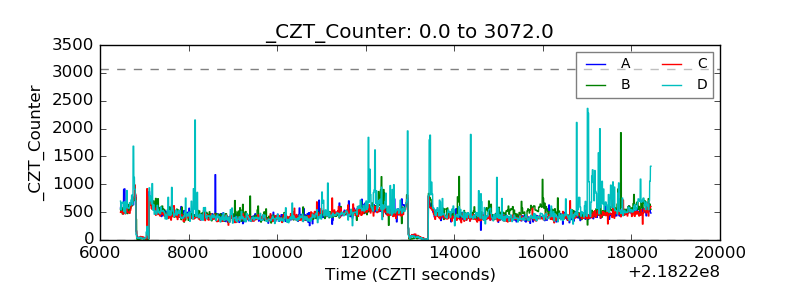 |
| +2.5 Volts monitor | 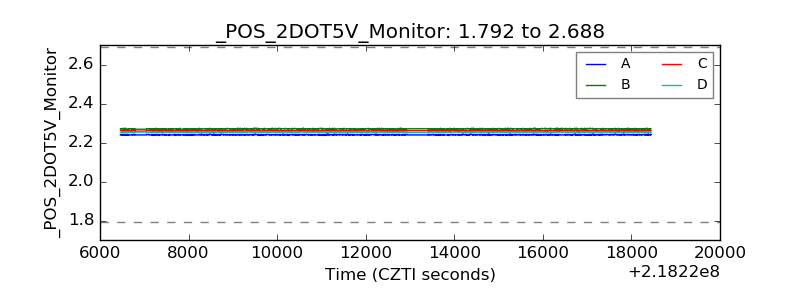 |
| +5 Volts monitor | 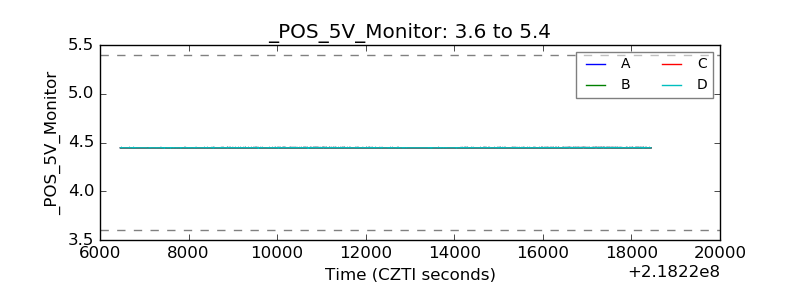 |
| _ROLL_ROT | 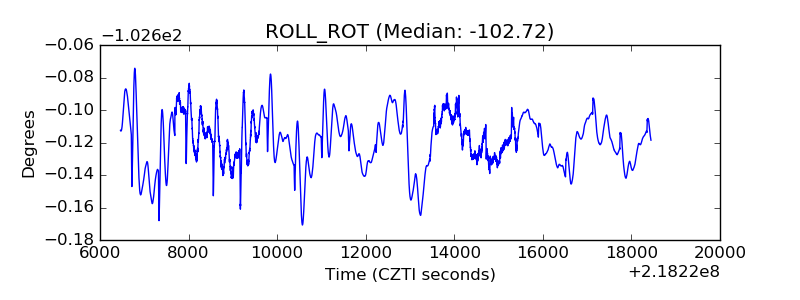 |
| _Roll_DEC | 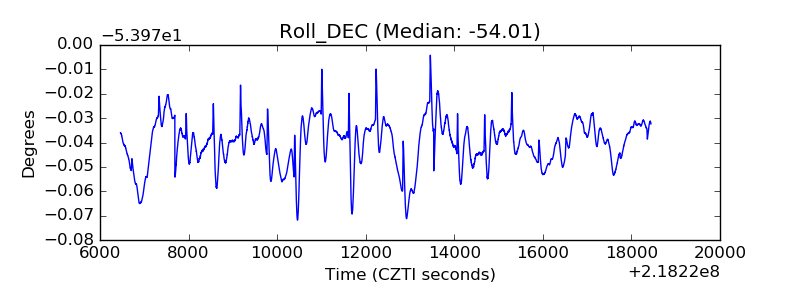 |
| _Roll_RA | 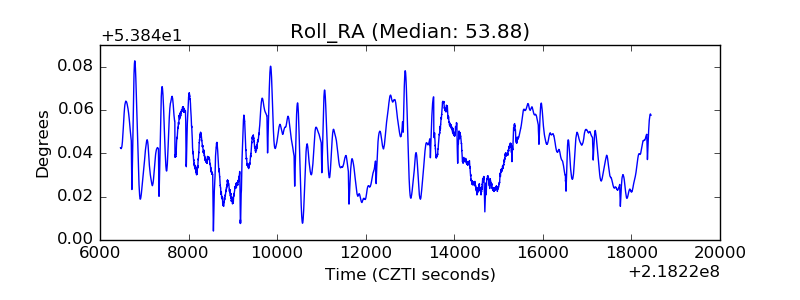 |
| Veto Counter | 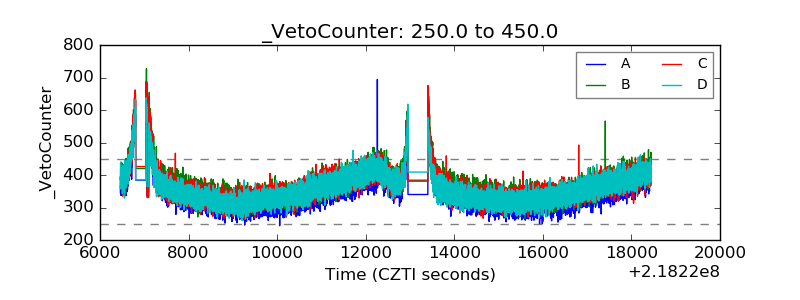 |