| Param | Original file | Final file |
|---|---|---|
| Filename | modeM0/AS1A02_124T01_9000000842_06365cztM0_level2.evt | modeM0/AS1A02_124T01_9000000842_06365cztM0_level2_quad_clean.evt |
| Size (bytes) | 523,624,320 | 99,656,640 |
| Size | 499.4 MB | 95.0 MB |
| Events in quadrant A | 3,550,659 | 636,836 |
| Events in quadrant B | 4,210,587 | 637,800 |
| Events in quadrant C | 3,452,077 | 635,856 |
| Events in quadrant D | 4,162,400 | 612,568 |
| Mode M9 | |||
|---|---|---|---|
| Quadrant | BADHDUFLAG | Total packets | Discarded packets |
| A | 0 | 20 | 0 |
| B | 0 | 20 | 0 |
| C | 0 | 20 | 0 |
| D | 0 | 20 | 0 |
| Mode M0 | |||
|---|---|---|---|
| Quadrant | BADHDUFLAG | Total packets | Discarded packets |
| A | 0 | 15234 | 3 |
| B | 0 | 17049 | 2 |
| C | 0 | 15039 | 2 |
| D | 0 | 16884 | 2 |
| Mode SS | |||
|---|---|---|---|
| Quadrant | BADHDUFLAG | Total packets | Discarded packets |
| A | 0 | 148 | 0 |
| B | 0 | 148 | 0 |
| C | 0 | 148 | 0 |
| D | 0 | 148 | 0 |
| Quadrant | Total seconds | Saturated seconds | Saturation percentage |
|---|---|---|---|
| A | 7099 | 34 | 0.478941% |
| B | 7099 | 242 | 3.408931% |
| C | 7099 | 64 | 0.901535% |
| D | 7099 | 166 | 2.338358% |
Noise dominated data is calculated using 1-second bins in cleaned event files. If a bin has >2000 counts, and if more than 50% of those come from <1% of pixels, then it is considered to be noise-dominated and hence unusable.
| Quadrant | # 1 sec bins | Bins with >0 counts | Bins with >2000 counts | High rate bins dominated by noise | Noise dominated (total time) | Noise dominated (detector-on time) | Marked lightcurve |
|---|---|---|---|---|---|---|---|
| A | 9104 | 7100 | 0 | 0 | 0.00% | 0.00% | 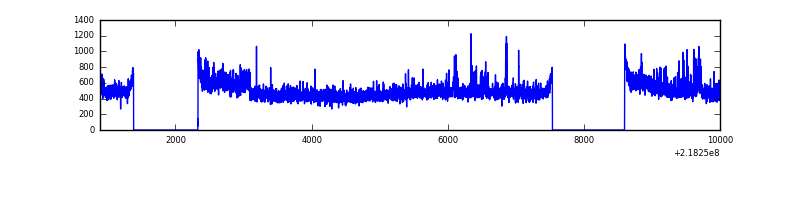 |
| B | 9104 | 7100 | 129 | 129 | 1.42% | 1.82% | 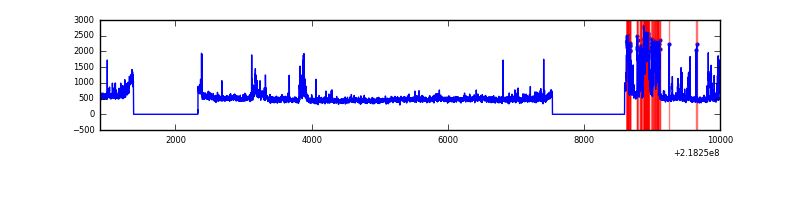 |
| C | 9104 | 7101 | 22 | 22 | 0.24% | 0.31% | 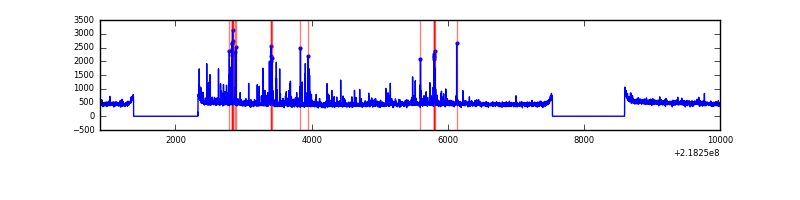 |
| D | 9104 | 7100 | 114 | 114 | 1.25% | 1.61% | 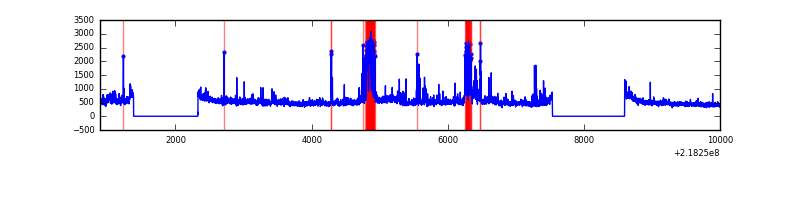 |
Top three noisy pixels from each quadrant. If the there are fewer than three noisy pixels in the level2.evt file, extra rows are filled as -1
| Pixel properties | Quadrant properties | ||||||
|---|---|---|---|---|---|---|---|
| Quadrant | DetID | PixID | Counts | Sigma | Mean | Median | Sigma |
| A | 15 | 236 | 308968 | 1834.33 | 827 | 809 | 168.0 |
| A | 8 | 15 | 45211 | 264.31 | 827 | 809 | 168.0 |
| A | 13 | 251 | 11111 | 61.32 | 827 | 809 | 168.0 |
| B | 0 | 228 | 778164 | 4939.06 | 831 | 811 | 157.4 |
| B | 0 | 229 | 110736 | 698.43 | 831 | 811 | 157.4 |
| B | 5 | 250 | 35017 | 217.33 | 831 | 811 | 157.4 |
| C | 4 | 254 | 241859 | 1273.87 | 815 | 817 | 189.2 |
| C | 1 | 241 | 24901 | 127.28 | 815 | 817 | 189.2 |
| C | 13 | 61 | 6448 | 29.76 | 815 | 817 | 189.2 |
| D | 2 | 63 | 502029 | 2541.88 | 804 | 776 | 197.2 |
| D | 4 | 95 | 409768 | 2074.02 | 804 | 776 | 197.2 |
| D | 2 | 152 | 107391 | 540.65 | 804 | 776 | 197.2 |
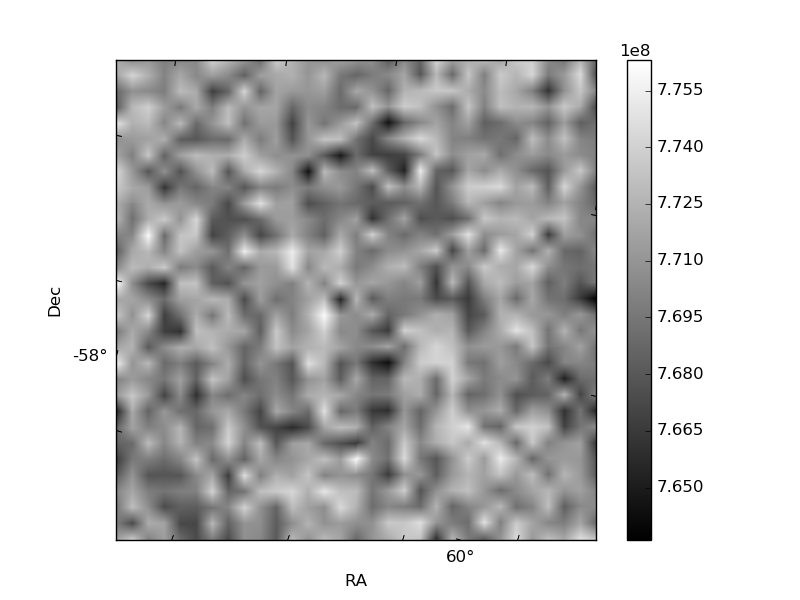
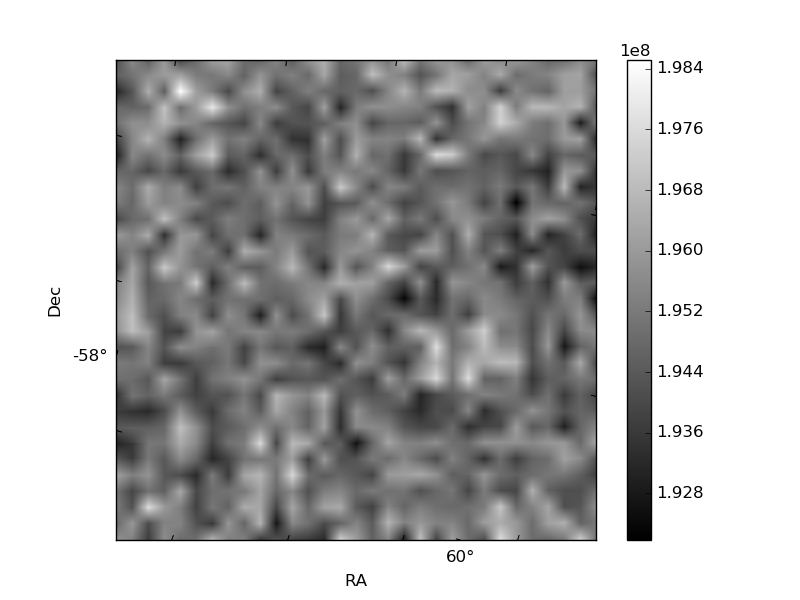
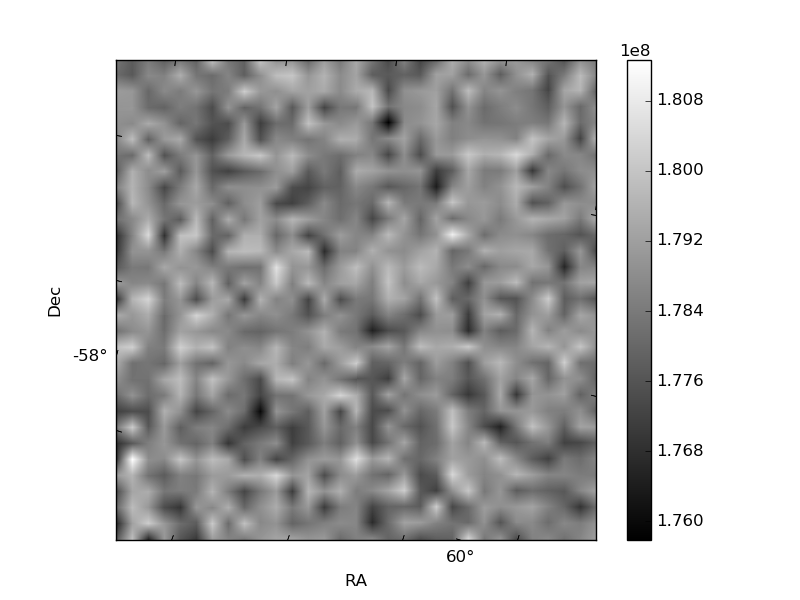
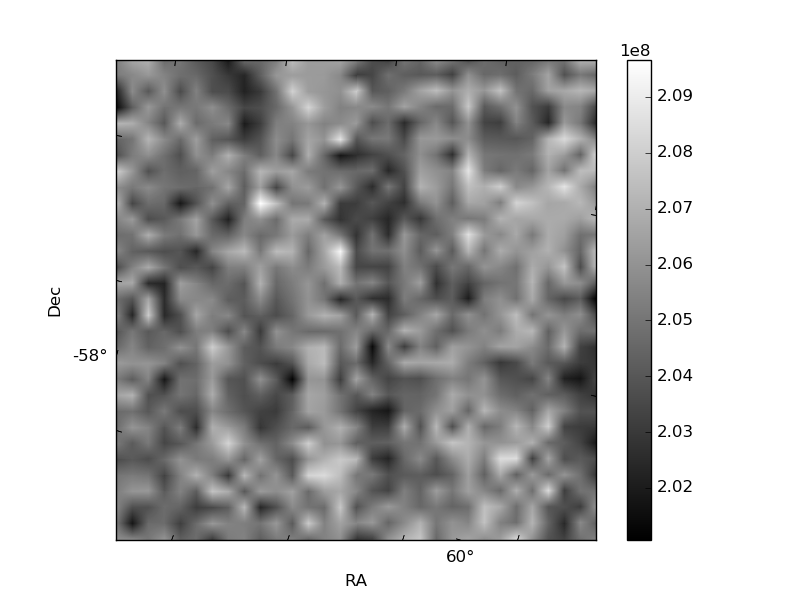
Histogram calculated using DETX and DETY for each event in the final _common_clean file
| Quadrant A | 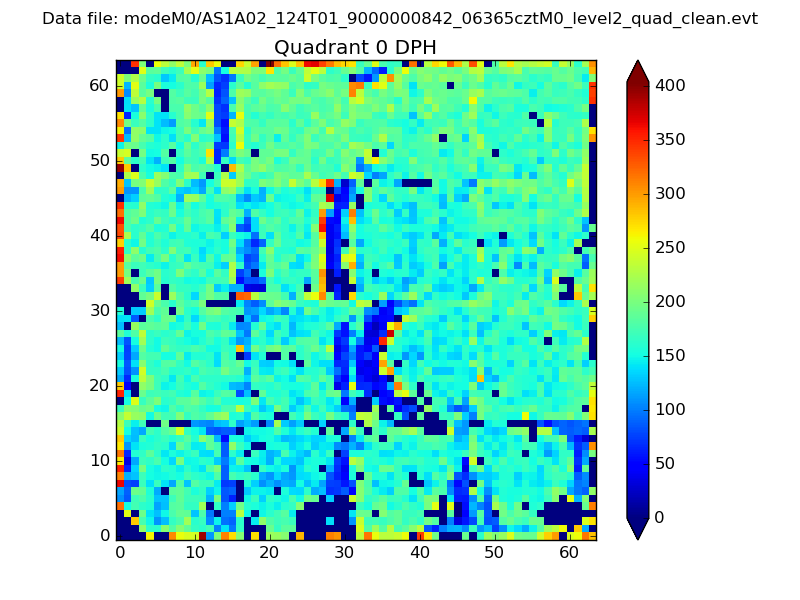 |
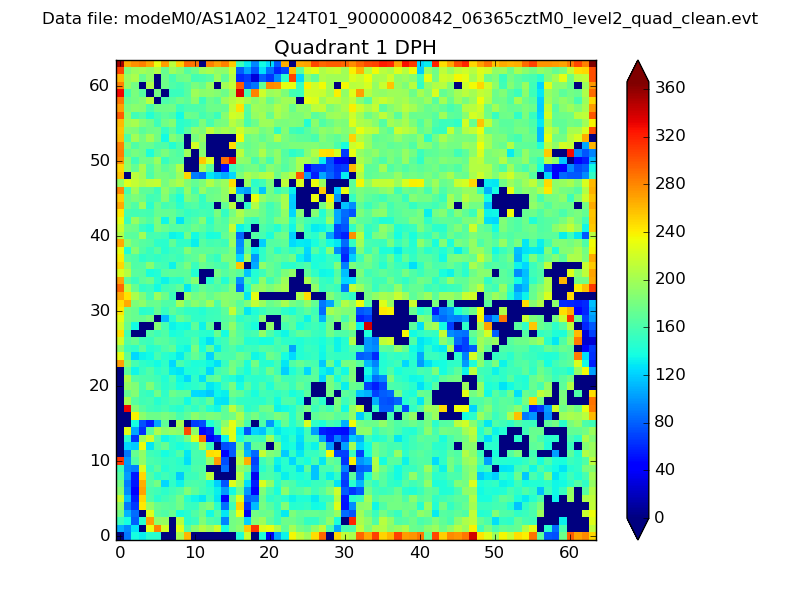 |
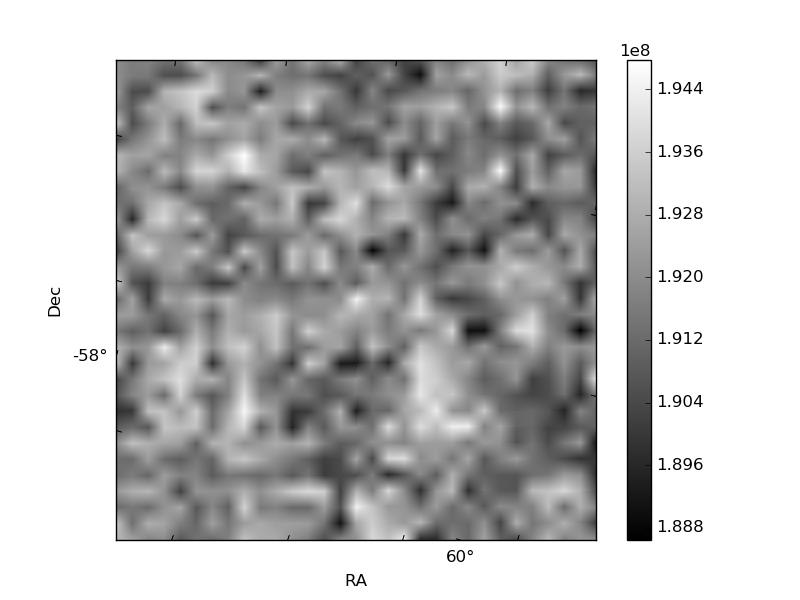
Quadrant B |
|---|---|---|---|
| Quadrant D | 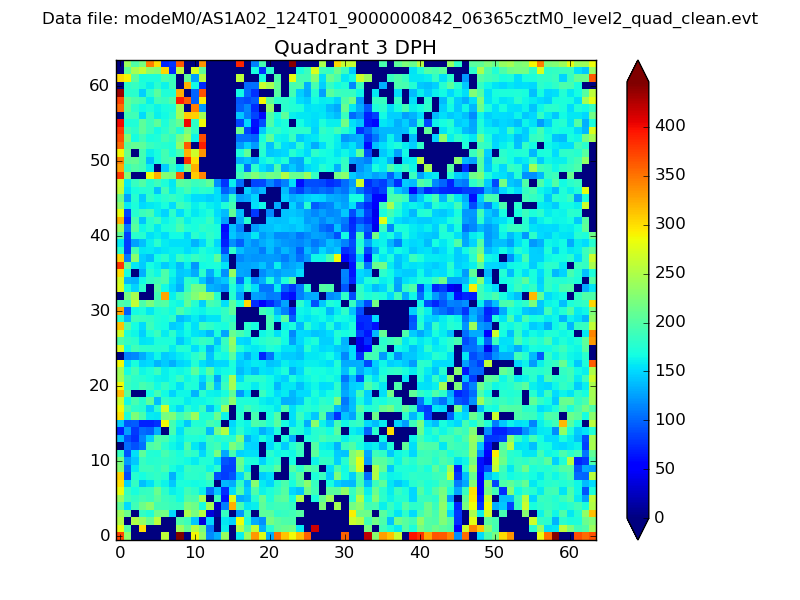 |
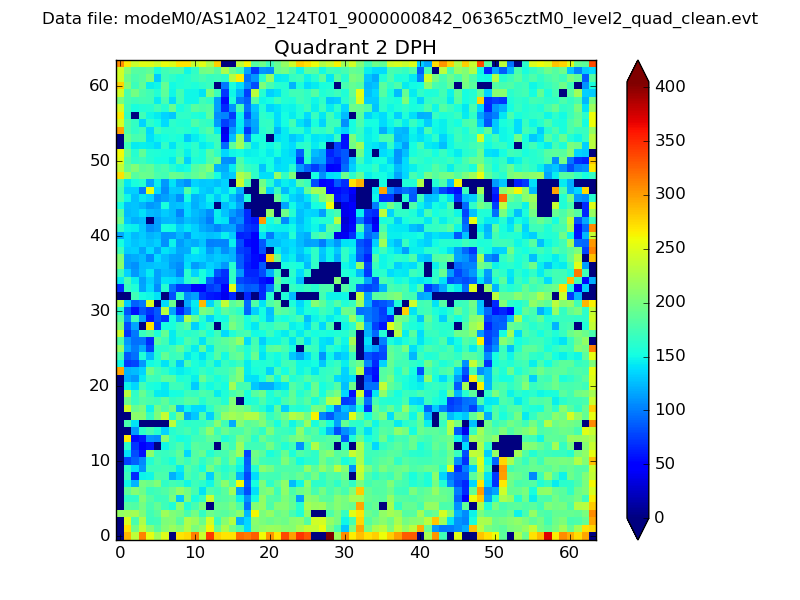 |
Quadrant C |
| Plot type | Count rate plots | Images |
|---|---|---|
| Comparison with Poisson distribution Blue bars denote a histogram of data divided into 1 sec bins. Red curve is a Poisson curve with rate = median count rate of data. |
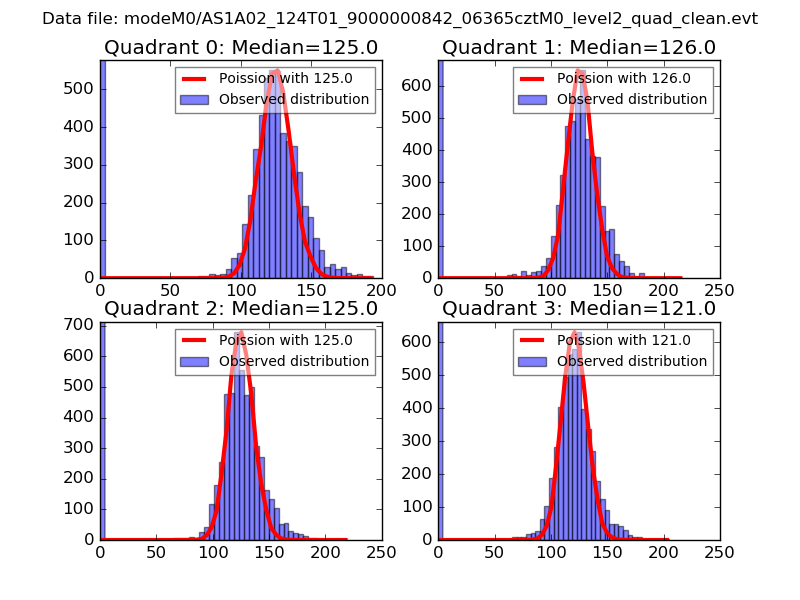 |
 |
| Quadrant-wise count rates Data is divided into 100 sec bins |
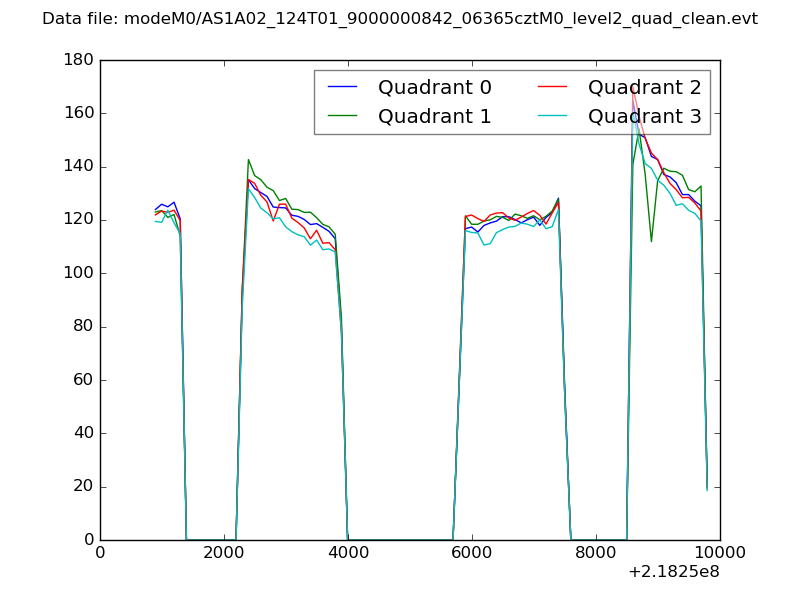 |
|
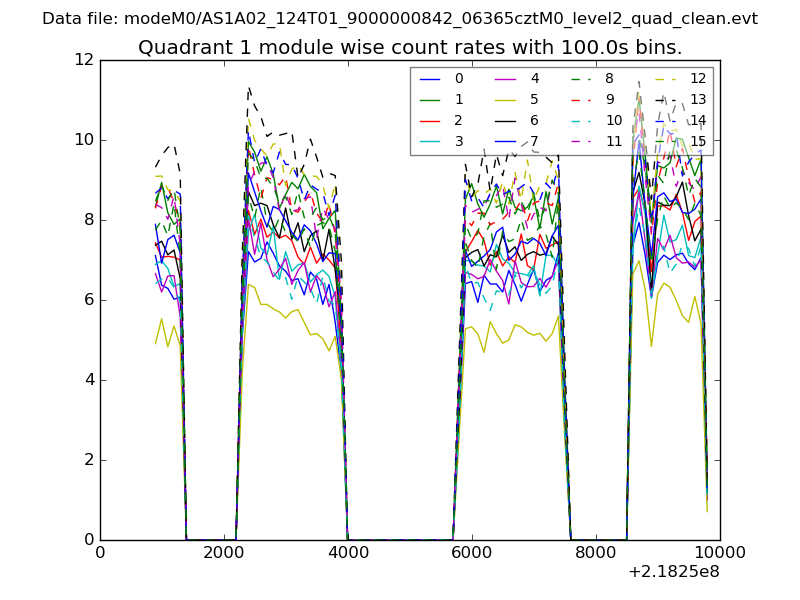
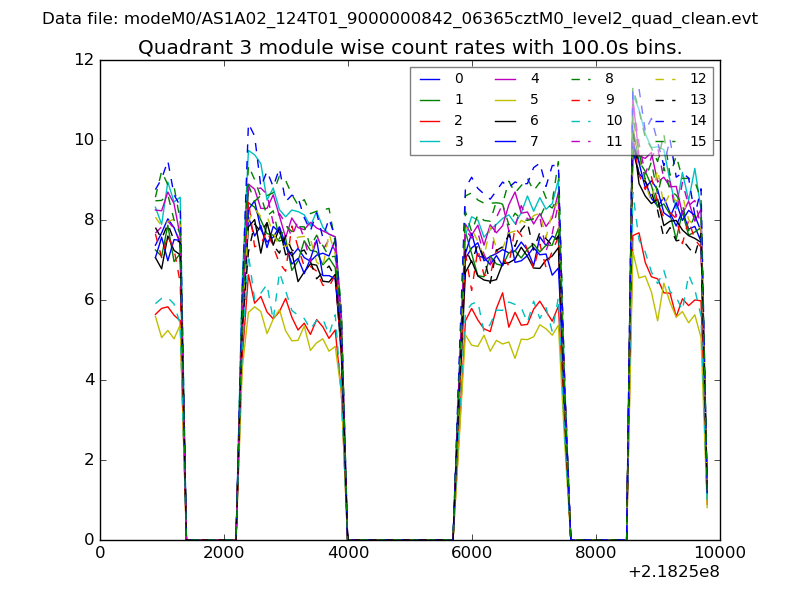
| Module-wise count rates for Quadrant A Data is divided into 100 sec bins |
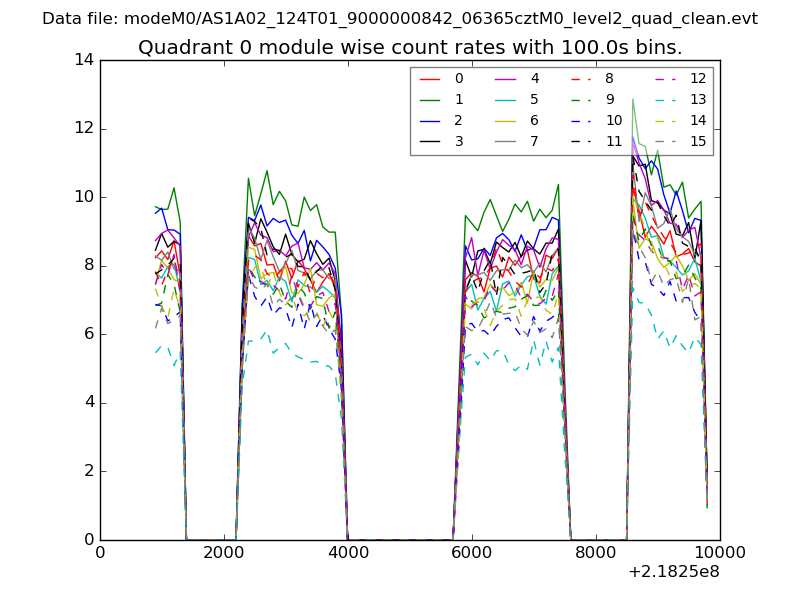 |
 |
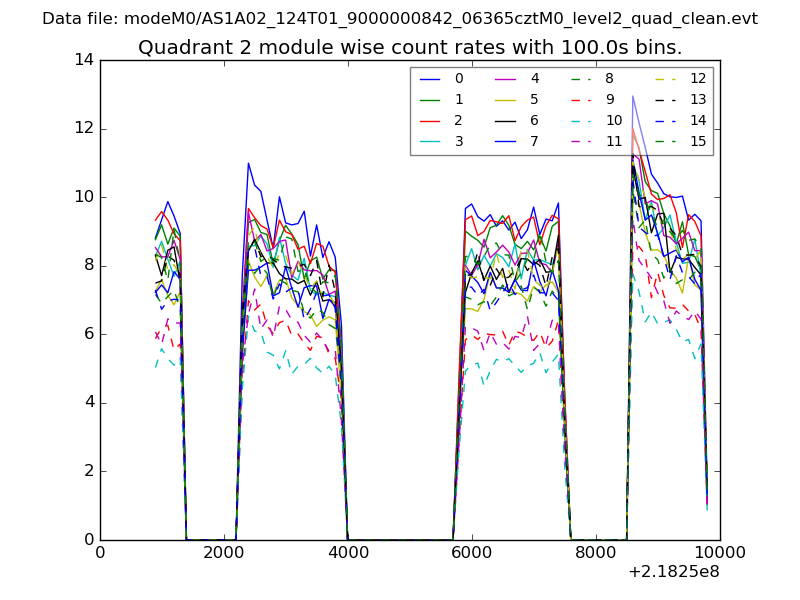
| Module-wise count rates for Quadrant B Data is divided into 100 sec bins |
 |
 |
| Module-wise count rates for Quadrant C Data is divided into 100 sec bins |
 |
 |
| Module-wise count rates for Quadrant D Data is divided into 100 sec bins |
 |
 |
| Parameter | Plot |
|---|---|
| CZT HV Monitor | 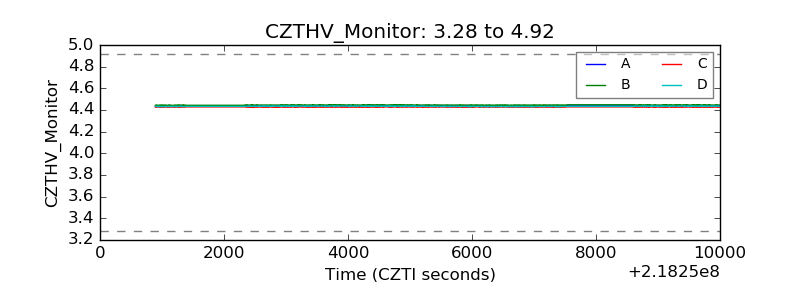 |
| D_VDD |  |
| Temperature 1 | 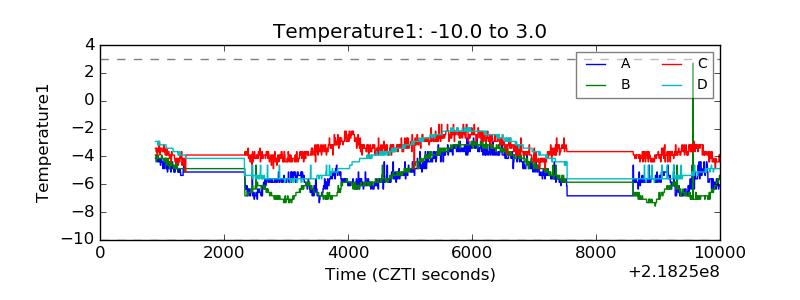 |
| Veto HV Monitor | 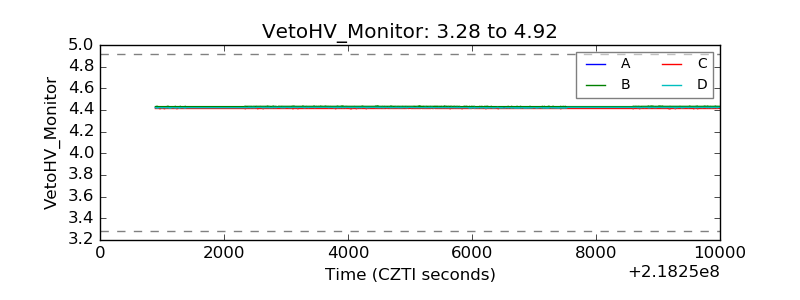 |
| Veto LLD | 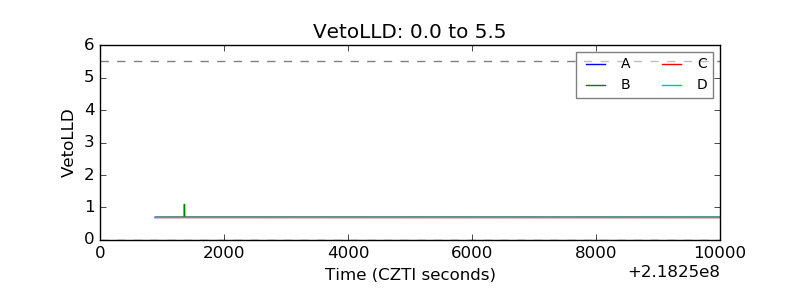 |
| Alpha Counter | 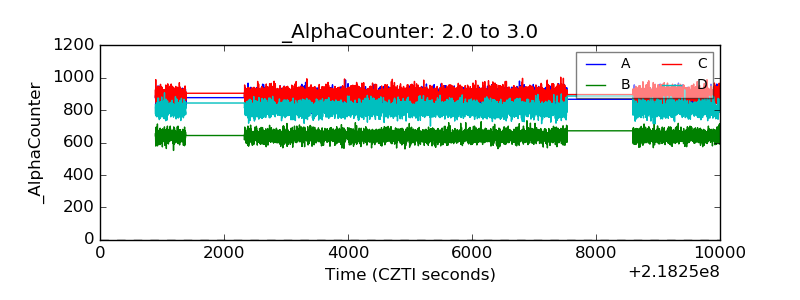 |
| _CPM_Rate | 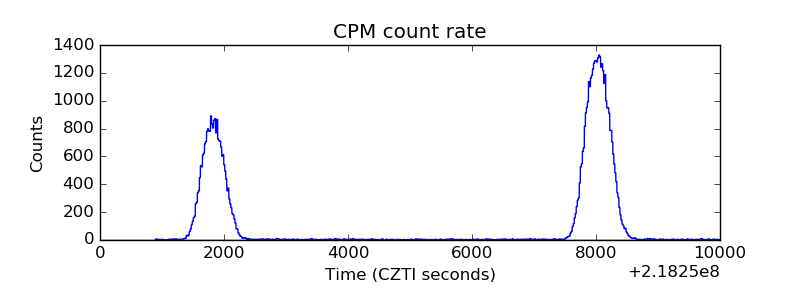 |
| CZT Counter | 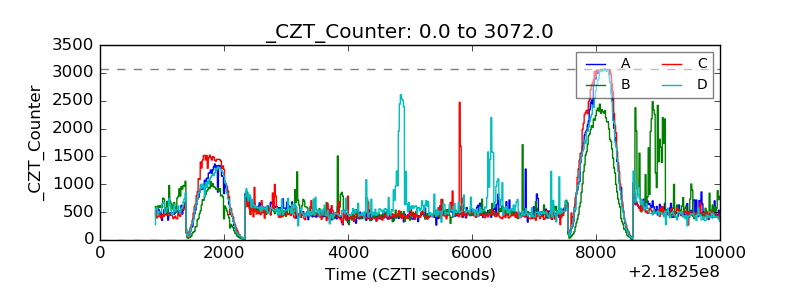 |
| +2.5 Volts monitor |  |
| +5 Volts monitor |  |
| _ROLL_ROT | 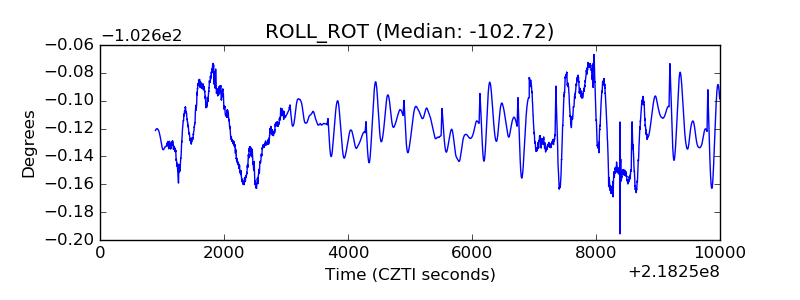 |
| _Roll_DEC | 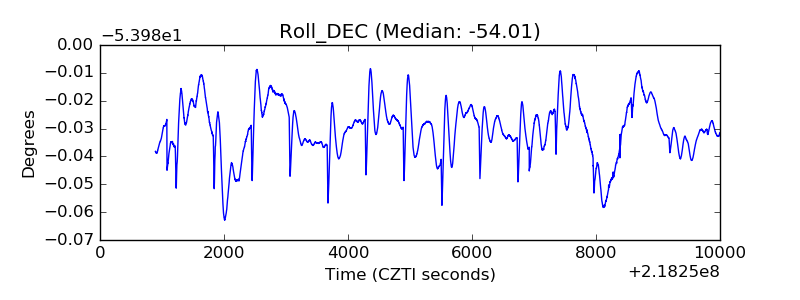 |
| _Roll_RA | 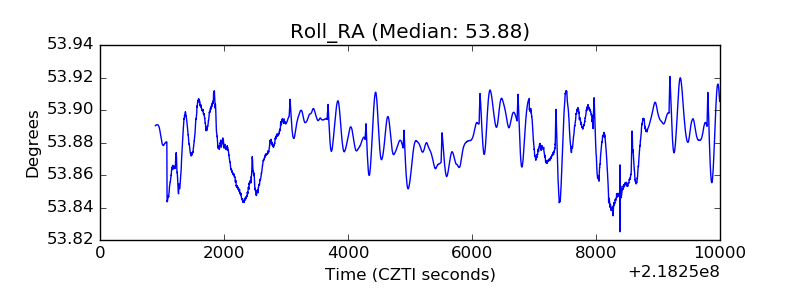 |
| Veto Counter | 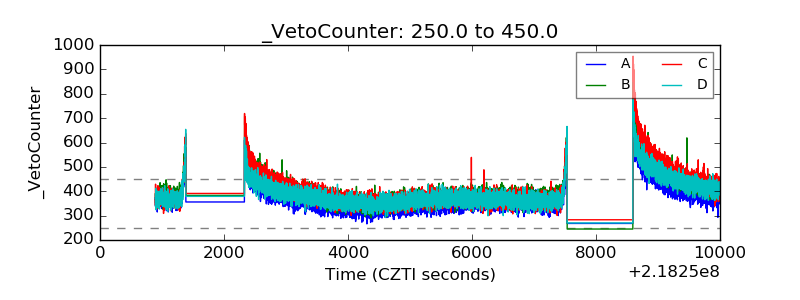 |