| Param | Original file | Final file |
|---|---|---|
| Filename | modeM0/AS1A02_124T01_9000000842_06367cztM0_level2.evt | modeM0/AS1A02_124T01_9000000842_06367cztM0_level2_quad_clean.evt |
| Size (bytes) | 452,666,880 | 79,758,720 |
| Size | 431.7 MB | 76.1 MB |
| Events in quadrant A | 3,280,853 | 493,835 |
| Events in quadrant B | 3,300,965 | 502,979 |
| Events in quadrant C | 3,256,509 | 497,955 |
| Events in quadrant D | 3,438,327 | 476,486 |
| Mode M9 | |||
|---|---|---|---|
| Quadrant | BADHDUFLAG | Total packets | Discarded packets |
| A | 0 | 17 | 0 |
| B | 0 | 17 | 0 |
| C | 0 | 17 | 0 |
| D | 0 | 18 | 0 |
| Mode M0 | |||
|---|---|---|---|
| Quadrant | BADHDUFLAG | Total packets | Discarded packets |
| A | 0 | 13589 | 3 |
| B | 0 | 13828 | 2 |
| C | 0 | 13793 | 2 |
| D | 0 | 14269 | 2 |
| Mode SS | |||
|---|---|---|---|
| Quadrant | BADHDUFLAG | Total packets | Discarded packets |
| A | 0 | 130 | 0 |
| B | 0 | 130 | 0 |
| C | 0 | 130 | 0 |
| D | 0 | 130 | 0 |
| Quadrant | Total seconds | Saturated seconds | Saturation percentage |
|---|---|---|---|
| A | 6360 | 93 | 1.462264% |
| B | 6360 | 158 | 2.484277% |
| C | 6360 | 87 | 1.367925% |
| D | 6360 | 112 | 1.761006% |
Noise dominated data is calculated using 1-second bins in cleaned event files. If a bin has >2000 counts, and if more than 50% of those come from <1% of pixels, then it is considered to be noise-dominated and hence unusable.
| Quadrant | # 1 sec bins | Bins with >0 counts | Bins with >2000 counts | High rate bins dominated by noise | Noise dominated (total time) | Noise dominated (detector-on time) | Marked lightcurve |
|---|---|---|---|---|---|---|---|
| A | 7580 | 6360 | 0 | 0 | 0.00% | 0.00% | 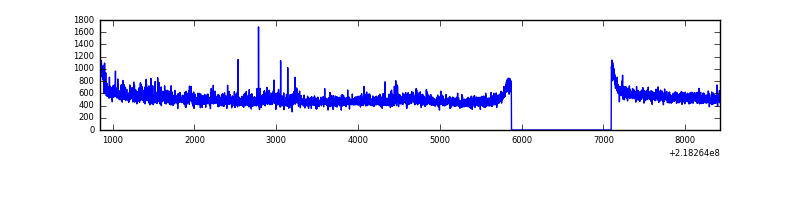 |
| B | 7580 | 6360 | 63 | 63 | 0.83% | 0.99% | 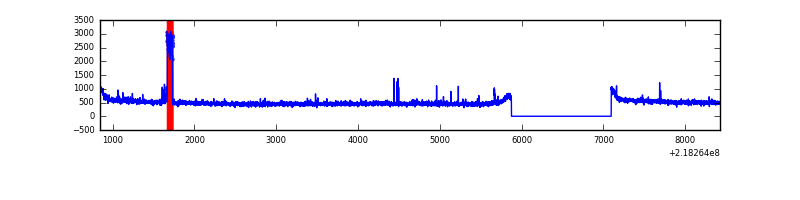 |
| C | 7580 | 6360 | 2 | 2 | 0.03% | 0.03% | 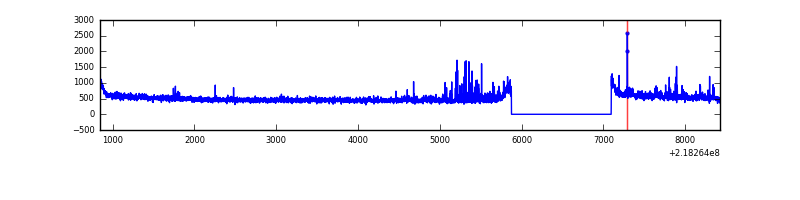 |
| D | 7580 | 6360 | 39 | 39 | 0.51% | 0.61% | 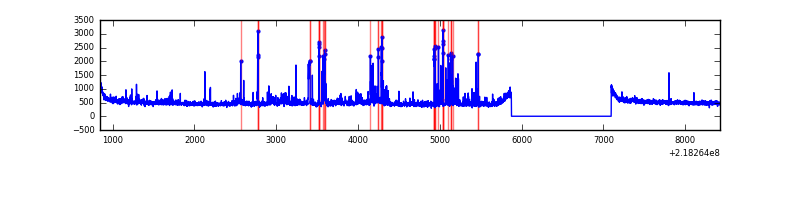 |
Top three noisy pixels from each quadrant. If the there are fewer than three noisy pixels in the level2.evt file, extra rows are filled as -1
| Pixel properties | Quadrant properties | ||||||
|---|---|---|---|---|---|---|---|
| Quadrant | DetID | PixID | Counts | Sigma | Mean | Median | Sigma |
| A | 15 | 236 | 173697 | 1088.73 | 797 | 781 | 158.8 |
| A | 8 | 15 | 22079 | 134.1 | 797 | 781 | 158.8 |
| A | 13 | 251 | 12874 | 76.14 | 797 | 781 | 158.8 |
| B | 5 | 250 | 172386 | 1155.57 | 800 | 781 | 148.5 |
| B | 0 | 219 | 17700 | 113.93 | 800 | 781 | 148.5 |
| B | 12 | 111 | 14573 | 92.87 | 800 | 781 | 148.5 |
| C | 4 | 254 | 158050 | 867.39 | 790 | 794 | 181.3 |
| C | 9 | 54 | 13116 | 67.97 | 790 | 794 | 181.3 |
| C | 13 | 61 | 6110 | 29.32 | 790 | 794 | 181.3 |
| D | 2 | 63 | 168269 | 890.74 | 784 | 761 | 188.1 |
| D | 2 | 152 | 125815 | 664.99 | 784 | 761 | 188.1 |
| D | 13 | 169 | 66218 | 348.08 | 784 | 761 | 188.1 |
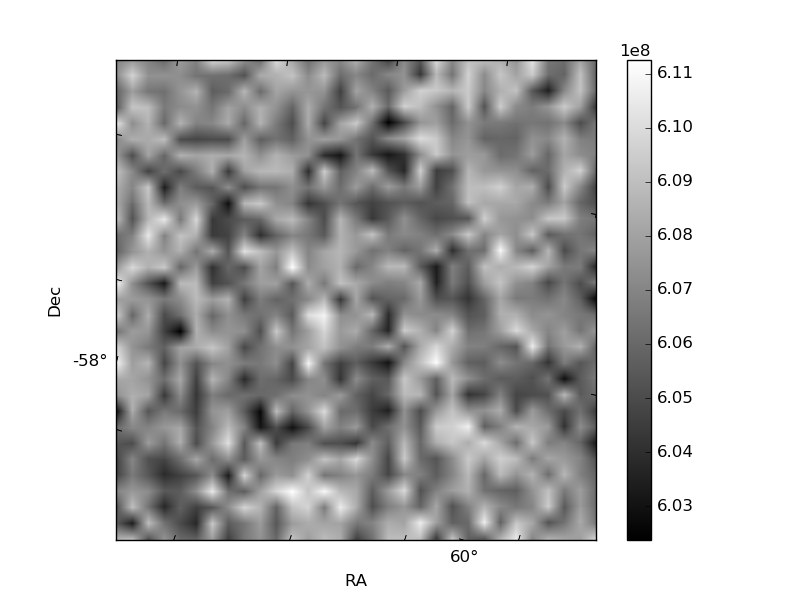
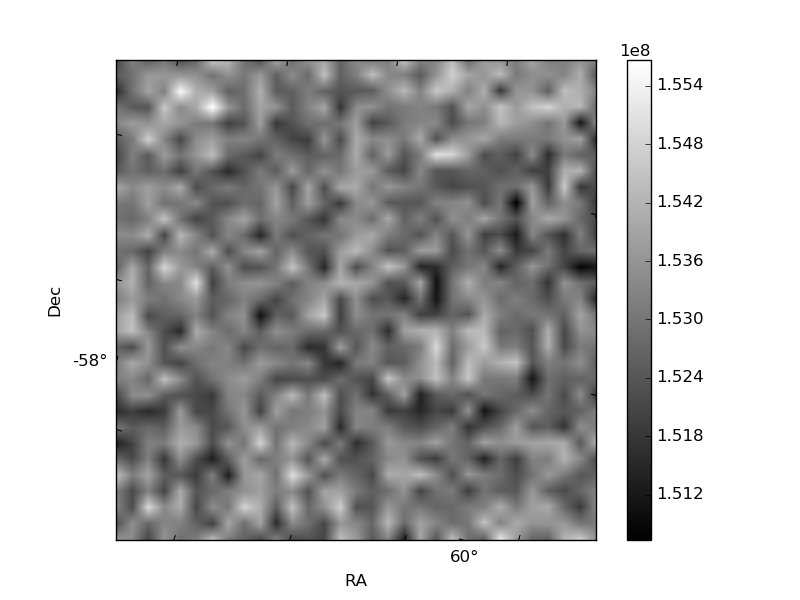
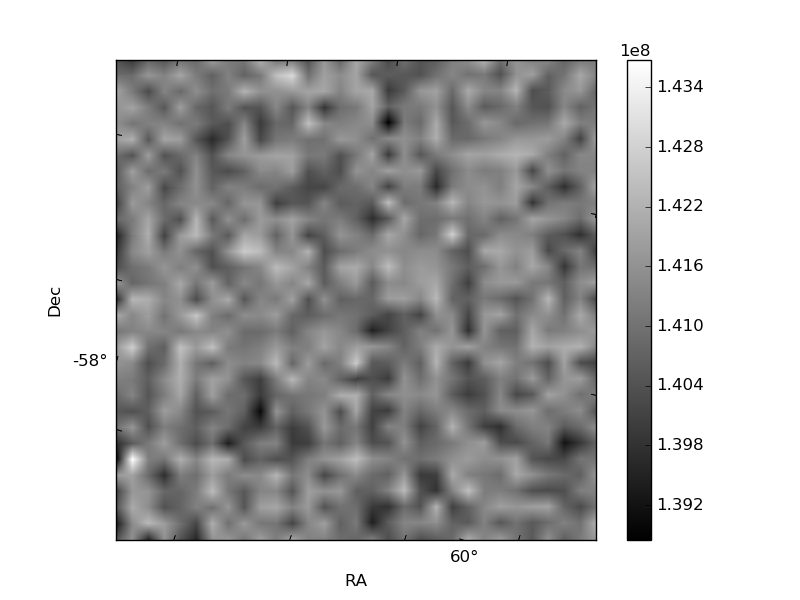
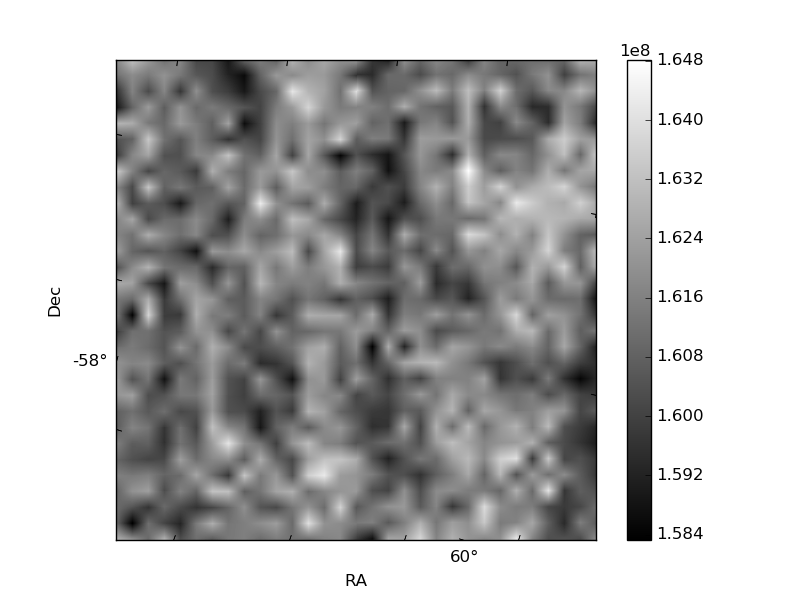
Histogram calculated using DETX and DETY for each event in the final _common_clean file
| Quadrant A | 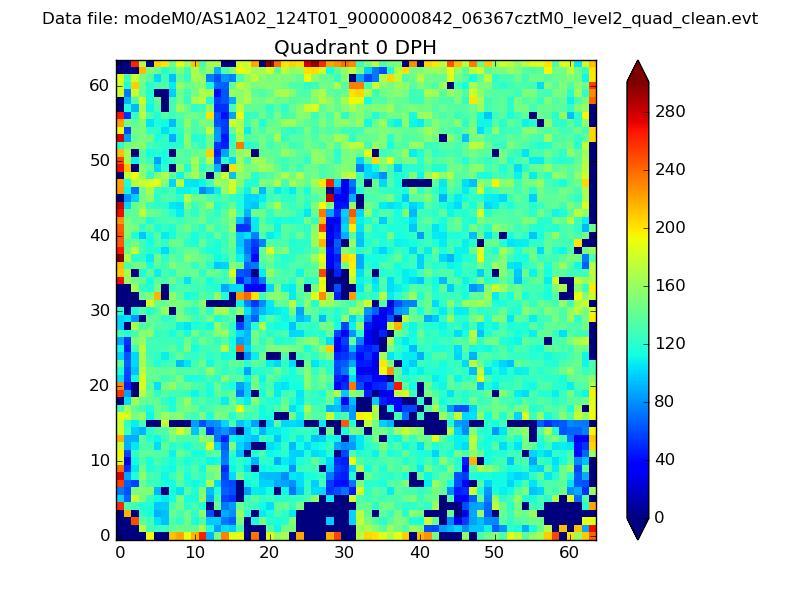 |
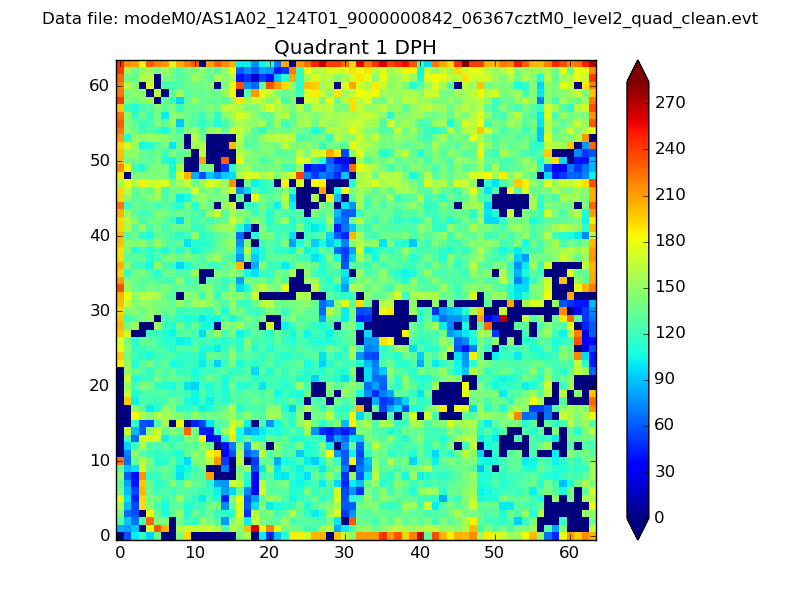 |
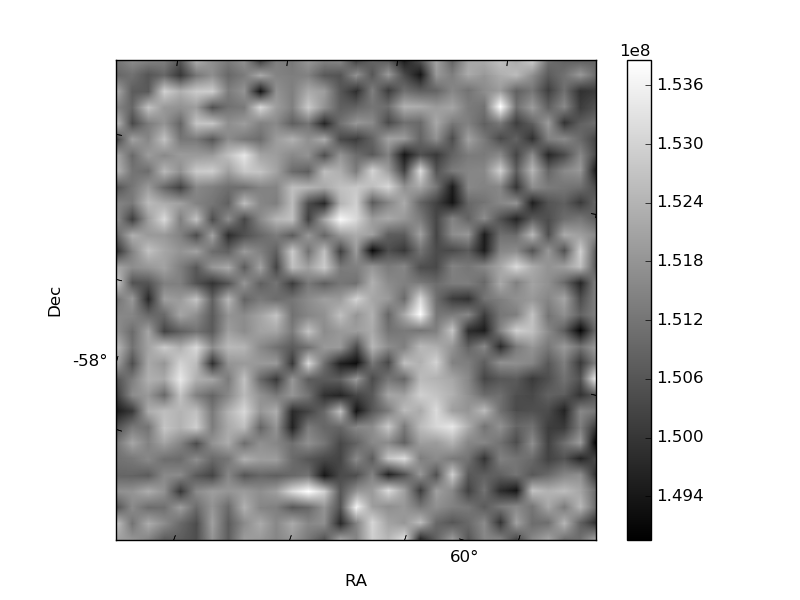
Quadrant B |
|---|---|---|---|
| Quadrant D | 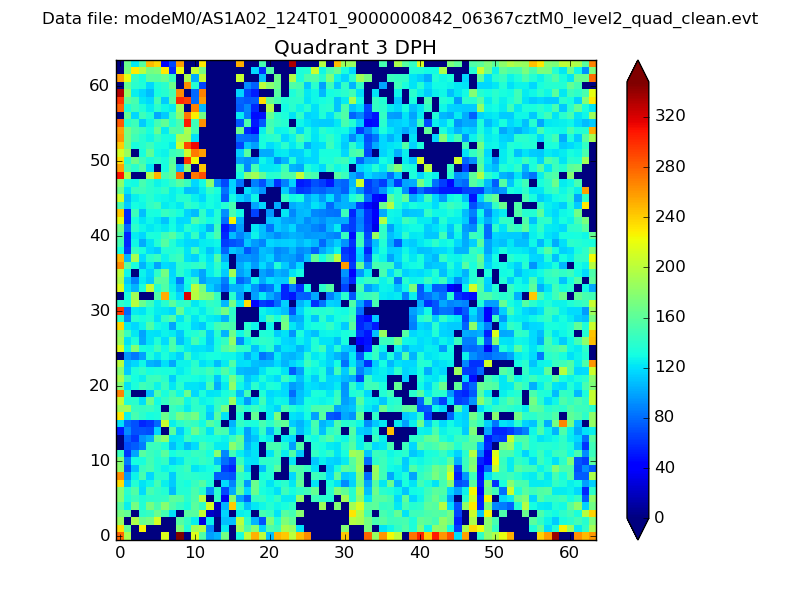 |
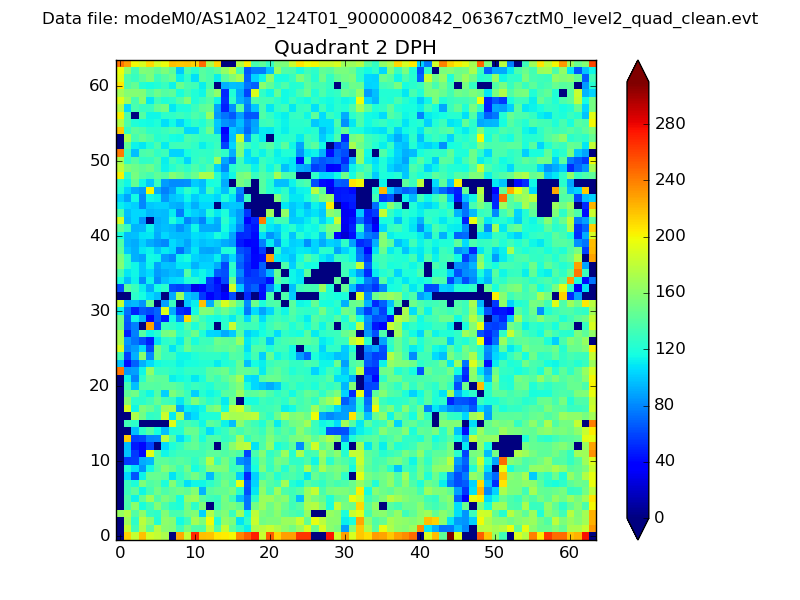 |
Quadrant C |
| Plot type | Count rate plots | Images |
|---|---|---|
| Comparison with Poisson distribution Blue bars denote a histogram of data divided into 1 sec bins. Red curve is a Poisson curve with rate = median count rate of data. |
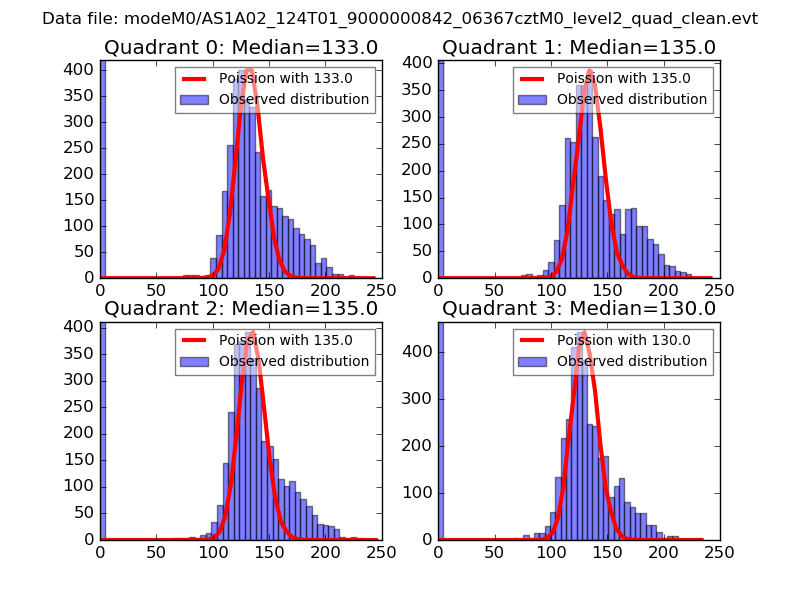 |
 |
| Quadrant-wise count rates Data is divided into 100 sec bins |
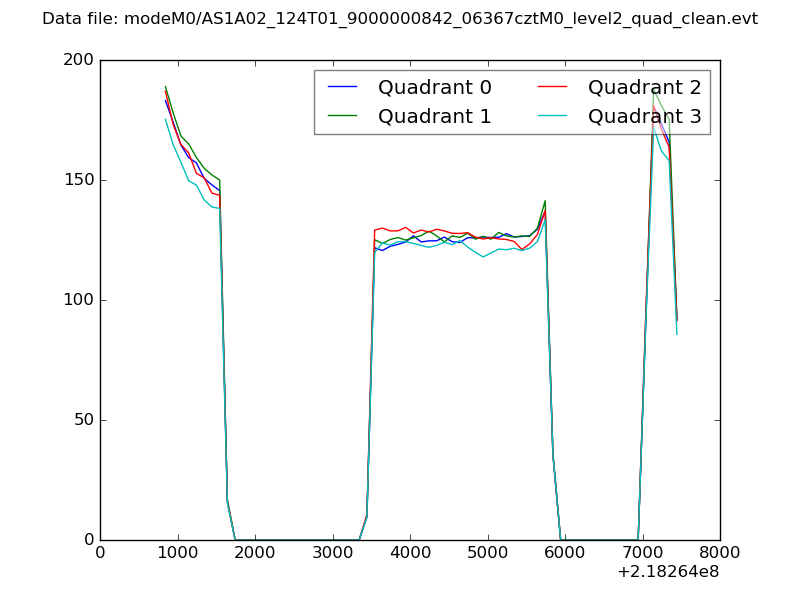 |
|
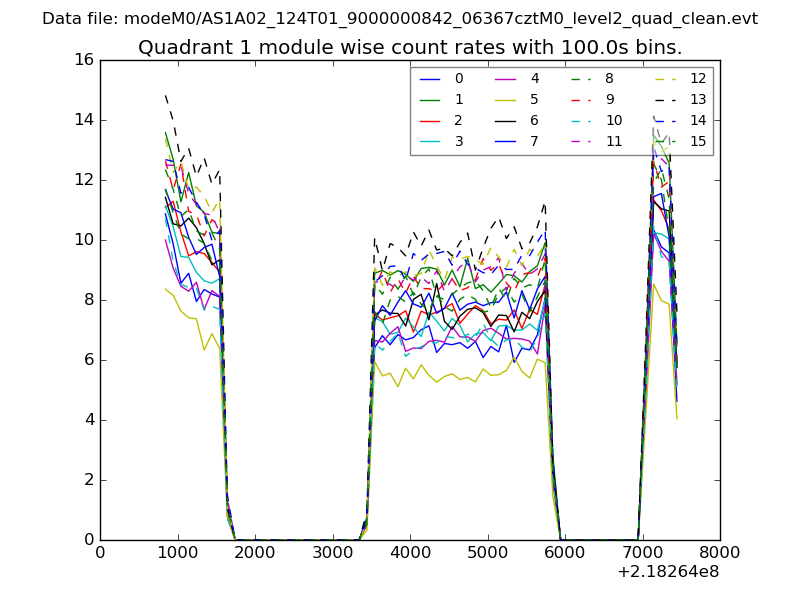
| Module-wise count rates for Quadrant A Data is divided into 100 sec bins |
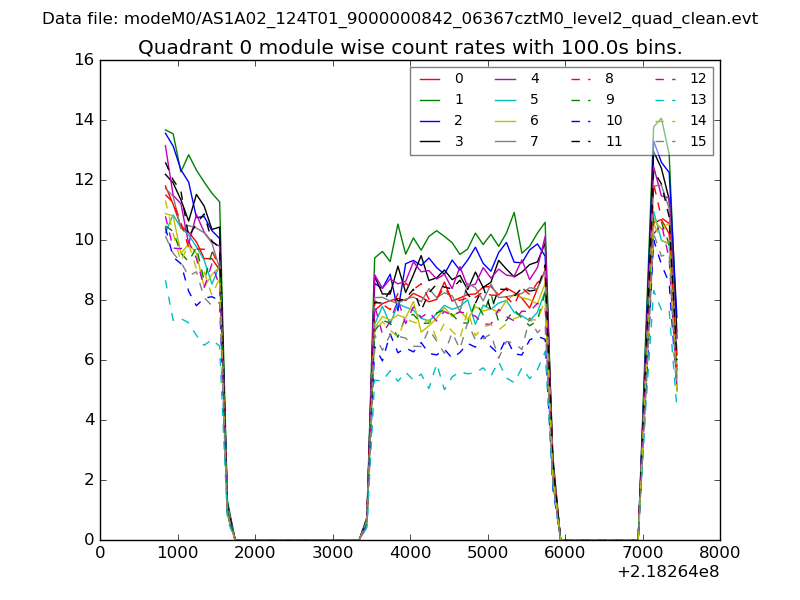 |
 |
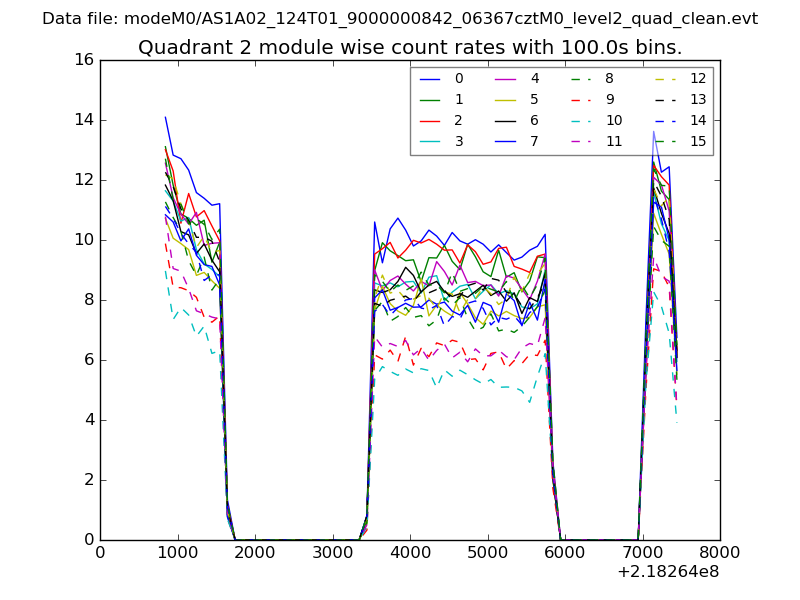
| Module-wise count rates for Quadrant B Data is divided into 100 sec bins |
 |
 |
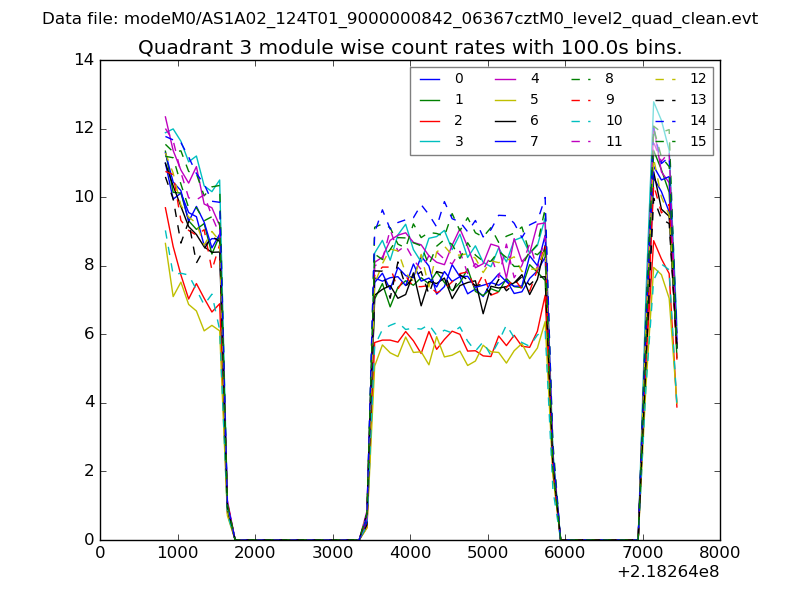
| Module-wise count rates for Quadrant C Data is divided into 100 sec bins |
 |
 |
| Module-wise count rates for Quadrant D Data is divided into 100 sec bins |
 |
 |
| Parameter | Plot |
|---|---|
| CZT HV Monitor | 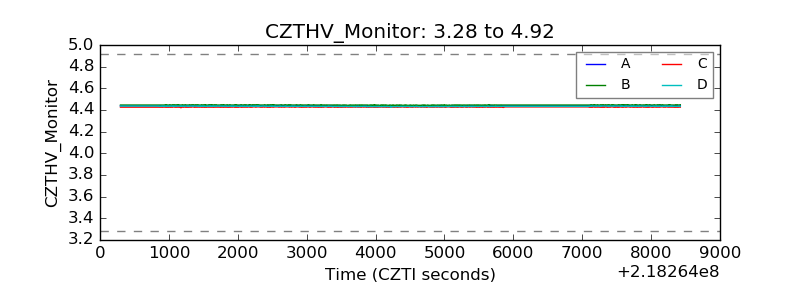 |
| D_VDD | 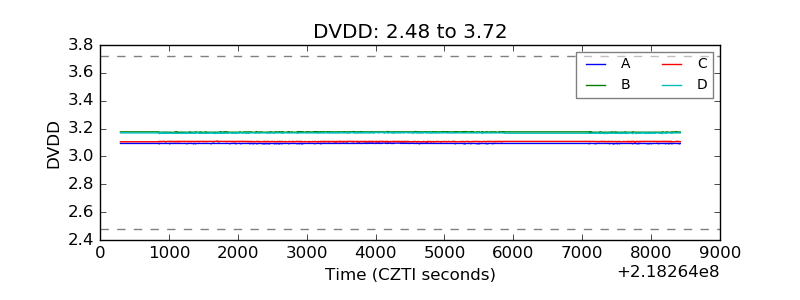 |
| Temperature 1 | 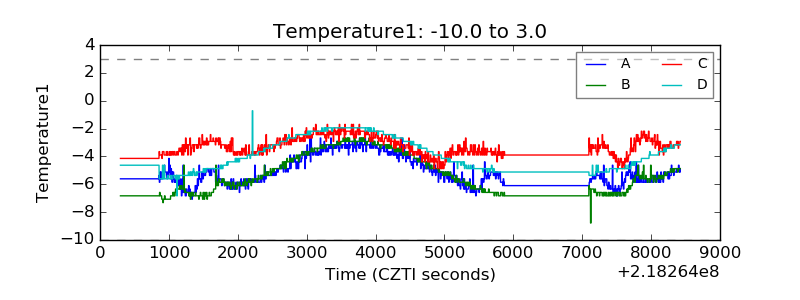 |
| Veto HV Monitor | 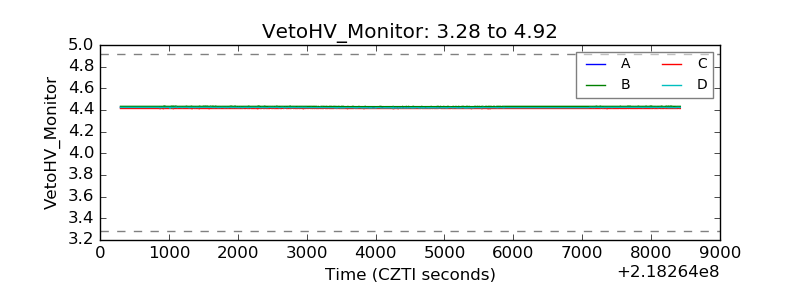 |
| Veto LLD | 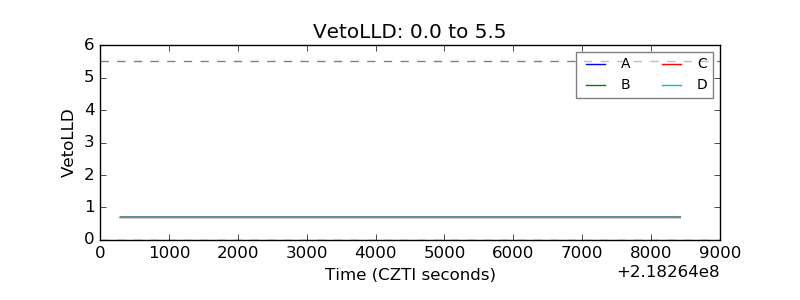 |
| Alpha Counter | 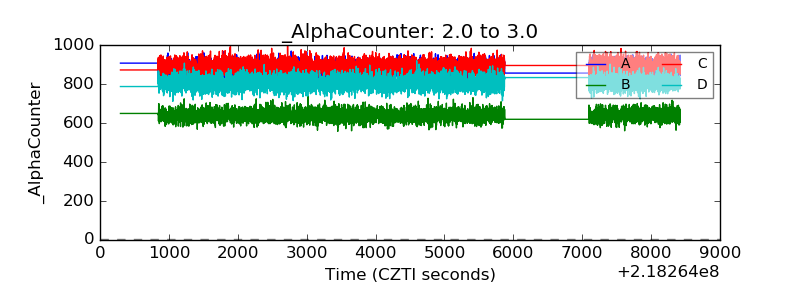 |
| _CPM_Rate | 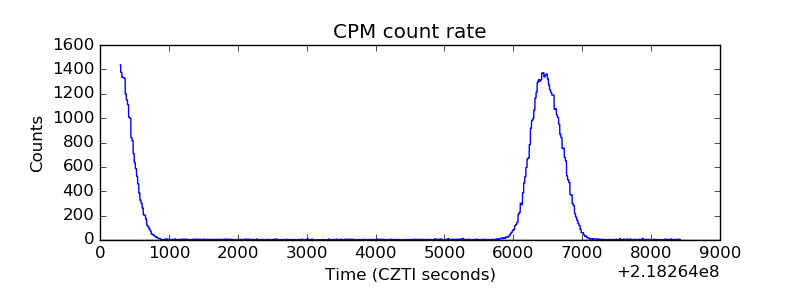 |
| CZT Counter | 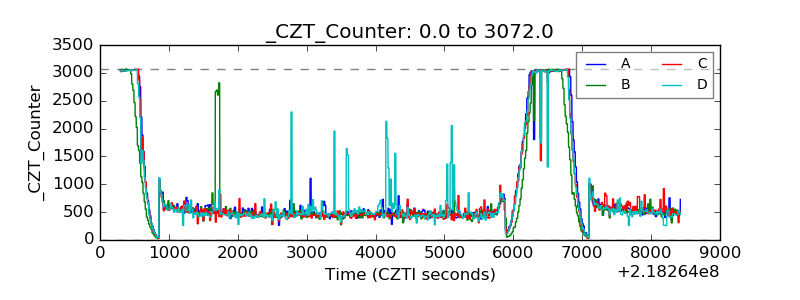 |
| +2.5 Volts monitor |  |
| +5 Volts monitor |  |
| _ROLL_ROT | 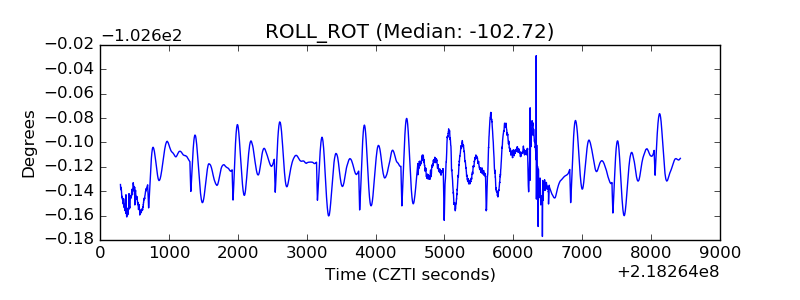 |
| _Roll_DEC | 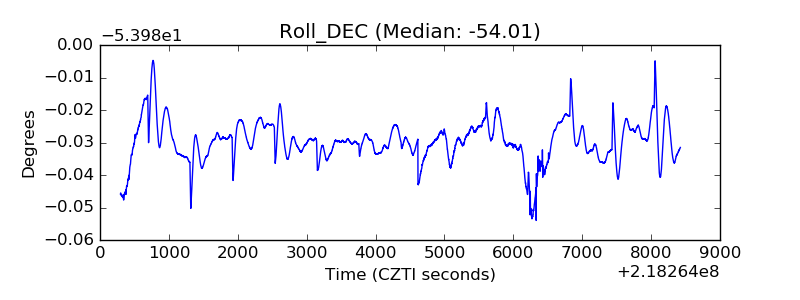 |
| _Roll_RA | 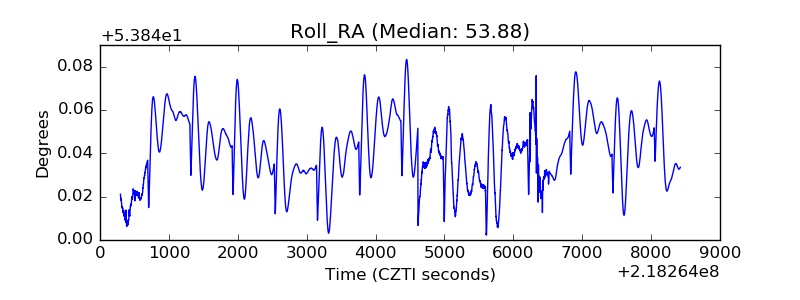 |
| Veto Counter | 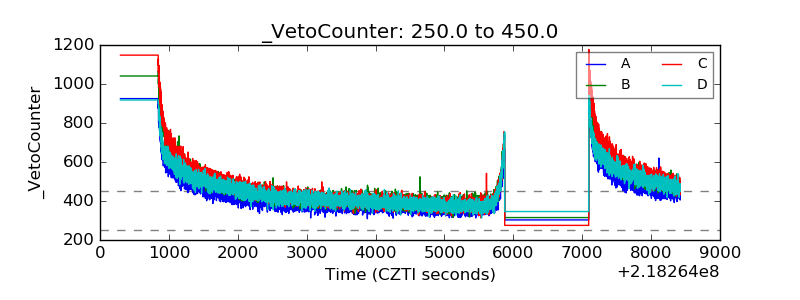 |