| Param | Original file | Final file |
|---|---|---|
| Filename | modeM0/AS1A02_124T01_9000000842_06368cztM0_level2.evt | modeM0/AS1A02_124T01_9000000842_06368cztM0_level2_quad_clean.evt |
| Size (bytes) | 467,812,800 | 69,151,680 |
| Size | 446.1 MB | 65.9 MB |
| Events in quadrant A | 3,270,626 | 415,008 |
| Events in quadrant B | 3,239,091 | 422,284 |
| Events in quadrant C | 3,393,639 | 418,878 |
| Events in quadrant D | 3,839,813 | 401,041 |
| Mode M9 | |||
|---|---|---|---|
| Quadrant | BADHDUFLAG | Total packets | Discarded packets |
| A | 0 | 17 | 0 |
| B | 0 | 17 | 0 |
| C | 0 | 17 | 0 |
| D | 0 | 18 | 0 |
| Mode M0 | |||
|---|---|---|---|
| Quadrant | BADHDUFLAG | Total packets | Discarded packets |
| A | 0 | 13421 | 3 |
| B | 0 | 13407 | 2 |
| C | 0 | 14089 | 2 |
| D | 0 | 15490 | 2 |
| Mode SS | |||
|---|---|---|---|
| Quadrant | BADHDUFLAG | Total packets | Discarded packets |
| A | 0 | 128 | 0 |
| B | 0 | 128 | 0 |
| C | 0 | 128 | 0 |
| D | 0 | 128 | 0 |
| Quadrant | Total seconds | Saturated seconds | Saturation percentage |
|---|---|---|---|
| A | 6250 | 92 | 1.472000% |
| B | 6250 | 102 | 1.632000% |
| C | 6250 | 135 | 2.160000% |
| D | 6250 | 108 | 1.728000% |
Noise dominated data is calculated using 1-second bins in cleaned event files. If a bin has >2000 counts, and if more than 50% of those come from <1% of pixels, then it is considered to be noise-dominated and hence unusable.
| Quadrant | # 1 sec bins | Bins with >0 counts | Bins with >2000 counts | High rate bins dominated by noise | Noise dominated (total time) | Noise dominated (detector-on time) | Marked lightcurve |
|---|---|---|---|---|---|---|---|
| A | 7524 | 6250 | 0 | 0 | 0.00% | 0.00% | 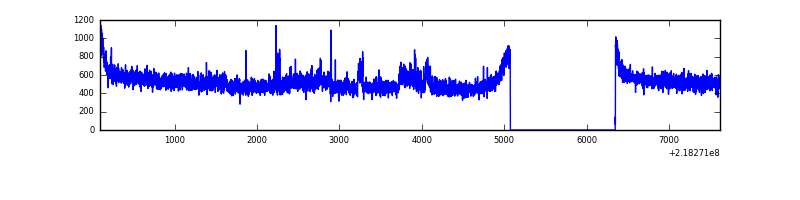 |
| B | 7524 | 6250 | 4 | 4 | 0.05% | 0.06% | 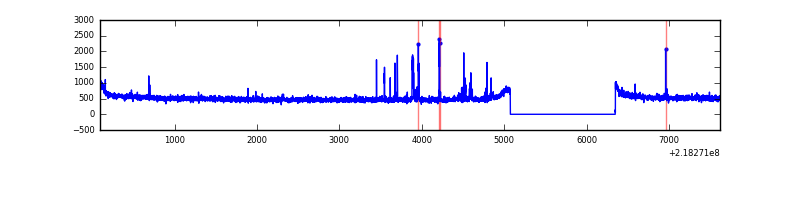 |
| C | 7524 | 6250 | 30 | 30 | 0.40% | 0.48% | 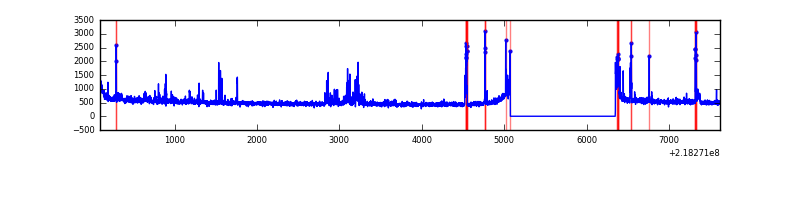 |
| D | 7524 | 6250 | 29 | 29 | 0.39% | 0.46% | 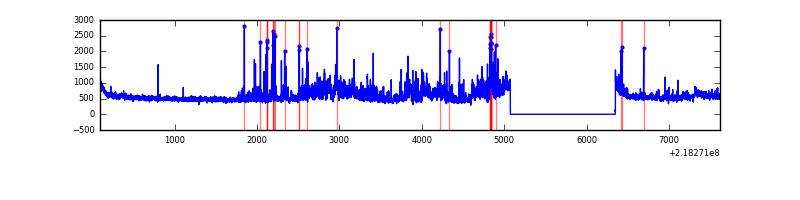 |
Top three noisy pixels from each quadrant. If the there are fewer than three noisy pixels in the level2.evt file, extra rows are filled as -1
| Pixel properties | Quadrant properties | ||||||
|---|---|---|---|---|---|---|---|
| Quadrant | DetID | PixID | Counts | Sigma | Mean | Median | Sigma |
| A | 15 | 236 | 173442 | 1095.3 | 795 | 778 | 157.6 |
| A | 8 | 15 | 28321 | 174.72 | 795 | 778 | 157.6 |
| A | 0 | 226 | 7669 | 43.71 | 795 | 778 | 157.6 |
| B | 0 | 228 | 74728 | 494.65 | 800 | 782 | 149.5 |
| B | 0 | 219 | 49462 | 325.64 | 800 | 782 | 149.5 |
| B | 12 | 111 | 14409 | 91.16 | 800 | 782 | 149.5 |
| C | 4 | 254 | 176460 | 982.13 | 780 | 784 | 178.9 |
| C | 1 | 241 | 166051 | 923.94 | 780 | 784 | 178.9 |
| C | 9 | 54 | 8561 | 43.48 | 780 | 784 | 178.9 |
| D | 2 | 63 | 577824 | 3084.39 | 780 | 758 | 187.1 |
| D | 2 | 152 | 167485 | 891.15 | 780 | 758 | 187.1 |
| D | 12 | 221 | 52439 | 276.23 | 780 | 758 | 187.1 |
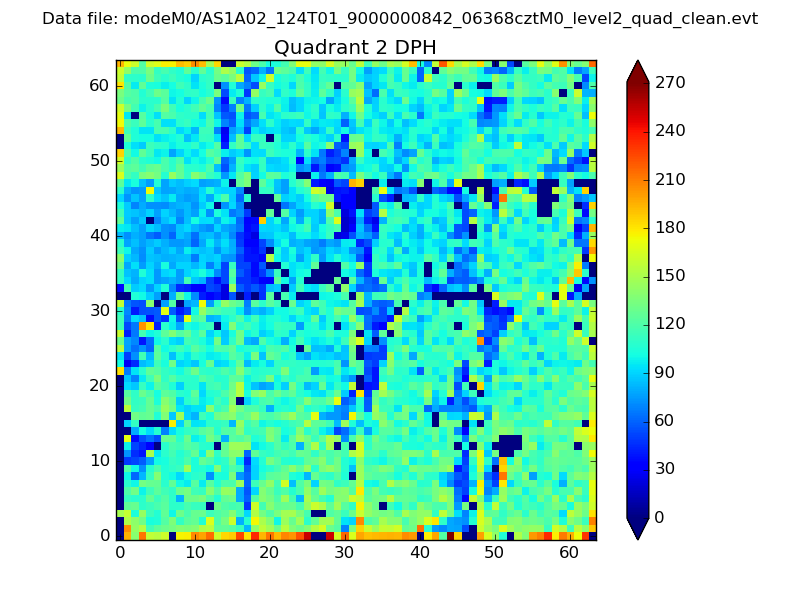
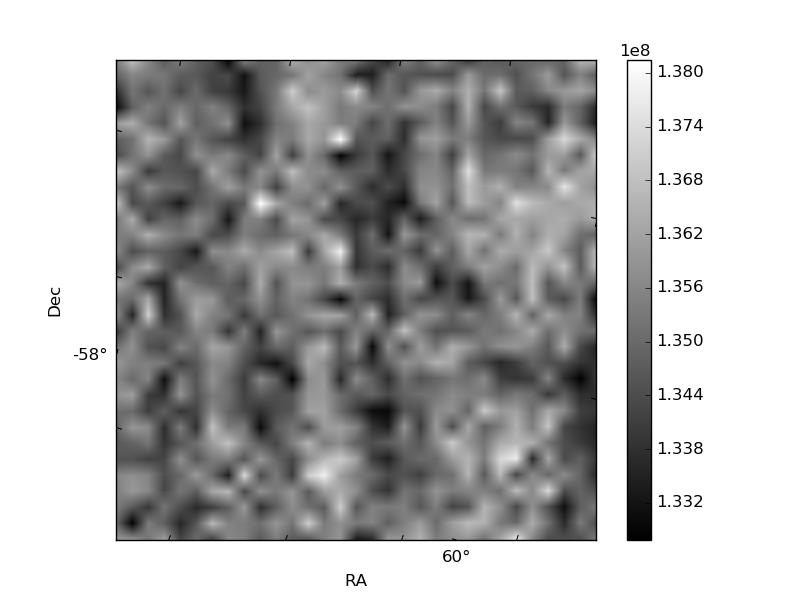
Histogram calculated using DETX and DETY for each event in the final _common_clean file
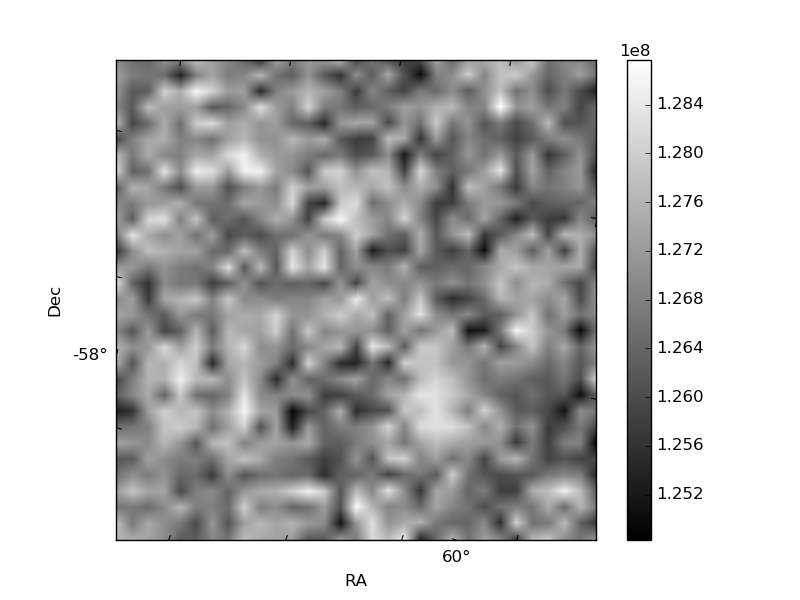
| Quadrant A | 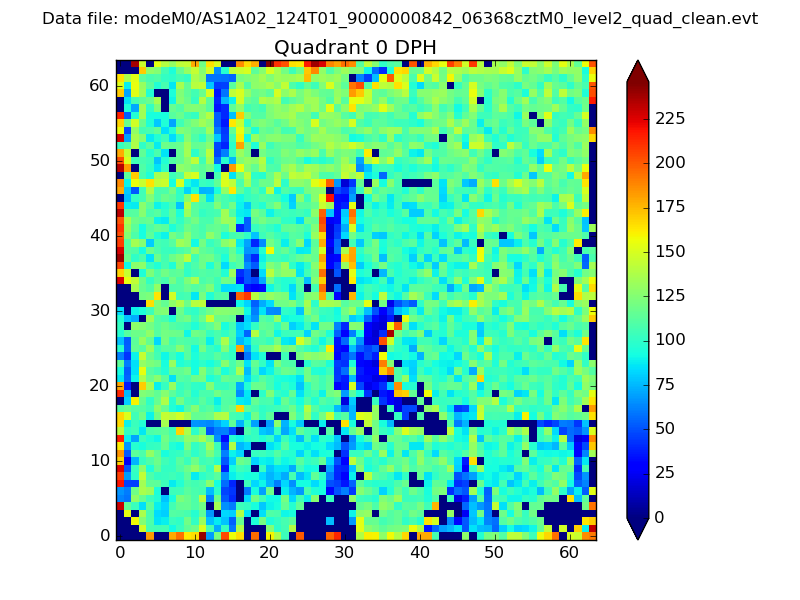 |
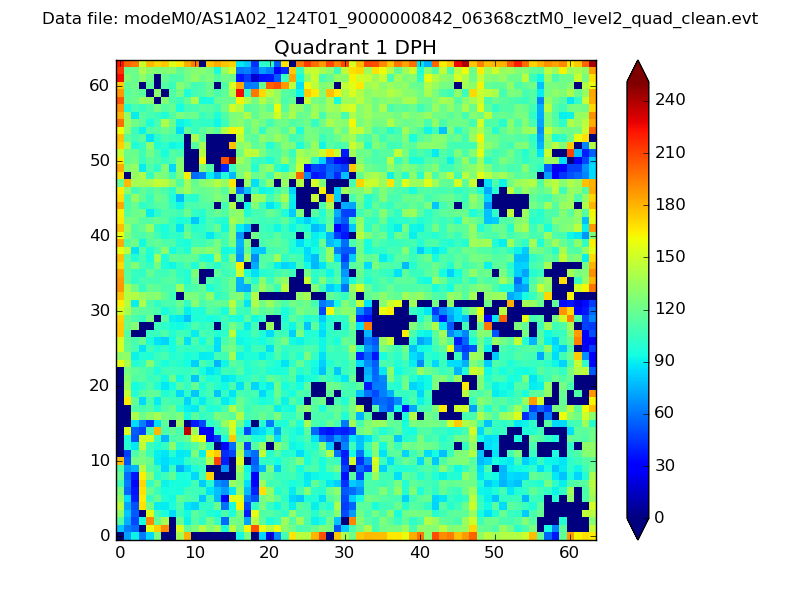 |
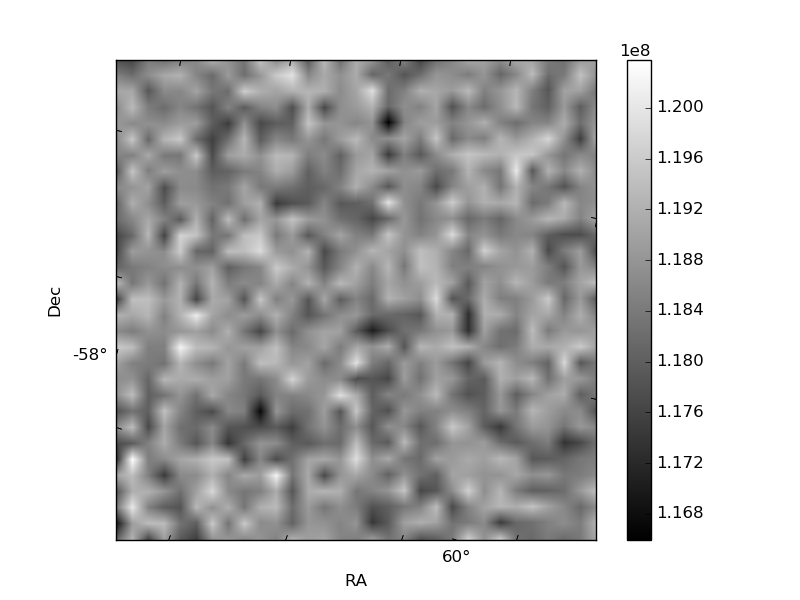
Quadrant B |
|---|---|---|---|
| Quadrant D | 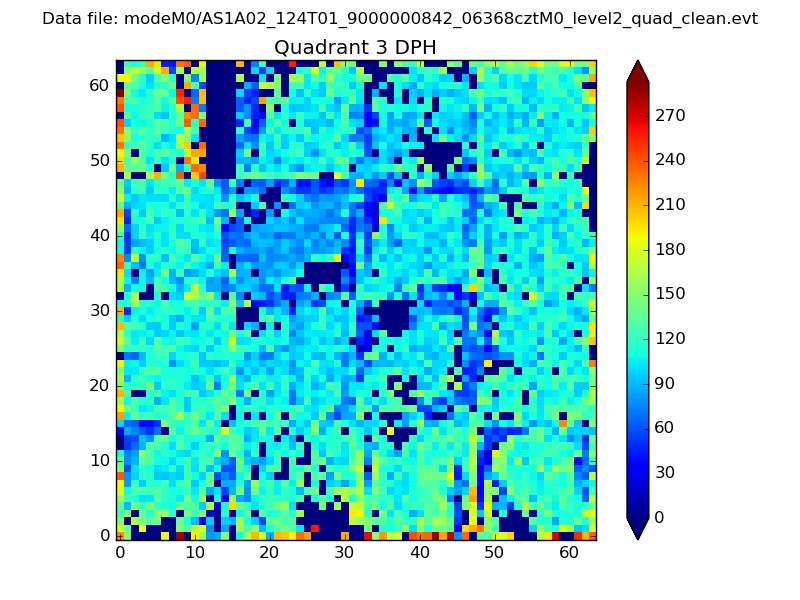 |
 |
Quadrant C |
| Plot type | Count rate plots | Images |
|---|---|---|
| Comparison with Poisson distribution Blue bars denote a histogram of data divided into 1 sec bins. Red curve is a Poisson curve with rate = median count rate of data. |
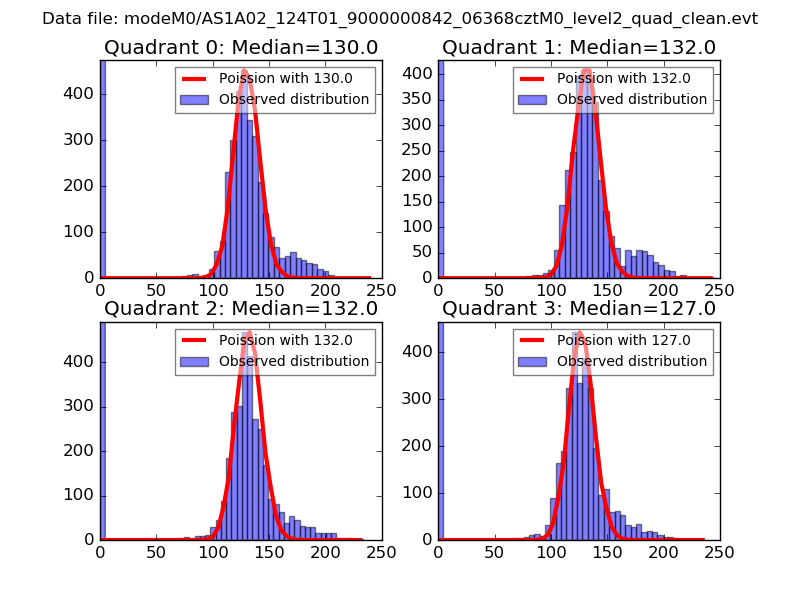 |
 |
| Quadrant-wise count rates Data is divided into 100 sec bins |
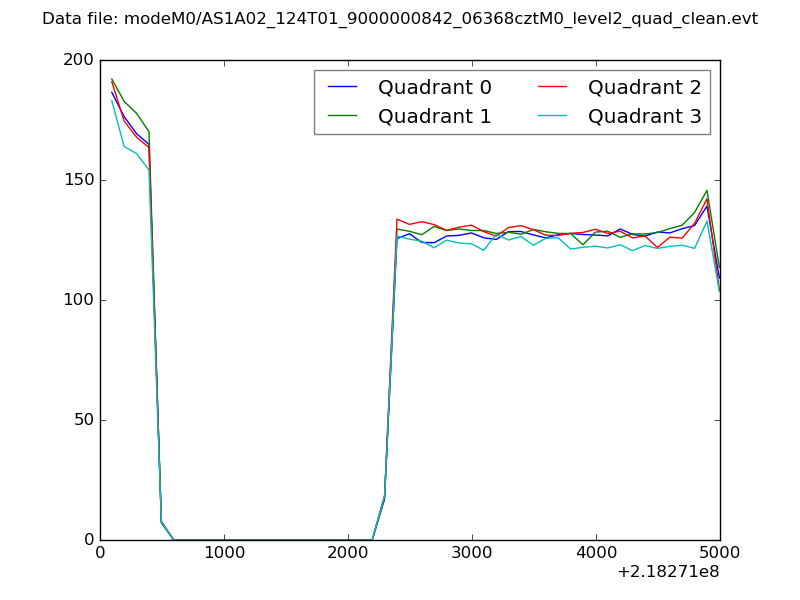 |
|
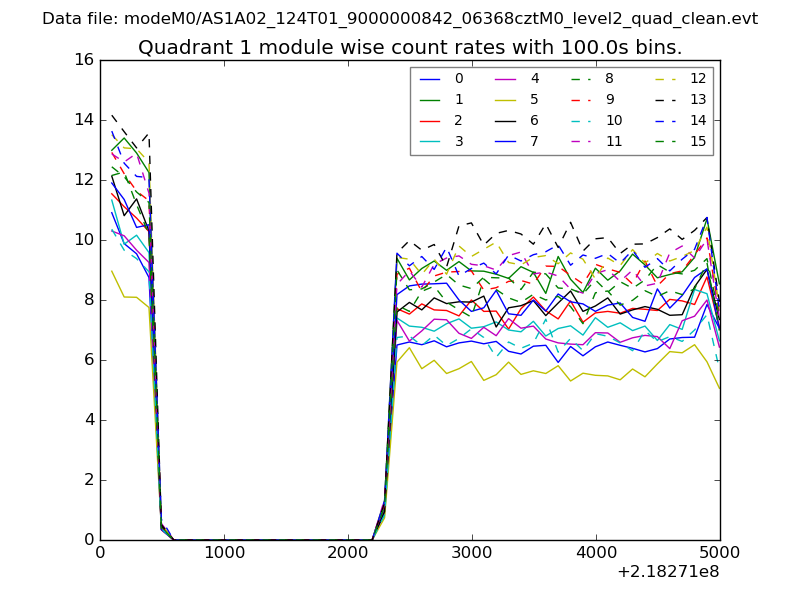
| Module-wise count rates for Quadrant A Data is divided into 100 sec bins |
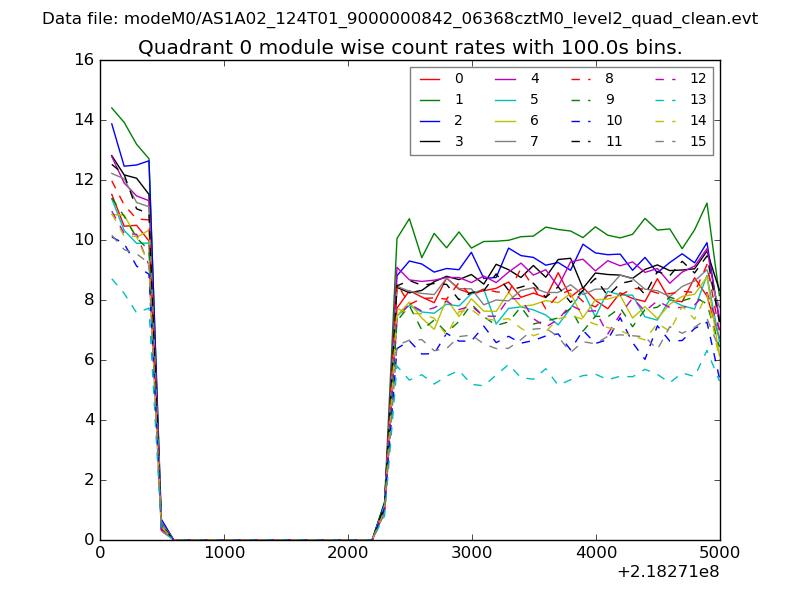 |
 |
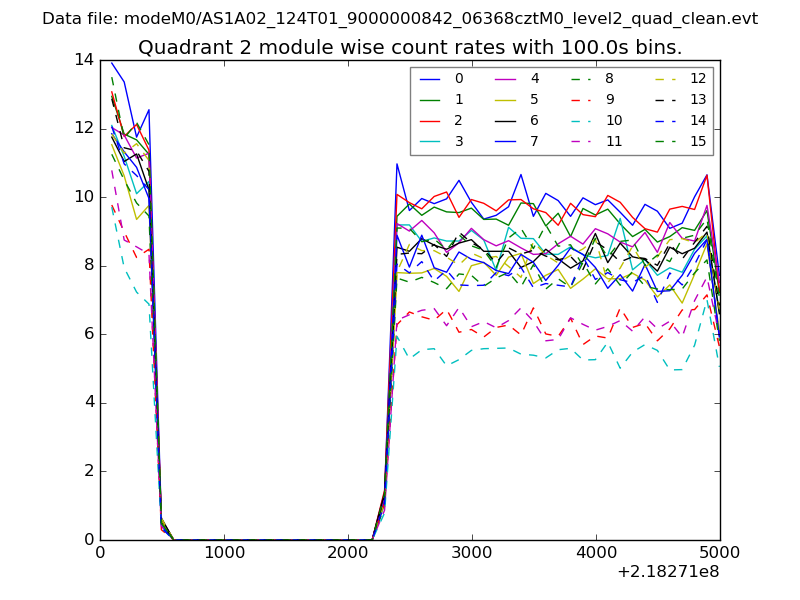
| Module-wise count rates for Quadrant B Data is divided into 100 sec bins |
 |
 |
| Module-wise count rates for Quadrant C Data is divided into 100 sec bins |
 |
 |
| Module-wise count rates for Quadrant D Data is divided into 100 sec bins |
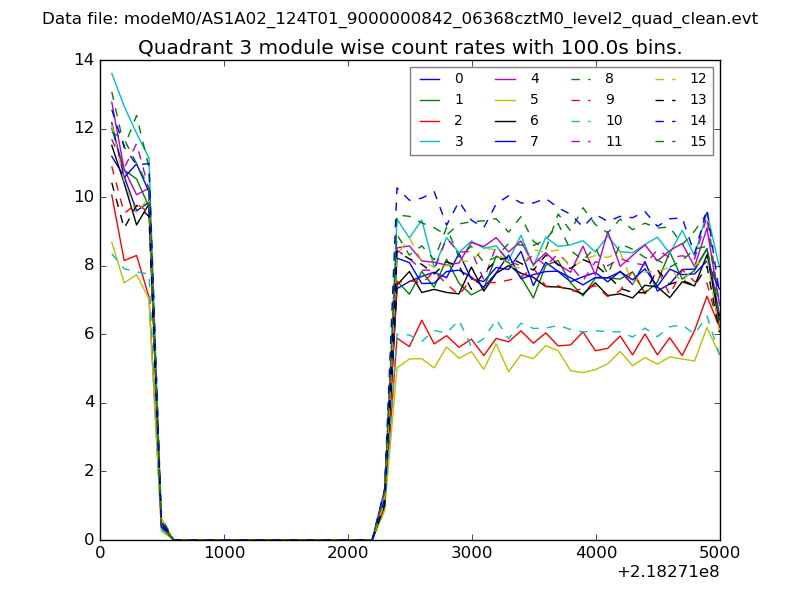 |
 |
| Parameter | Plot |
|---|---|
| CZT HV Monitor | 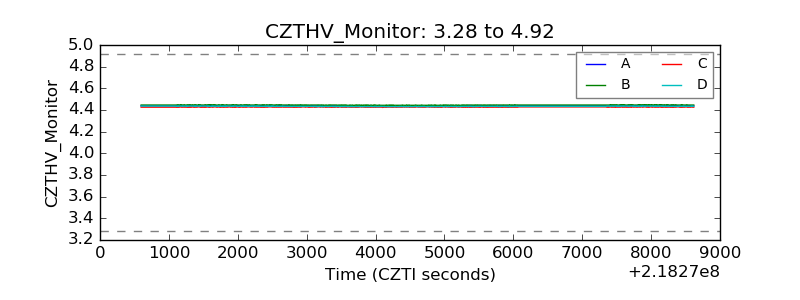 |
| D_VDD | 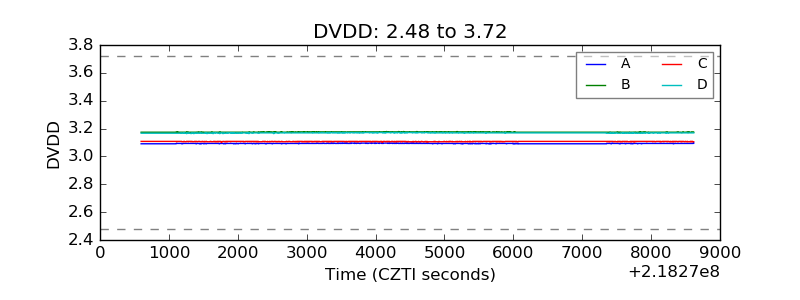 |
| Temperature 1 | 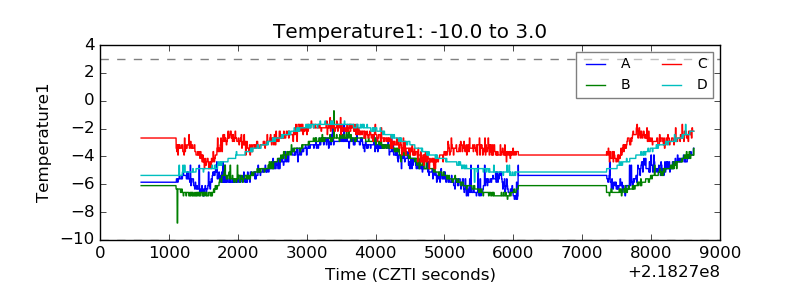 |
| Veto HV Monitor | 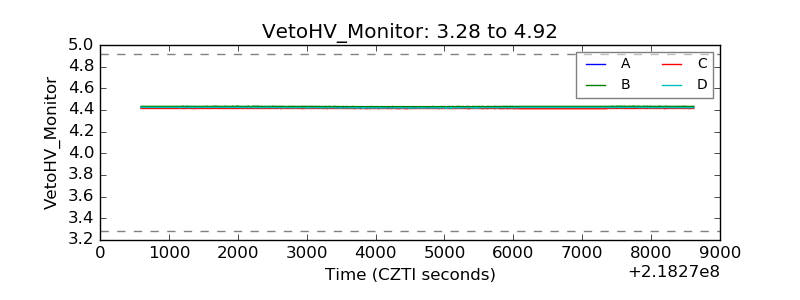 |
| Veto LLD | 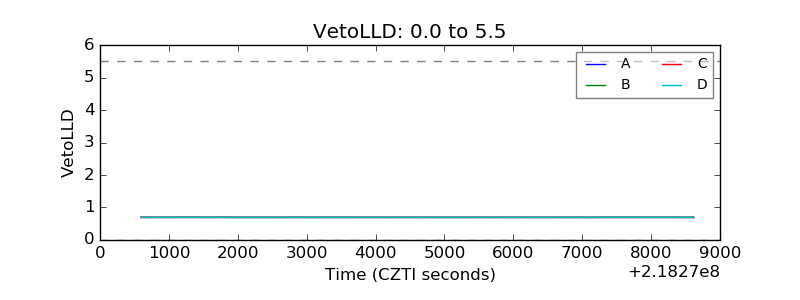 |
| Alpha Counter | 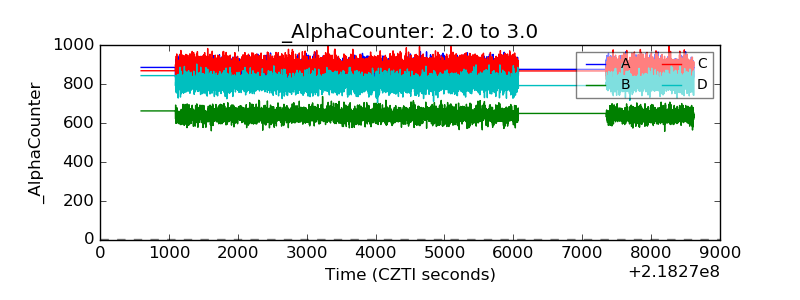 |
| _CPM_Rate | 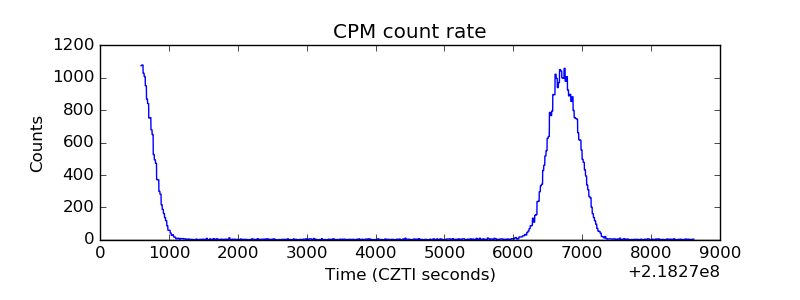 |
| CZT Counter | 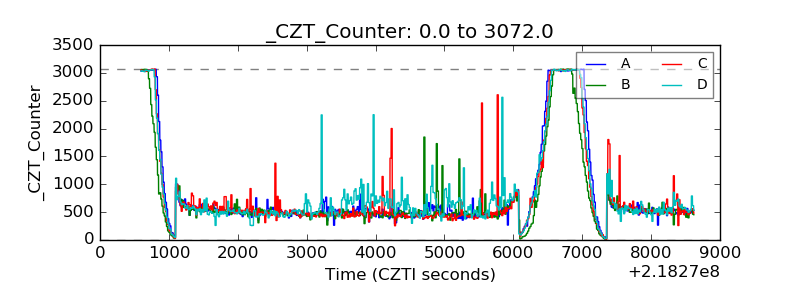 |
| +2.5 Volts monitor | 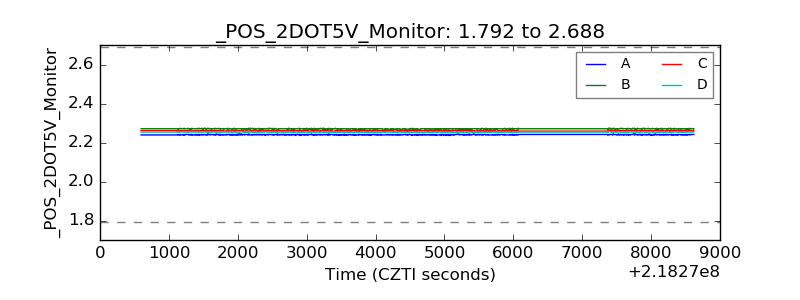 |
| +5 Volts monitor |  |
| _ROLL_ROT | 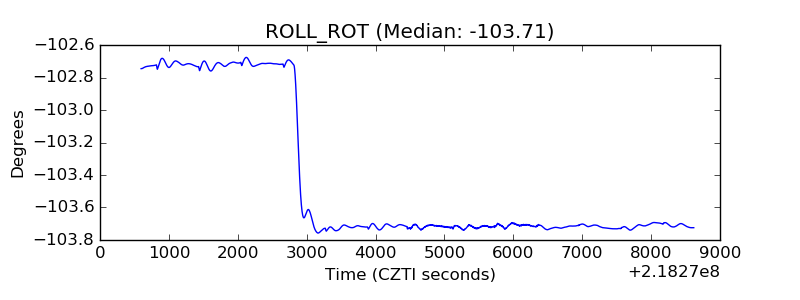 |
| _Roll_DEC | 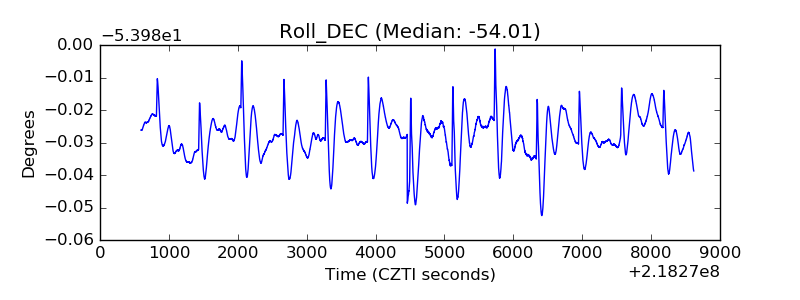 |
| _Roll_RA |  |
| Veto Counter | 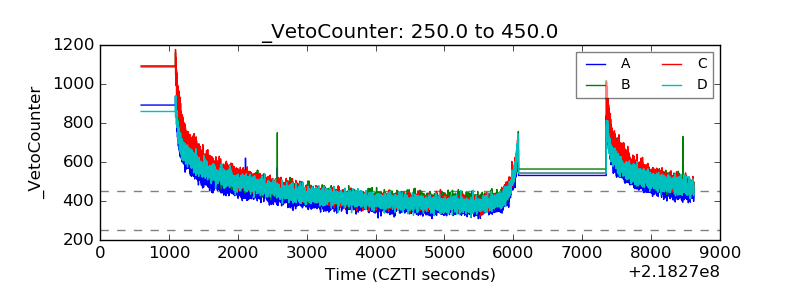 |