| Param | Original file | Final file |
|---|---|---|
| Filename | modeM0/AS1A02_124T01_9000000842_06369cztM0_level2.evt | modeM0/AS1A02_124T01_9000000842_06369cztM0_level2_quad_clean.evt |
| Size (bytes) | 505,759,680 | 65,410,560 |
| Size | 482.3 MB | 62.4 MB |
| Events in quadrant A | 3,266,576 | 395,467 |
| Events in quadrant B | 3,243,743 | 399,366 |
| Events in quadrant C | 3,559,139 | 395,107 |
| Events in quadrant D | 4,813,480 | 343,948 |
| Mode M9 | |||
|---|---|---|---|
| Quadrant | BADHDUFLAG | Total packets | Discarded packets |
| A | 0 | 17 | 0 |
| B | 0 | 17 | 0 |
| C | 0 | 17 | 0 |
| D | 0 | 18 | 0 |
| Mode M0 | |||
|---|---|---|---|
| Quadrant | BADHDUFLAG | Total packets | Discarded packets |
| A | 0 | 13475 | 3 |
| B | 0 | 13501 | 2 |
| C | 0 | 14501 | 2 |
| D | 0 | 18390 | 2 |
| Mode SS | |||
|---|---|---|---|
| Quadrant | BADHDUFLAG | Total packets | Discarded packets |
| A | 0 | 130 | 0 |
| B | 0 | 130 | 0 |
| C | 0 | 130 | 0 |
| D | 0 | 130 | 0 |
| Quadrant | Total seconds | Saturated seconds | Saturation percentage |
|---|---|---|---|
| A | 6393 | 75 | 1.173158% |
| B | 6393 | 71 | 1.110590% |
| C | 6393 | 124 | 1.939621% |
| D | 6393 | 586 | 9.166276% |
Noise dominated data is calculated using 1-second bins in cleaned event files. If a bin has >2000 counts, and if more than 50% of those come from <1% of pixels, then it is considered to be noise-dominated and hence unusable.
| Quadrant | # 1 sec bins | Bins with >0 counts | Bins with >2000 counts | High rate bins dominated by noise | Noise dominated (total time) | Noise dominated (detector-on time) | Marked lightcurve |
|---|---|---|---|---|---|---|---|
| A | 7668 | 6395 | 4 | 4 | 0.05% | 0.06% | 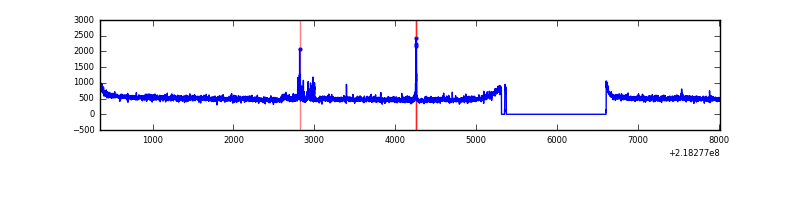 |
| B | 7668 | 6395 | 1 | 1 | 0.01% | 0.02% | 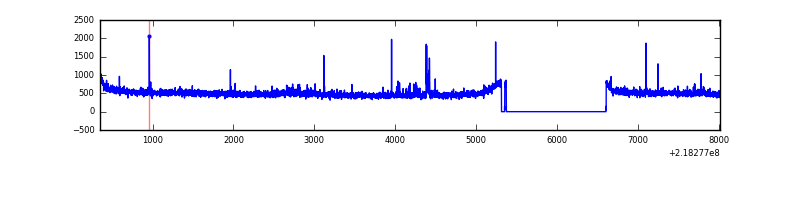 |
| C | 7668 | 6395 | 43 | 43 | 0.56% | 0.67% | 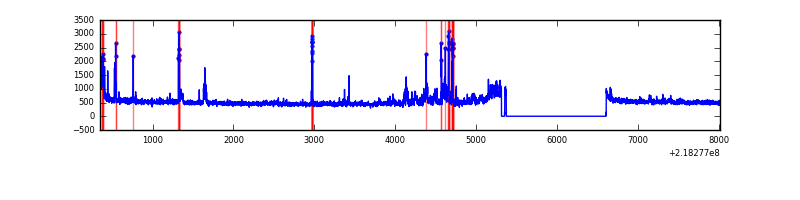 |
| D | 7668 | 6395 | 506 | 506 | 6.60% | 7.91% | 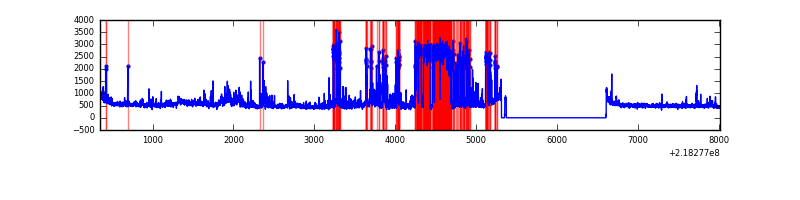 |
Top three noisy pixels from each quadrant. If the there are fewer than three noisy pixels in the level2.evt file, extra rows are filled as -1
| Pixel properties | Quadrant properties | ||||||
|---|---|---|---|---|---|---|---|
| Quadrant | DetID | PixID | Counts | Sigma | Mean | Median | Sigma |
| A | 15 | 236 | 140038 | 874.18 | 795 | 777 | 159.3 |
| A | 8 | 15 | 42604 | 262.56 | 795 | 777 | 159.3 |
| A | 15 | 174 | 15137 | 90.14 | 795 | 777 | 159.3 |
| B | 0 | 219 | 94541 | 621.99 | 799 | 780 | 150.7 |
| B | 10 | 246 | 22375 | 143.26 | 799 | 780 | 150.7 |
| B | 14 | 167 | 20015 | 127.6 | 799 | 780 | 150.7 |
| C | 4 | 254 | 326613 | 1836.56 | 775 | 779 | 177.4 |
| C | 1 | 241 | 205012 | 1151.16 | 775 | 779 | 177.4 |
| C | 13 | 61 | 6125 | 30.13 | 775 | 779 | 177.4 |
| D | 2 | 63 | 1575280 | 8667.37 | 750 | 728 | 181.7 |
| D | 2 | 152 | 207940 | 1140.63 | 750 | 728 | 181.7 |
| D | 12 | 221 | 111932 | 612.14 | 750 | 728 | 181.7 |
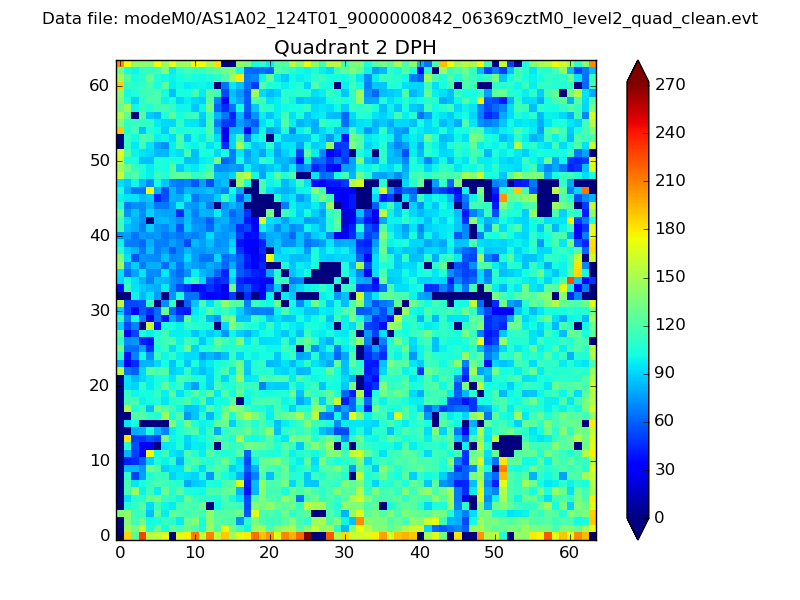
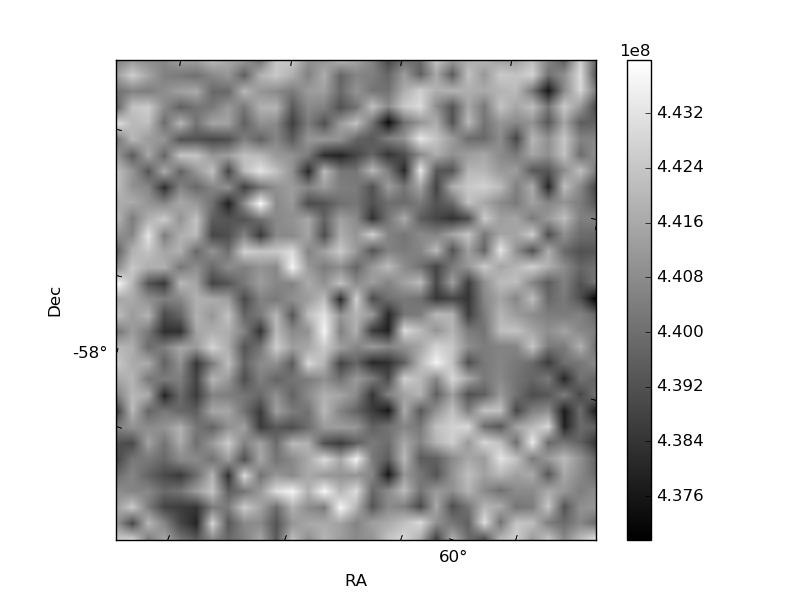
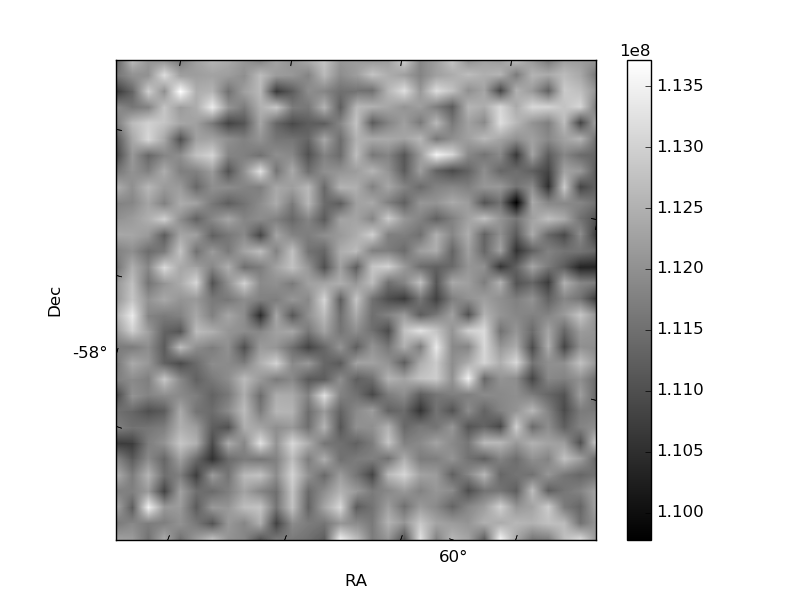
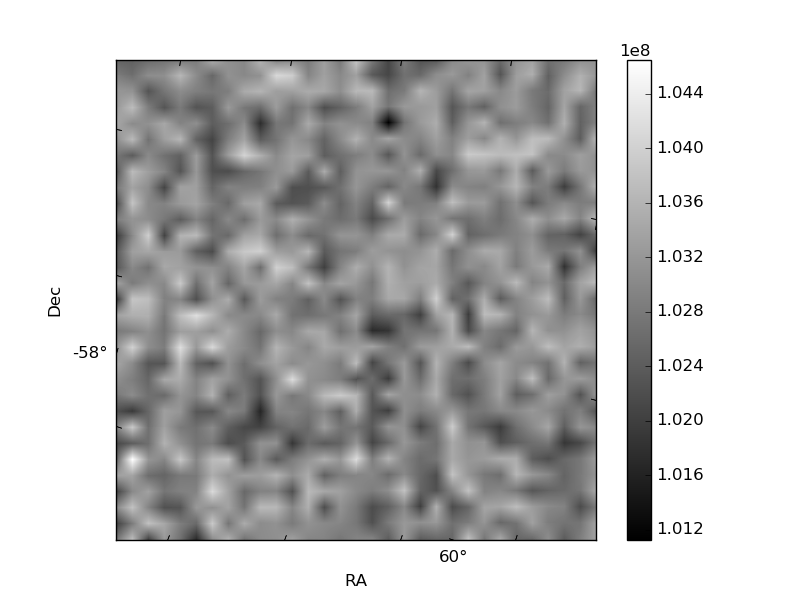
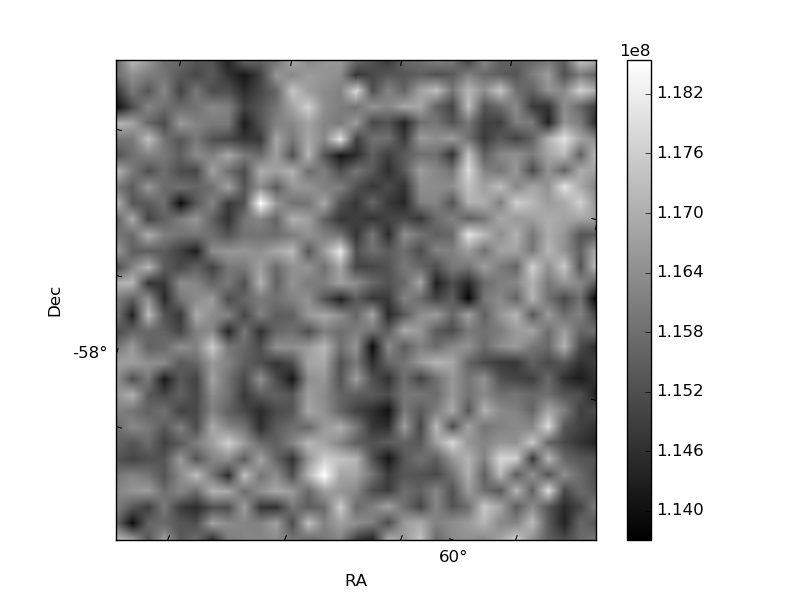
Histogram calculated using DETX and DETY for each event in the final _common_clean file
| Quadrant A | 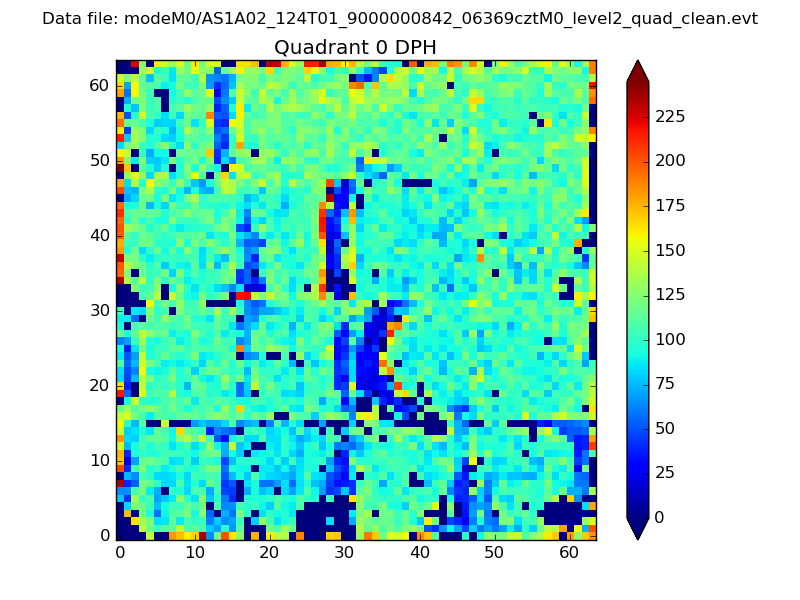 |
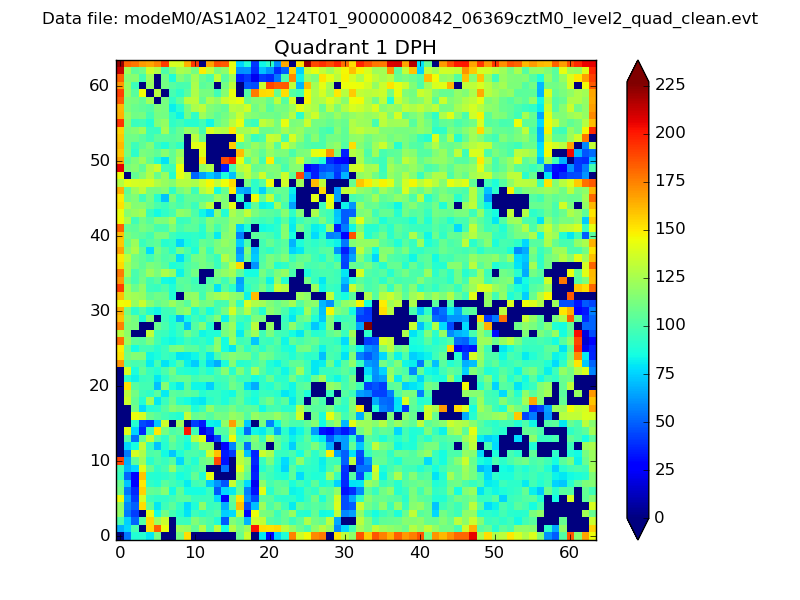 |
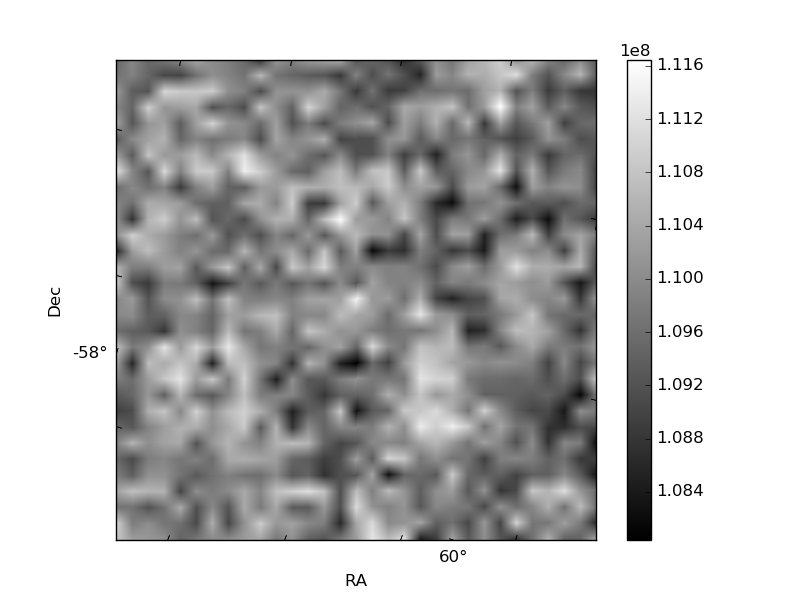
Quadrant B |
|---|---|---|---|
| Quadrant D | 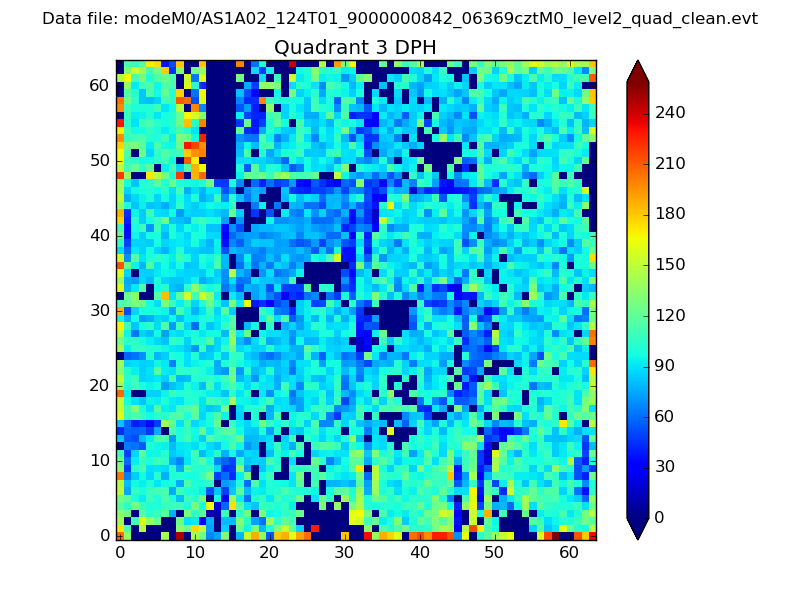 |
 |
Quadrant C |
| Plot type | Count rate plots | Images |
|---|---|---|
| Comparison with Poisson distribution Blue bars denote a histogram of data divided into 1 sec bins. Red curve is a Poisson curve with rate = median count rate of data. |
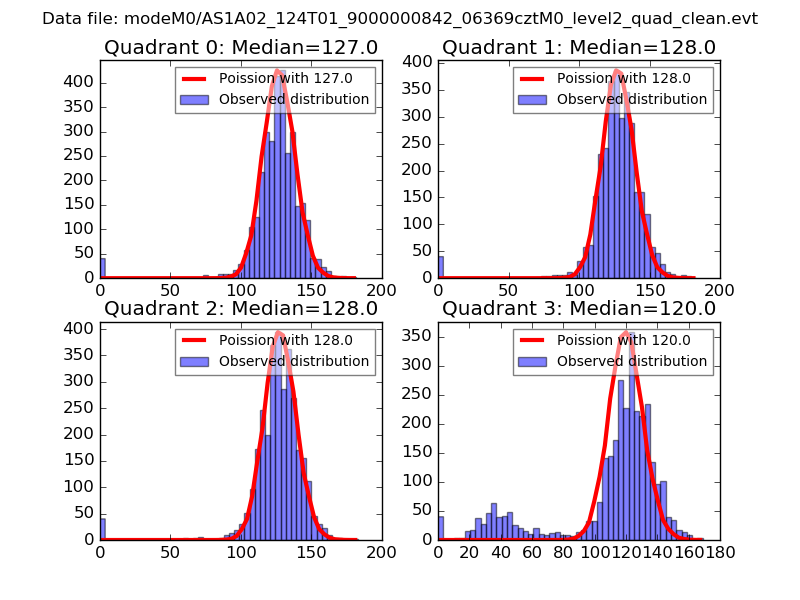 |
 |
| Quadrant-wise count rates Data is divided into 100 sec bins |
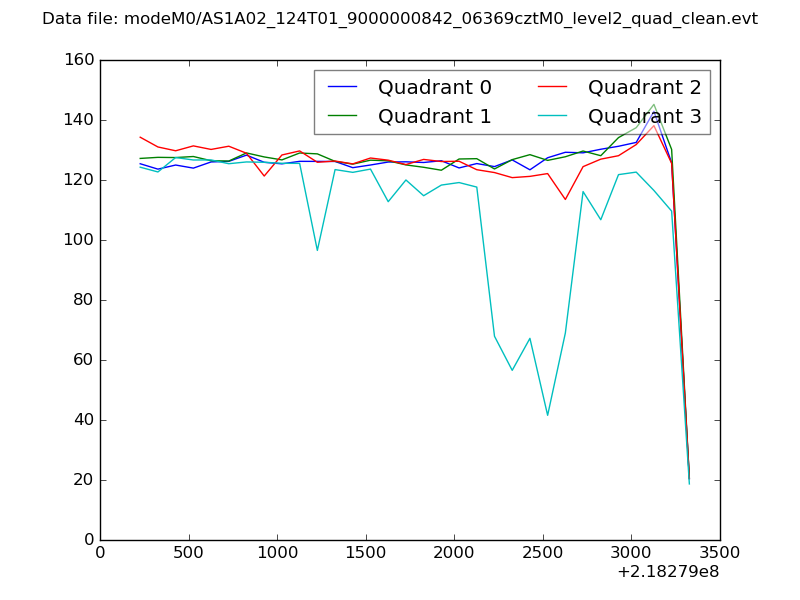 |
|
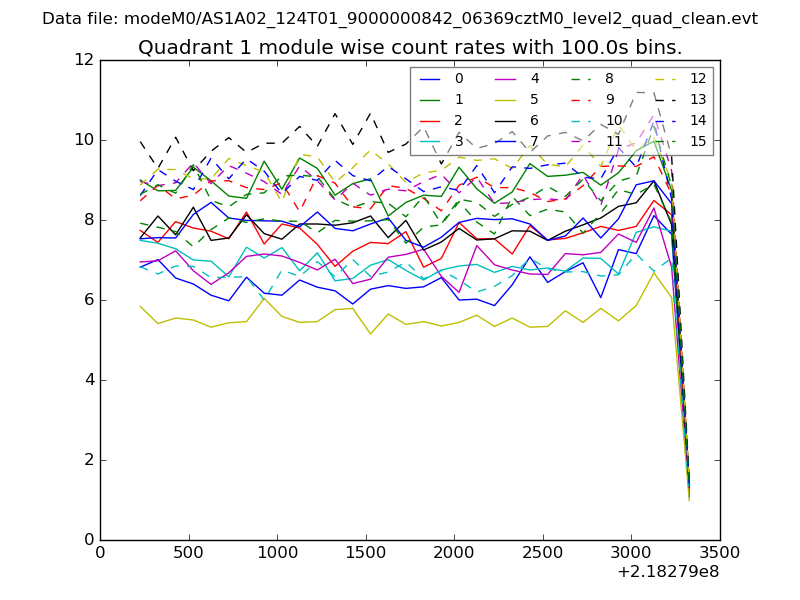
| Module-wise count rates for Quadrant A Data is divided into 100 sec bins |
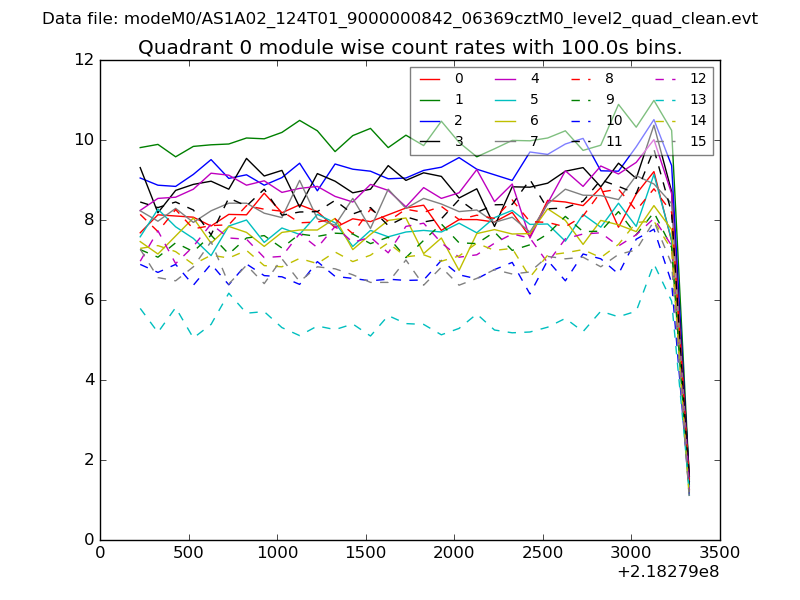 |
 |
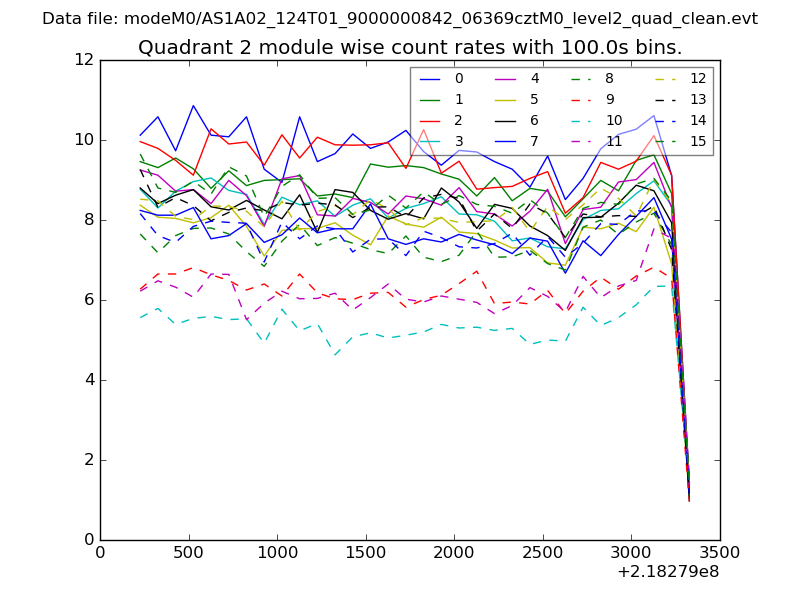
| Module-wise count rates for Quadrant B Data is divided into 100 sec bins |
 |
 |
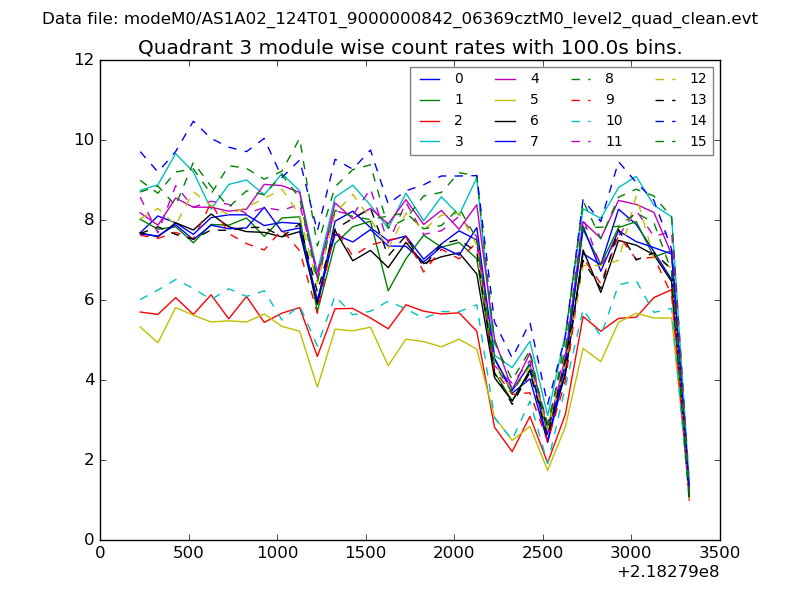
| Module-wise count rates for Quadrant C Data is divided into 100 sec bins |
 |
 |
| Module-wise count rates for Quadrant D Data is divided into 100 sec bins |
 |
 |
| Parameter | Plot |
|---|---|
| CZT HV Monitor | 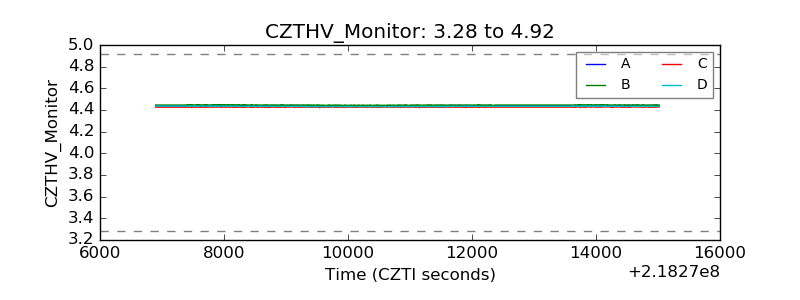 |
| D_VDD | 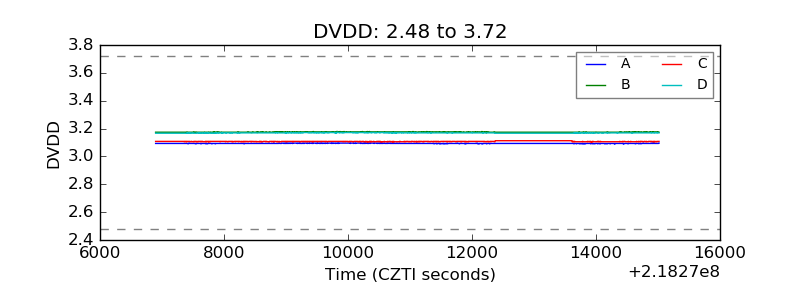 |
| Temperature 1 | 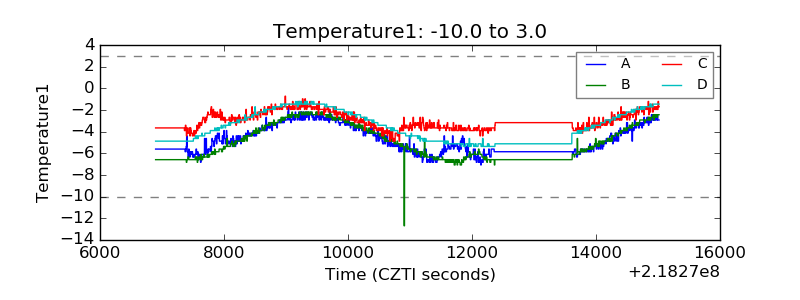 |
| Veto HV Monitor | 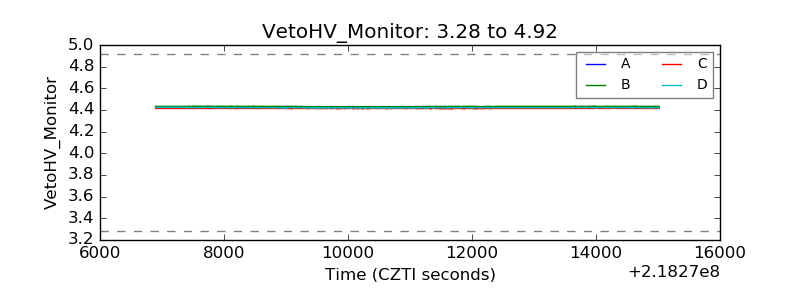 |
| Veto LLD | 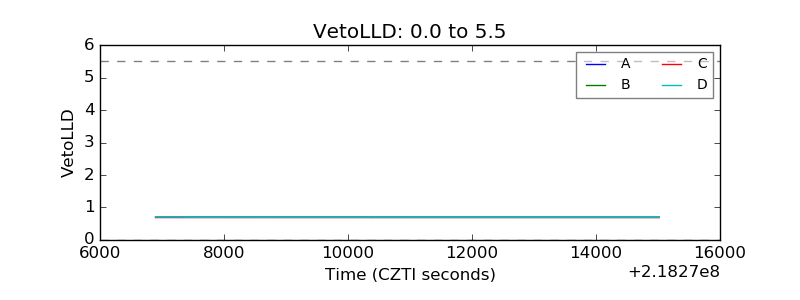 |
| Alpha Counter |  |
| _CPM_Rate | 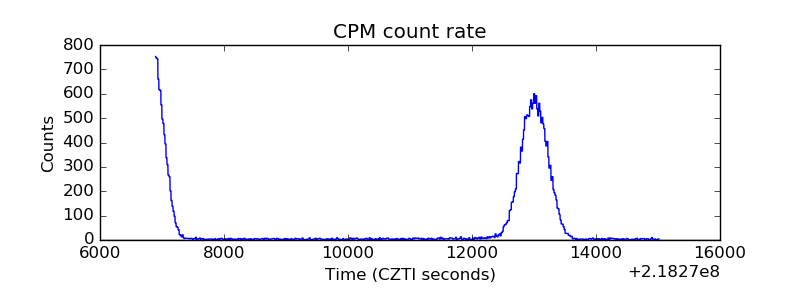 |
| CZT Counter | 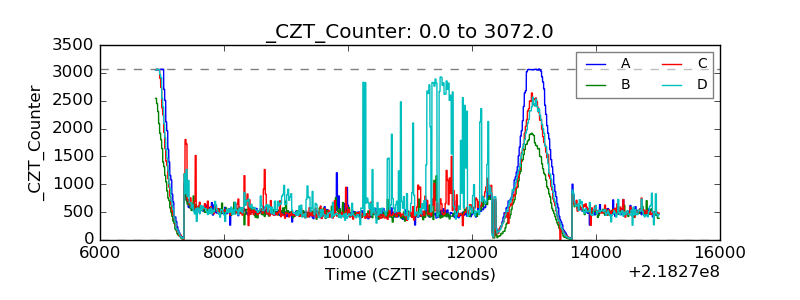 |
| +2.5 Volts monitor |  |
| +5 Volts monitor |  |
| _ROLL_ROT | 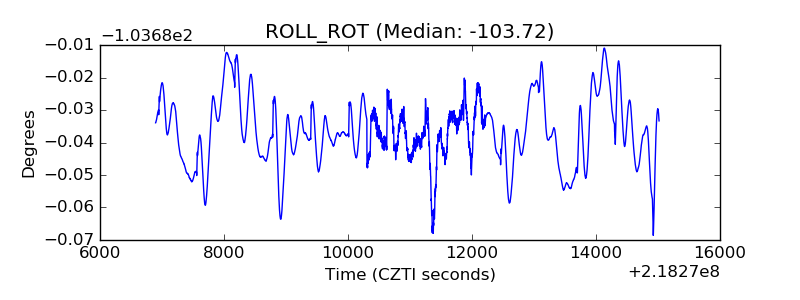 |
| _Roll_DEC | 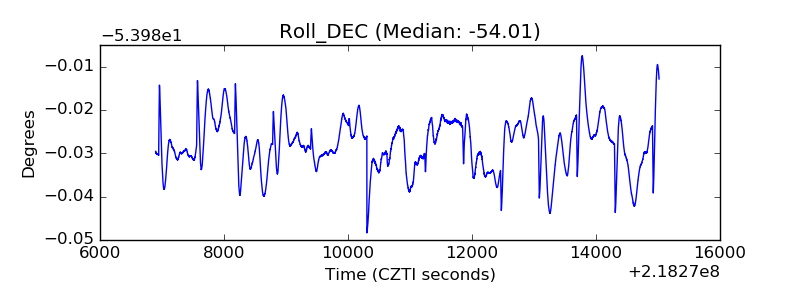 |
| _Roll_RA | 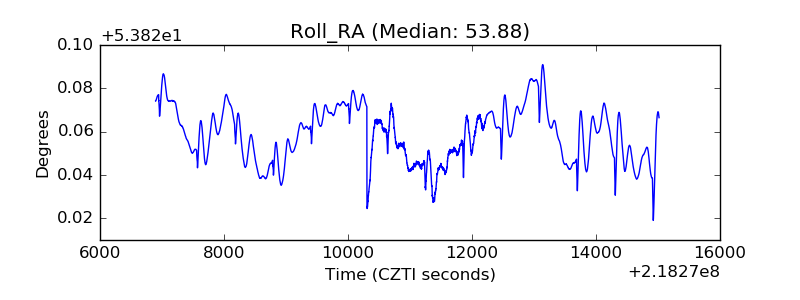 |
| Veto Counter | 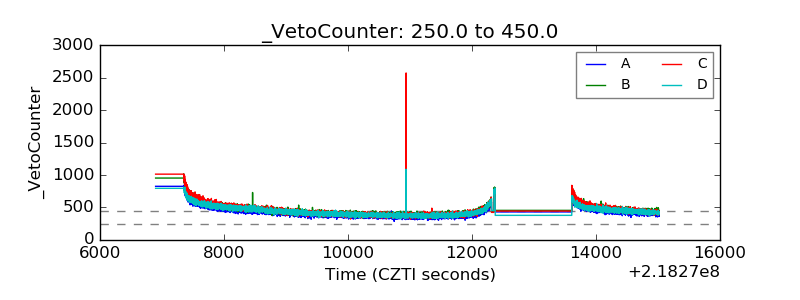 |