| Param | Original file | Final file |
|---|---|---|
| Filename | modeM0/AS1A02_124T01_9000000842_06370cztM0_level2.evt | modeM0/AS1A02_124T01_9000000842_06370cztM0_level2_quad_clean.evt |
| Size (bytes) | 491,673,600 | 88,542,720 |
| Size | 468.9 MB | 84.4 MB |
| Events in quadrant A | 3,552,917 | 551,971 |
| Events in quadrant B | 3,563,955 | 558,492 |
| Events in quadrant C | 3,498,258 | 554,069 |
| Events in quadrant D | 3,800,721 | 530,076 |
| Mode M9 | |||
|---|---|---|---|
| Quadrant | BADHDUFLAG | Total packets | Discarded packets |
| A | 0 | 24 | 0 |
| B | 0 | 24 | 0 |
| C | 0 | 24 | 0 |
| D | 0 | 24 | 0 |
| Mode M0 | |||
|---|---|---|---|
| Quadrant | BADHDUFLAG | Total packets | Discarded packets |
| A | 0 | 14840 | 3 |
| B | 0 | 15090 | 2 |
| C | 0 | 15005 | 2 |
| D | 0 | 15807 | 2 |
| Mode SS | |||
|---|---|---|---|
| Quadrant | BADHDUFLAG | Total packets | Discarded packets |
| A | 0 | 142 | 0 |
| B | 0 | 142 | 0 |
| C | 0 | 142 | 0 |
| D | 0 | 142 | 0 |
| Quadrant | Total seconds | Saturated seconds | Saturation percentage |
|---|---|---|---|
| A | 6990 | 175 | 2.503577% |
| B | 6990 | 205 | 2.932761% |
| C | 6990 | 147 | 2.103004% |
| D | 6990 | 219 | 3.133047% |
Noise dominated data is calculated using 1-second bins in cleaned event files. If a bin has >2000 counts, and if more than 50% of those come from <1% of pixels, then it is considered to be noise-dominated and hence unusable.
| Quadrant | # 1 sec bins | Bins with >0 counts | Bins with >2000 counts | High rate bins dominated by noise | Noise dominated (total time) | Noise dominated (detector-on time) | Marked lightcurve |
|---|---|---|---|---|---|---|---|
| A | 9310 | 6993 | 0 | 0 | 0.00% | 0.00% | 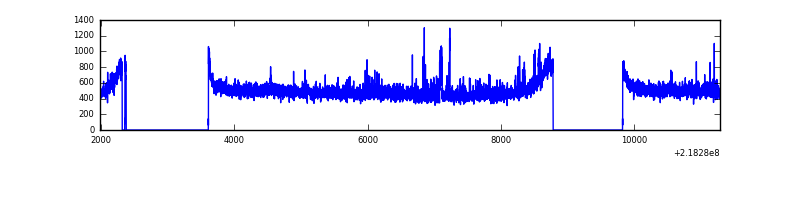 |
| B | 9310 | 6993 | 23 | 23 | 0.25% | 0.33% | 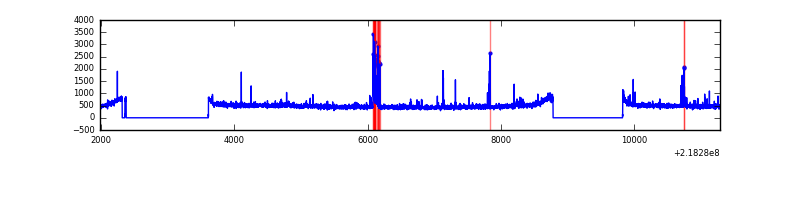 |
| C | 9310 | 6993 | 10 | 10 | 0.11% | 0.14% | 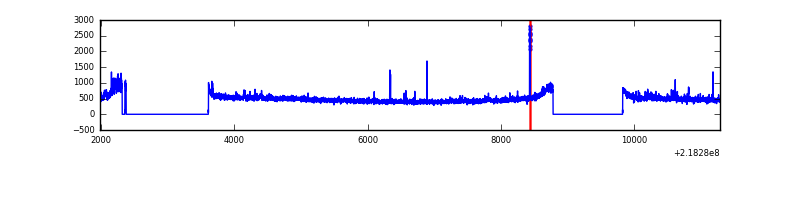 |
| D | 9310 | 6993 | 56 | 56 | 0.60% | 0.80% | 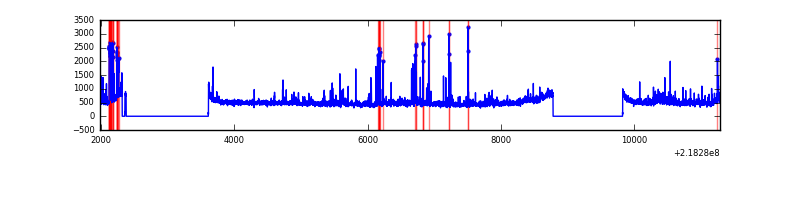 |
Top three noisy pixels from each quadrant. If the there are fewer than three noisy pixels in the level2.evt file, extra rows are filled as -1
| Pixel properties | Quadrant properties | ||||||
|---|---|---|---|---|---|---|---|
| Quadrant | DetID | PixID | Counts | Sigma | Mean | Median | Sigma |
| A | 15 | 236 | 181786 | 1053.28 | 855 | 836 | 171.8 |
| A | 8 | 15 | 54100 | 310.04 | 855 | 836 | 171.8 |
| A | 15 | 174 | 9535 | 50.64 | 855 | 836 | 171.8 |
| B | 0 | 219 | 147229 | 893.21 | 859 | 838 | 163.9 |
| B | 0 | 228 | 48403 | 290.22 | 859 | 838 | 163.9 |
| B | 10 | 246 | 27972 | 165.56 | 859 | 838 | 163.9 |
| C | 4 | 254 | 185070 | 950.71 | 838 | 841 | 193.8 |
| C | 1 | 241 | 45397 | 229.93 | 838 | 841 | 193.8 |
| C | 13 | 61 | 6550 | 29.46 | 838 | 841 | 193.8 |
| D | 2 | 63 | 322050 | 1592.8 | 834 | 809 | 201.7 |
| D | 2 | 152 | 148263 | 731.12 | 834 | 809 | 201.7 |
| D | 11 | 241 | 77833 | 381.91 | 834 | 809 | 201.7 |
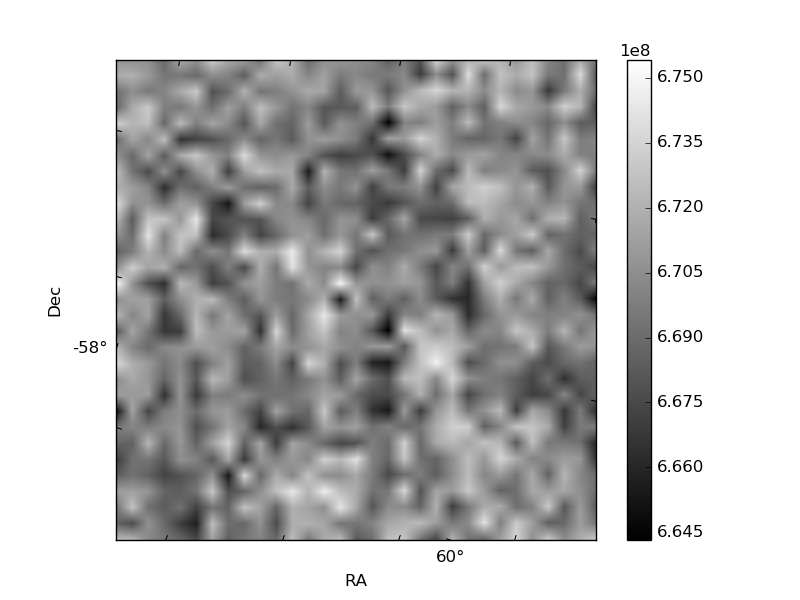
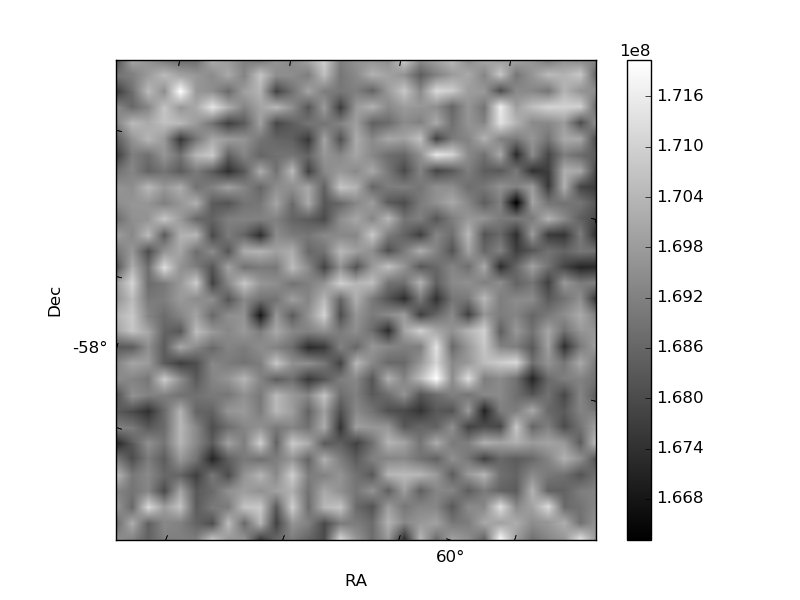
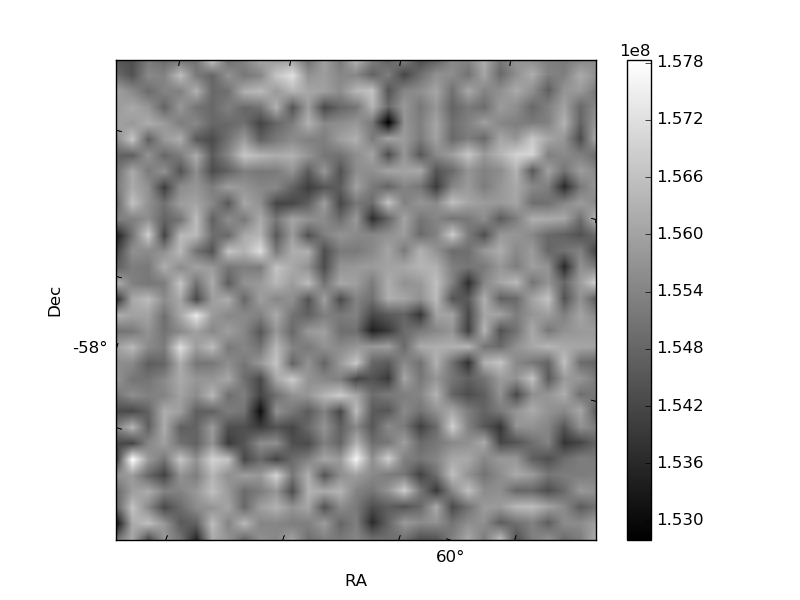
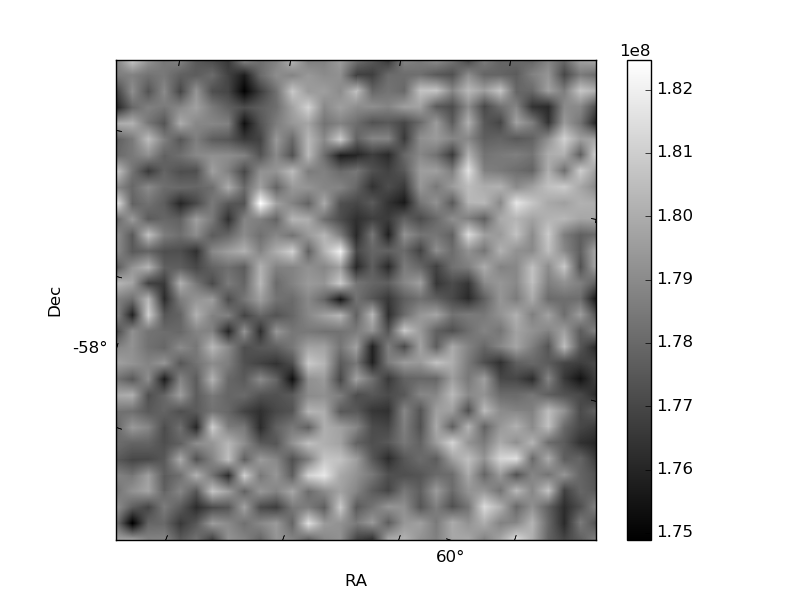
Histogram calculated using DETX and DETY for each event in the final _common_clean file
| Quadrant A | 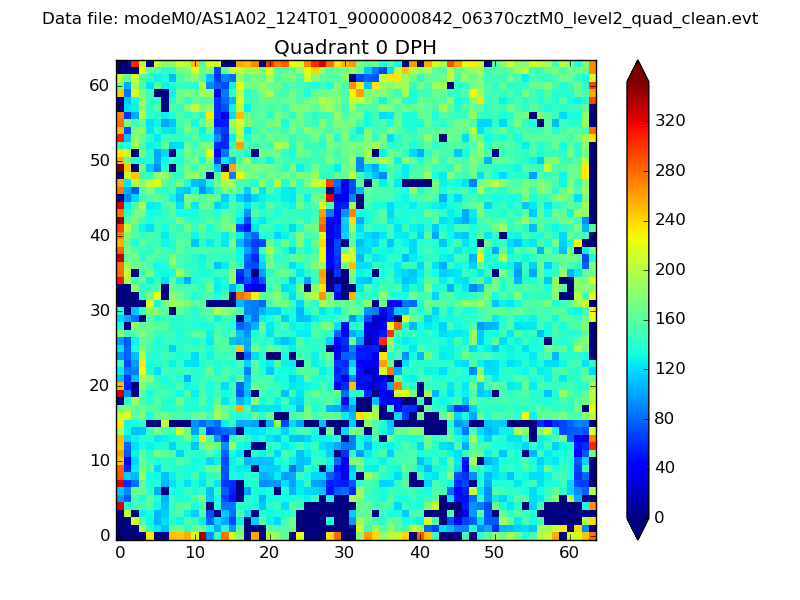 |
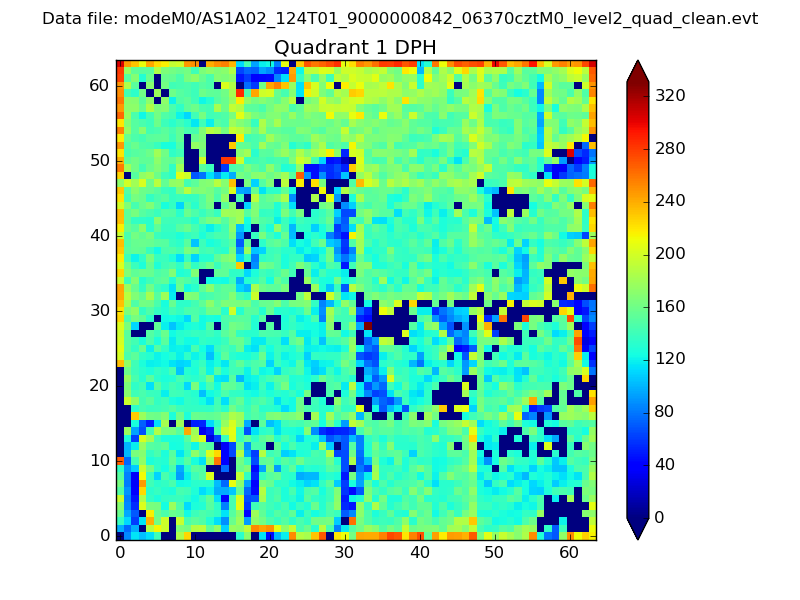 |
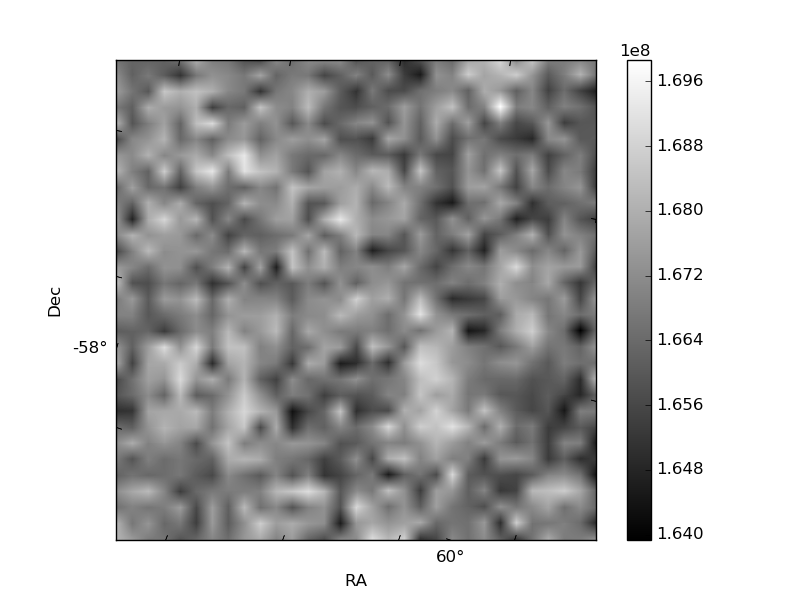
Quadrant B |
|---|---|---|---|
| Quadrant D | 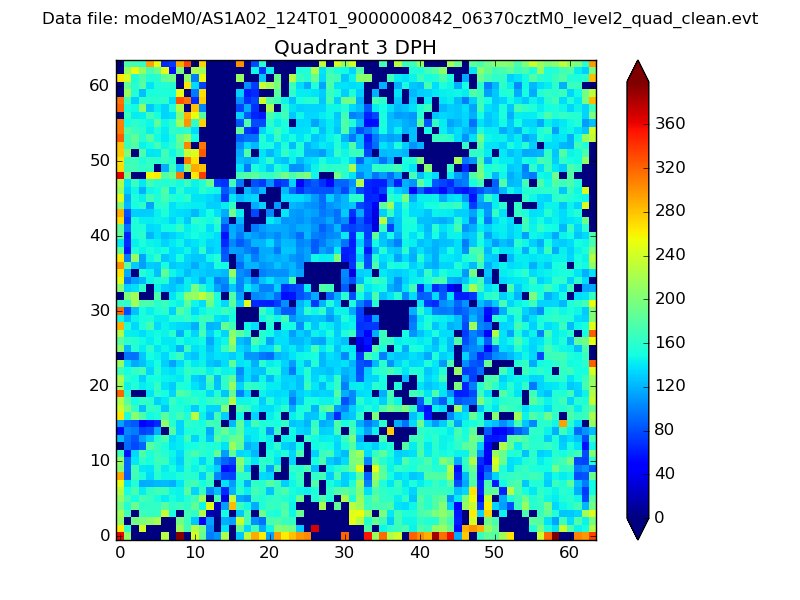 |
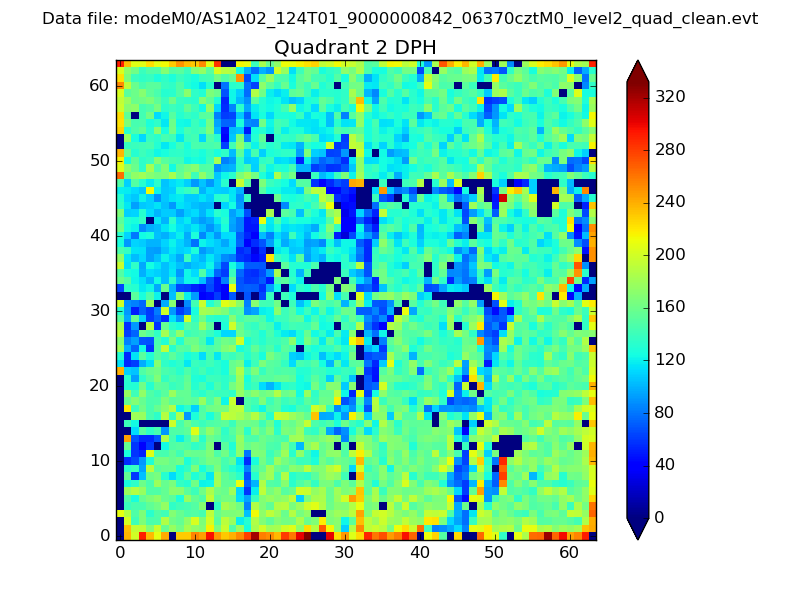 |
Quadrant C |
| Plot type | Count rate plots | Images |
|---|---|---|
| Comparison with Poisson distribution Blue bars denote a histogram of data divided into 1 sec bins. Red curve is a Poisson curve with rate = median count rate of data. |
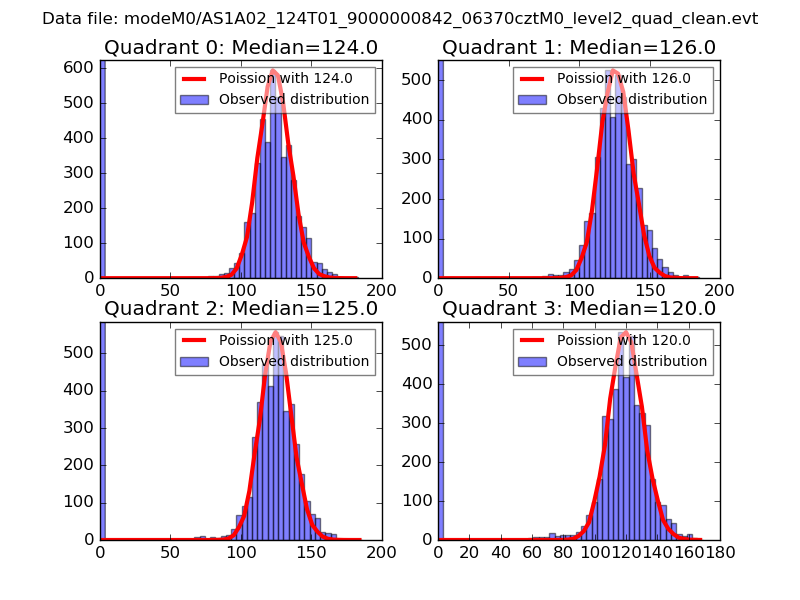 |
 |
| Quadrant-wise count rates Data is divided into 100 sec bins |
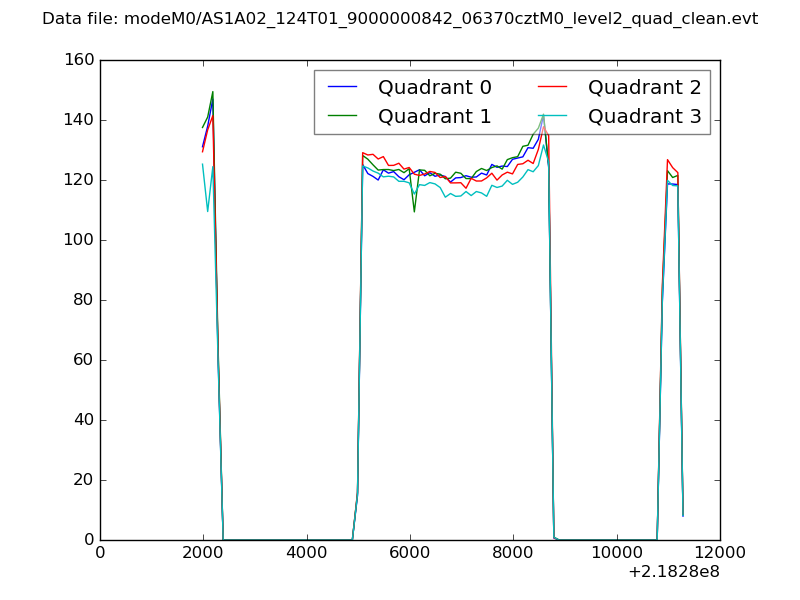 |
|
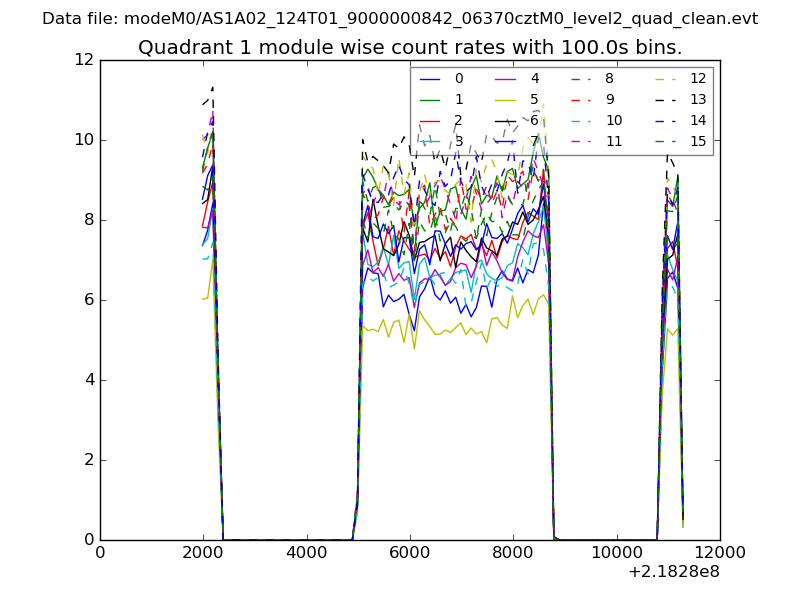
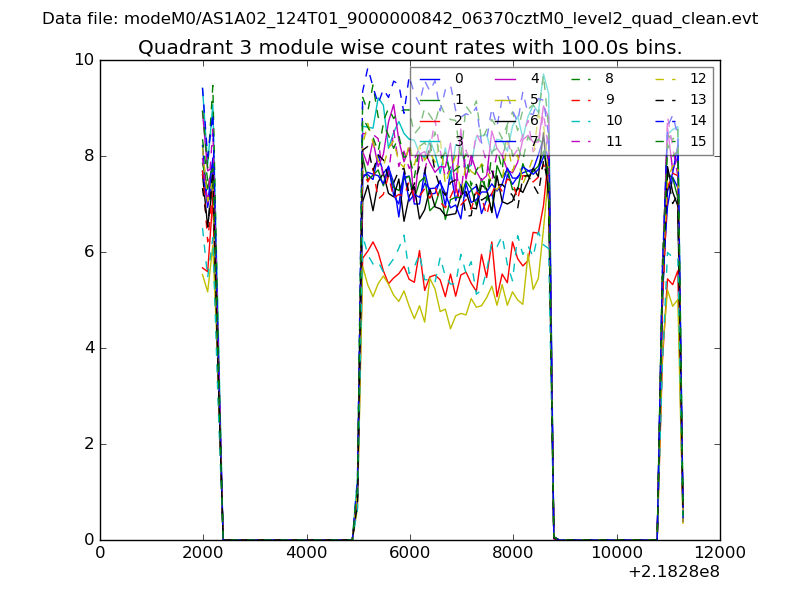
| Module-wise count rates for Quadrant A Data is divided into 100 sec bins |
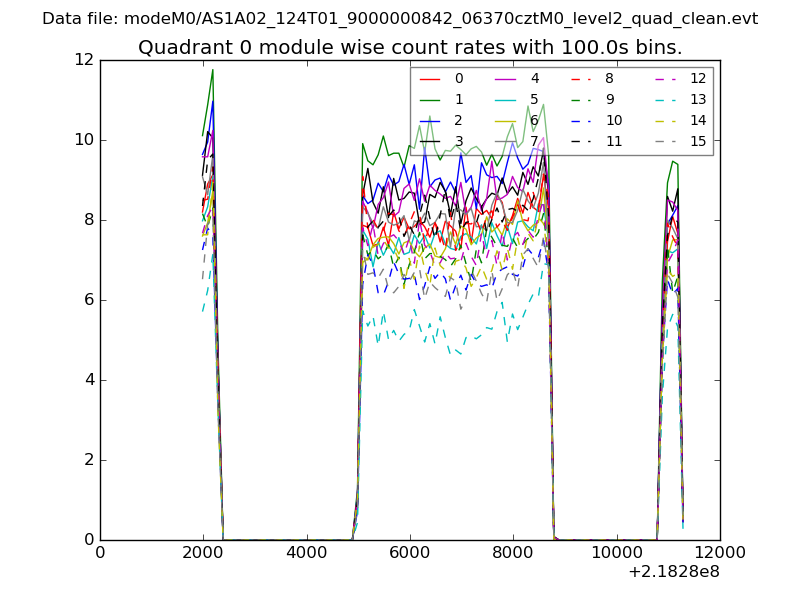 |
 |
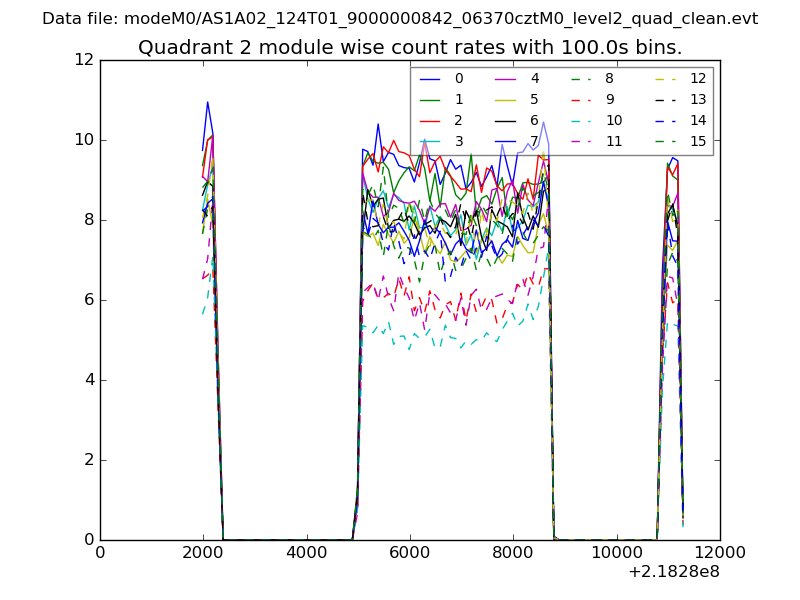
| Module-wise count rates for Quadrant B Data is divided into 100 sec bins |
 |
 |
| Module-wise count rates for Quadrant C Data is divided into 100 sec bins |
 |
 |
| Module-wise count rates for Quadrant D Data is divided into 100 sec bins |
 |
 |
| Parameter | Plot |
|---|---|
| CZT HV Monitor | 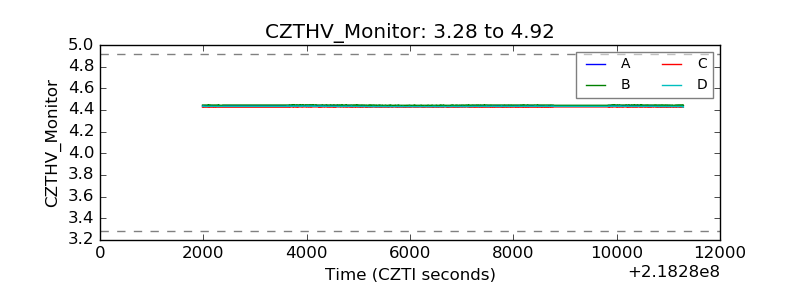 |
| D_VDD | 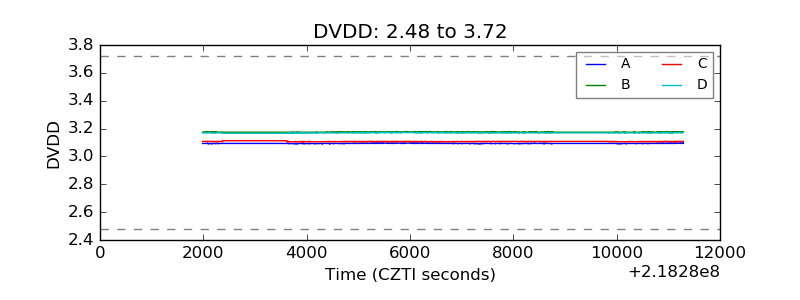 |
| Temperature 1 | 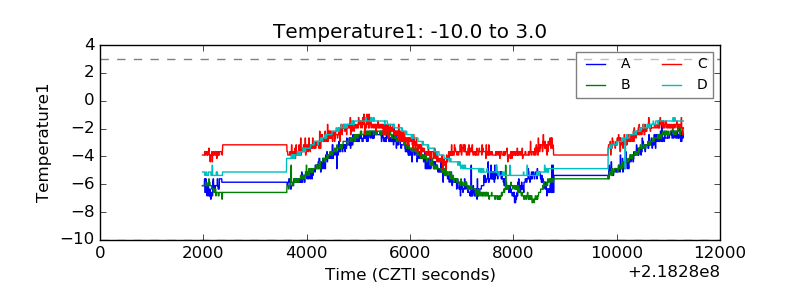 |
| Veto HV Monitor | 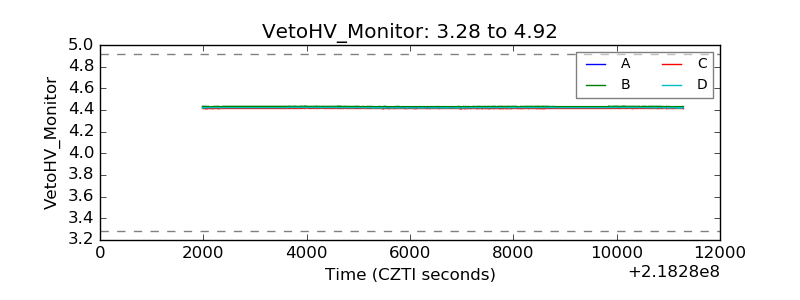 |
| Veto LLD | 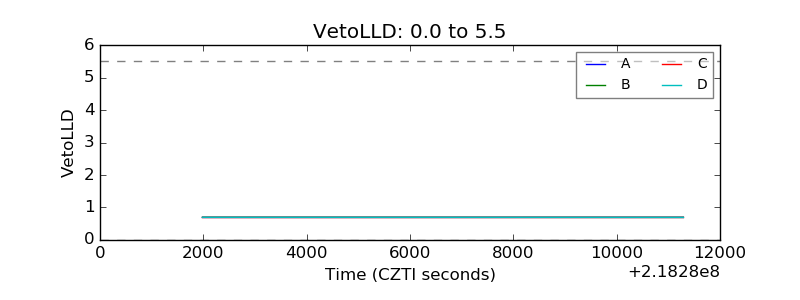 |
| Alpha Counter | 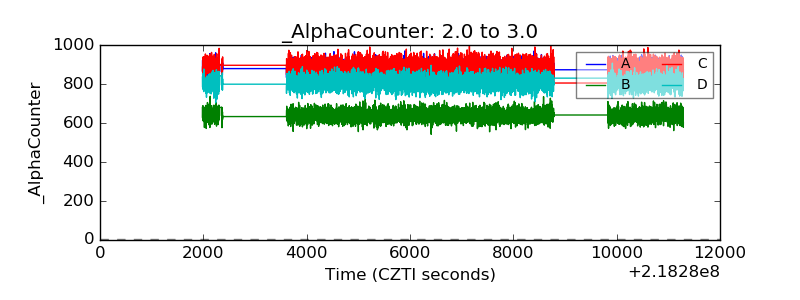 |
| _CPM_Rate |  |
| CZT Counter | 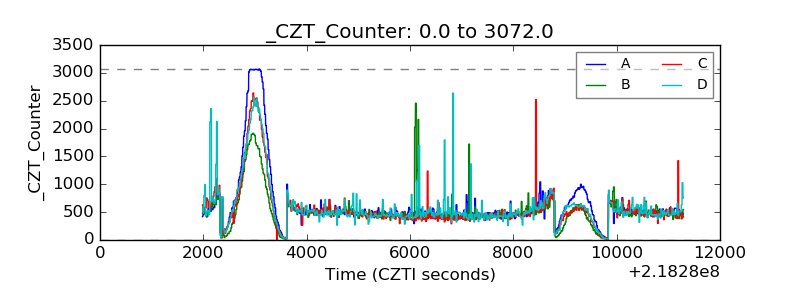 |
| +2.5 Volts monitor |  |
| +5 Volts monitor | 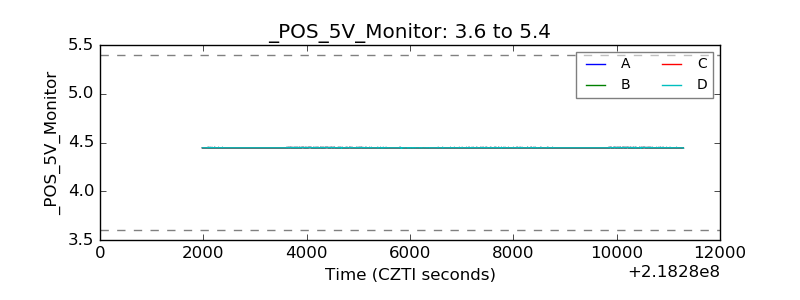 |
| _ROLL_ROT | 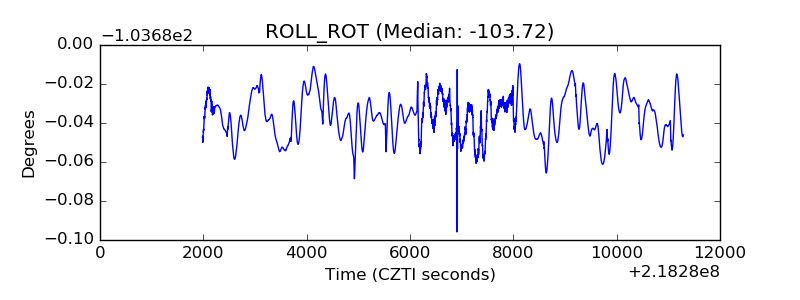 |
| _Roll_DEC | 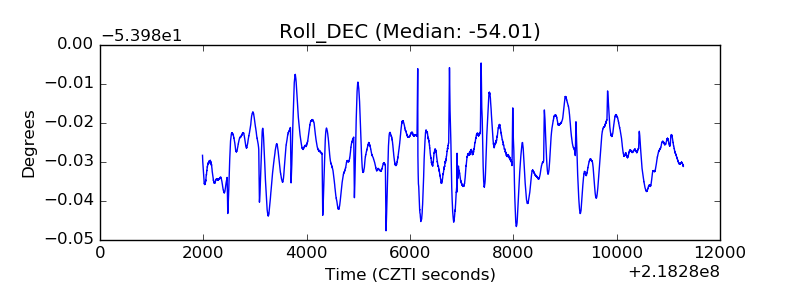 |
| _Roll_RA | 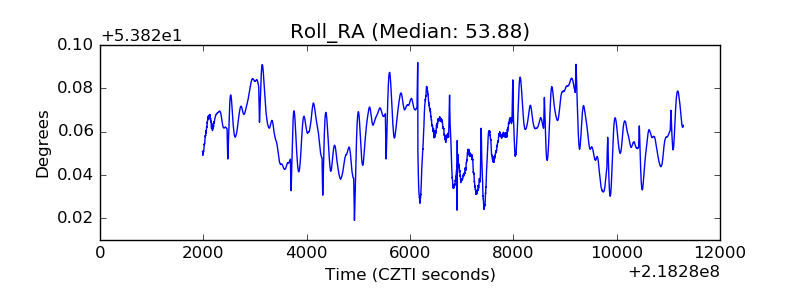 |
| Veto Counter | 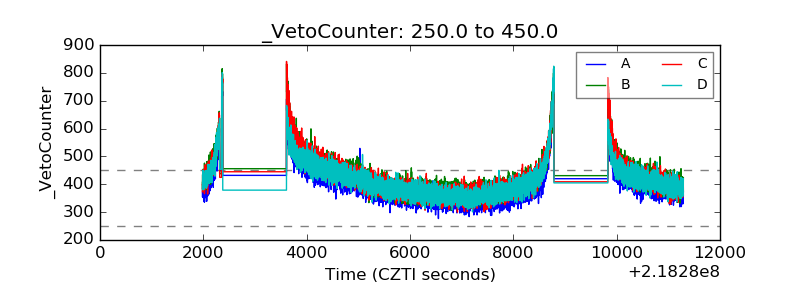 |