| Param | Original file | Final file |
|---|---|---|
| Filename | modeM0/AS1A02_124T01_9000000842_06374cztM0_level2.evt | modeM0/AS1A02_124T01_9000000842_06374cztM0_level2_quad_clean.evt |
| Size (bytes) | 398,839,680 | 82,771,200 |
| Size | 380.4 MB | 78.9 MB |
| Events in quadrant A | 2,789,385 | 523,092 |
| Events in quadrant B | 2,998,951 | 526,292 |
| Events in quadrant C | 2,795,234 | 515,437 |
| Events in quadrant D | 3,065,358 | 500,772 |
| Mode M9 | |||
|---|---|---|---|
| Quadrant | BADHDUFLAG | Total packets | Discarded packets |
| A | 0 | 2 | 0 |
| B | 0 | 2 | 0 |
| C | 0 | 2 | 0 |
| D | 0 | 2 | 0 |
| Mode M0 | |||
|---|---|---|---|
| Quadrant | BADHDUFLAG | Total packets | Discarded packets |
| A | 0 | 12923 | 2 |
| B | 0 | 13341 | 1 |
| C | 0 | 12942 | 1 |
| D | 0 | 13760 | 1 |
| Mode SS | |||
|---|---|---|---|
| Quadrant | BADHDUFLAG | Total packets | Discarded packets |
| A | 0 | 130 | 0 |
| B | 0 | 130 | 0 |
| C | 0 | 130 | 0 |
| D | 0 | 130 | 0 |
| Quadrant | Total seconds | Saturated seconds | Saturation percentage |
|---|---|---|---|
| A | 6318 | 39 | 0.617284% |
| B | 6318 | 62 | 0.981323% |
| C | 6318 | 16 | 0.253245% |
| D | 6318 | 50 | 0.791390% |
Noise dominated data is calculated using 1-second bins in cleaned event files. If a bin has >2000 counts, and if more than 50% of those come from <1% of pixels, then it is considered to be noise-dominated and hence unusable.
| Quadrant | # 1 sec bins | Bins with >0 counts | Bins with >2000 counts | High rate bins dominated by noise | Noise dominated (total time) | Noise dominated (detector-on time) | Marked lightcurve |
|---|---|---|---|---|---|---|---|
| A | 6548 | 6320 | 0 | 0 | 0.00% | 0.00% | 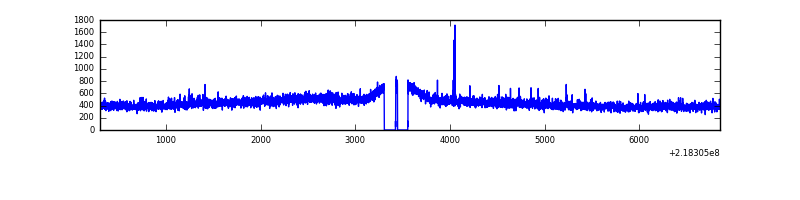 |
| B | 6548 | 6320 | 7 | 7 | 0.11% | 0.11% | 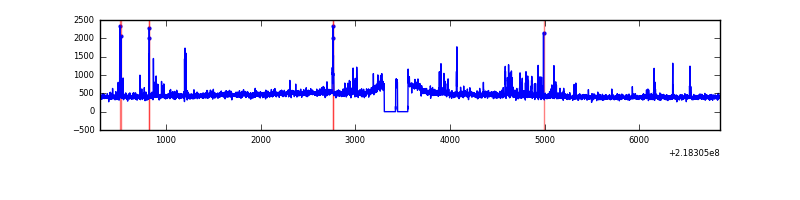 |
| C | 6548 | 6320 | 0 | 0 | 0.00% | 0.00% | 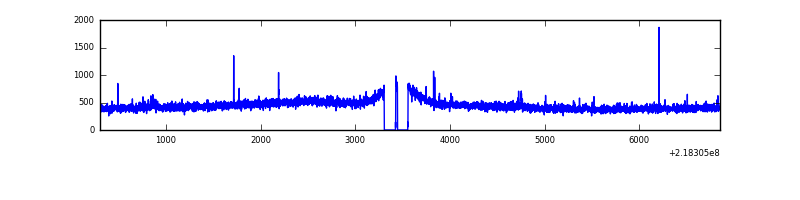 |
| D | 6548 | 6320 | 37 | 37 | 0.57% | 0.59% | 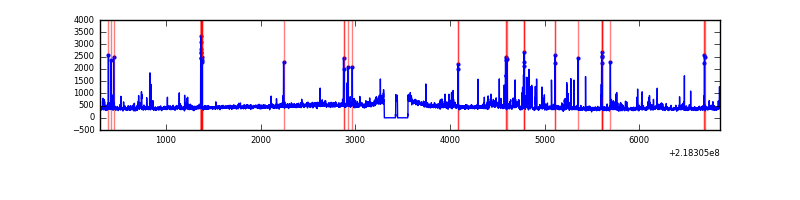 |
Top three noisy pixels from each quadrant. If the there are fewer than three noisy pixels in the level2.evt file, extra rows are filled as -1
| Pixel properties | Quadrant properties | ||||||
|---|---|---|---|---|---|---|---|
| Quadrant | DetID | PixID | Counts | Sigma | Mean | Median | Sigma |
| A | 8 | 15 | 14211 | 92.36 | 714 | 698 | 146.3 |
| A | 15 | 174 | 9920 | 63.03 | 714 | 698 | 146.3 |
| A | 3 | 1 | 7623 | 47.33 | 714 | 698 | 146.3 |
| B | 0 | 219 | 83590 | 596.14 | 722 | 703 | 139.0 |
| B | 4 | 81 | 53347 | 378.62 | 722 | 703 | 139.0 |
| B | 0 | 229 | 37795 | 266.77 | 722 | 703 | 139.0 |
| C | 4 | 254 | 44877 | 269.65 | 699 | 702 | 163.8 |
| C | 8 | 128 | 9114 | 51.35 | 699 | 702 | 163.8 |
| C | 13 | 61 | 5614 | 29.98 | 699 | 702 | 163.8 |
| D | 2 | 152 | 250488 | 1478.94 | 693 | 672 | 168.9 |
| D | 11 | 241 | 59842 | 350.29 | 693 | 672 | 168.9 |
| D | 2 | 14 | 58670 | 343.35 | 693 | 672 | 168.9 |
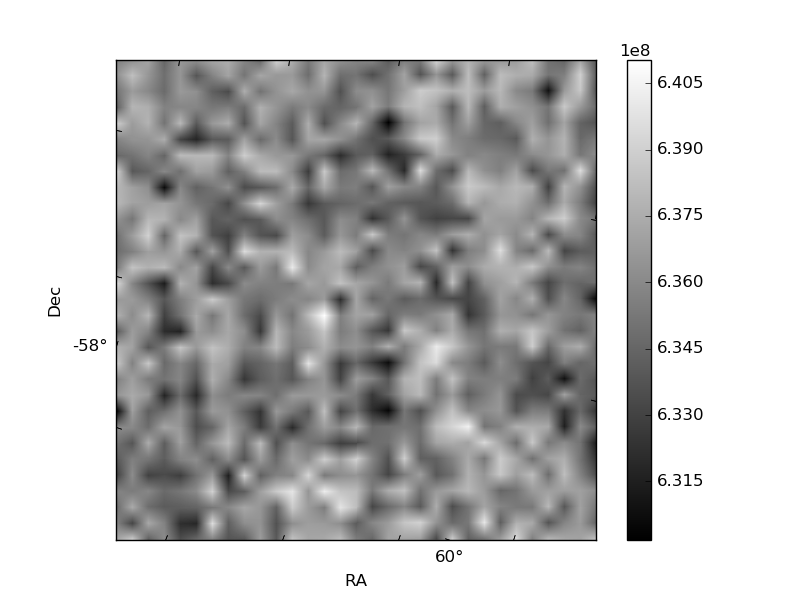
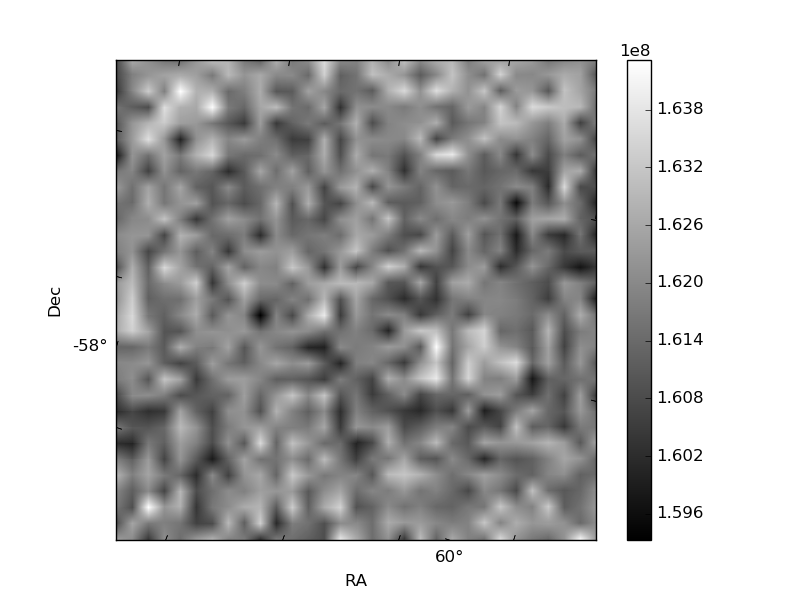
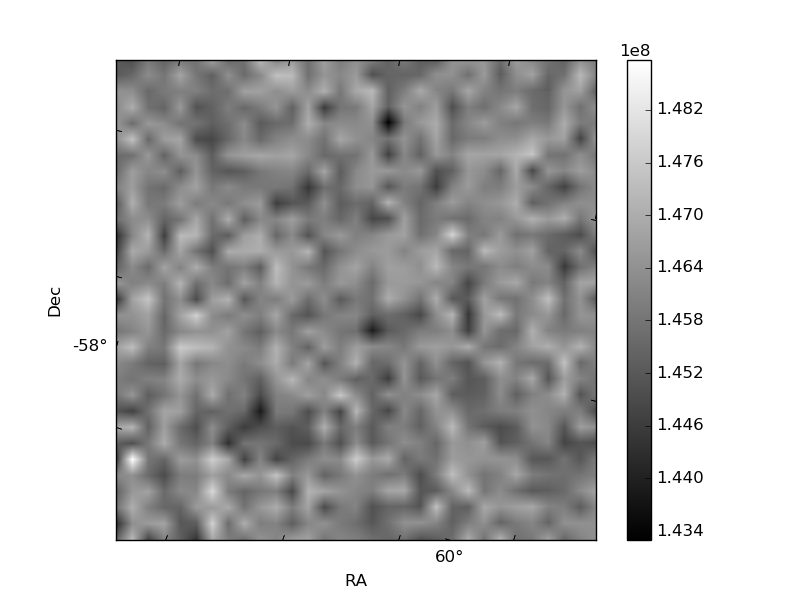
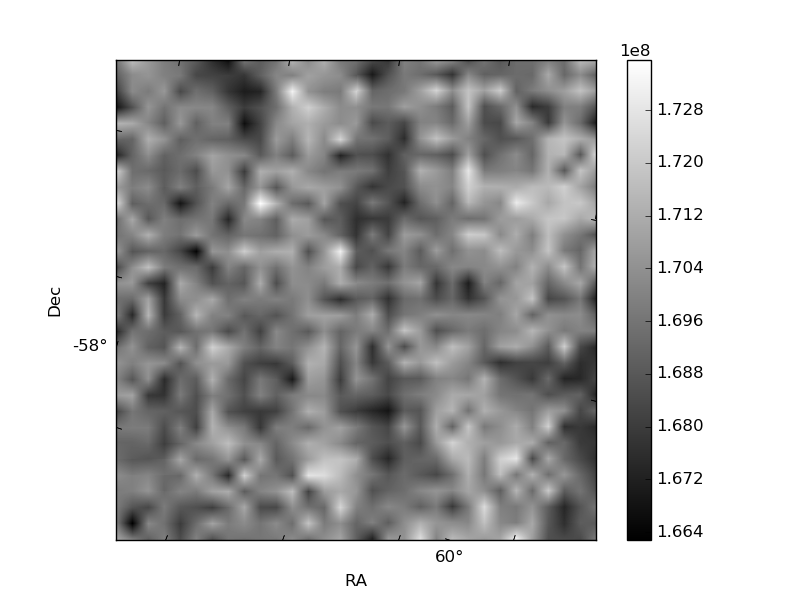
Histogram calculated using DETX and DETY for each event in the final _common_clean file
| Quadrant A | 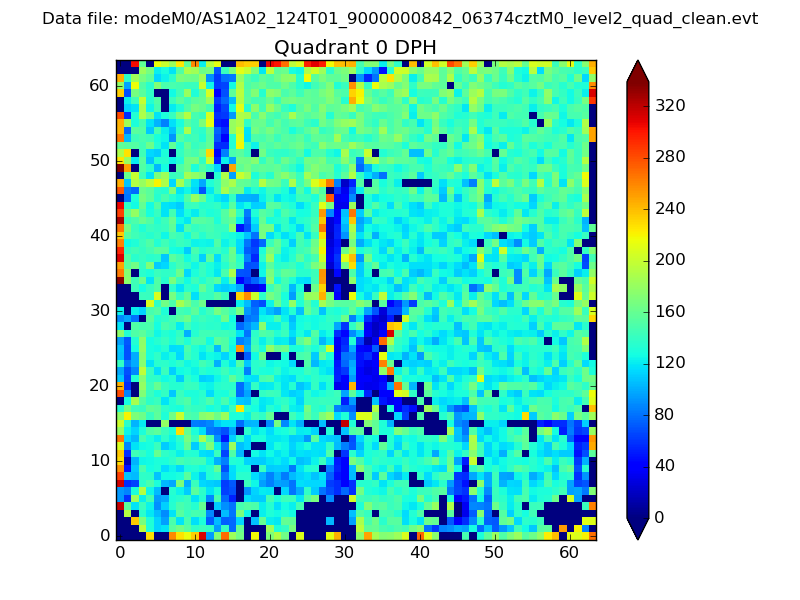 |
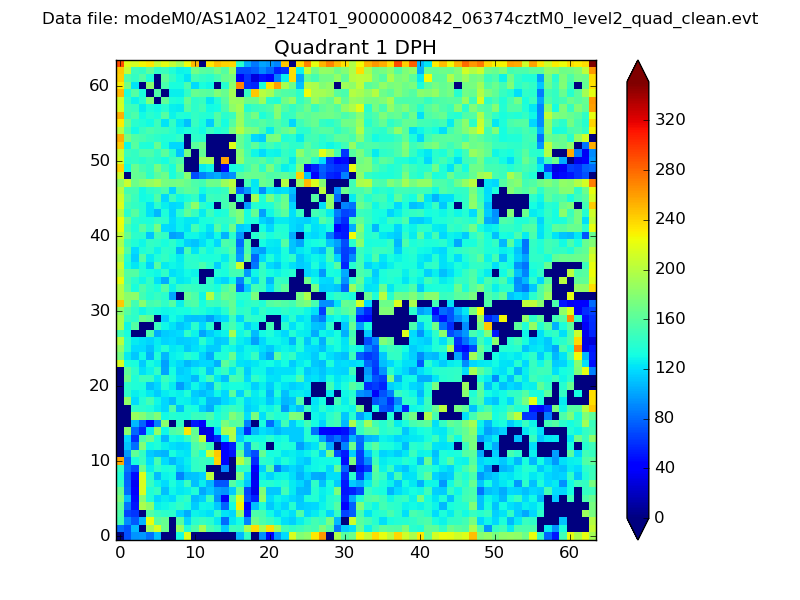 |
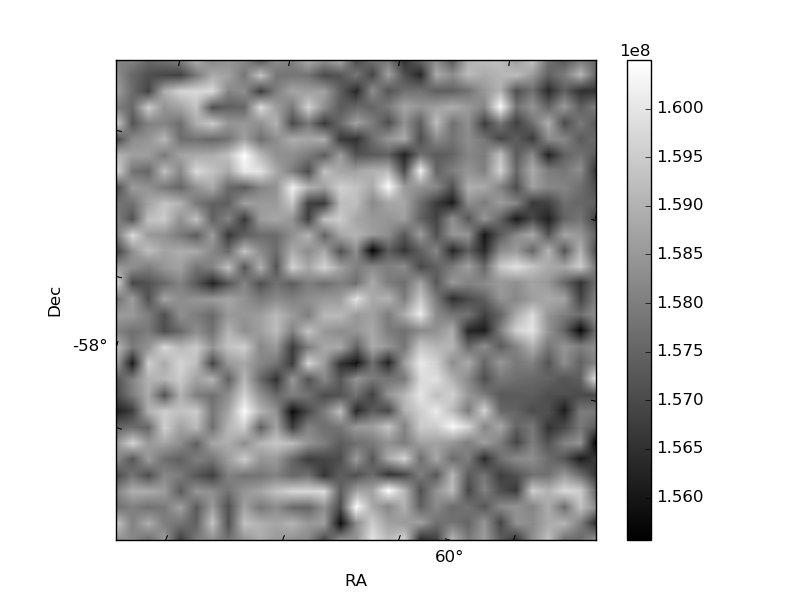
Quadrant B |
|---|---|---|---|
| Quadrant D | 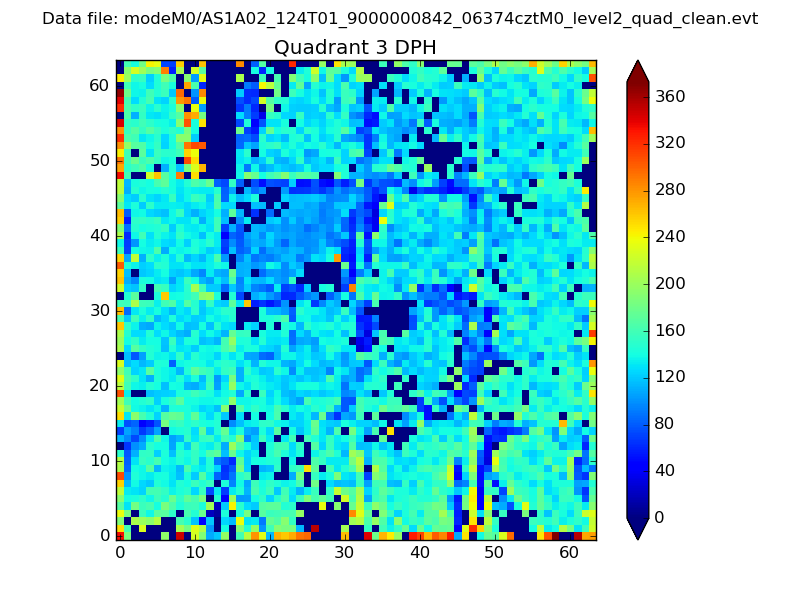 |
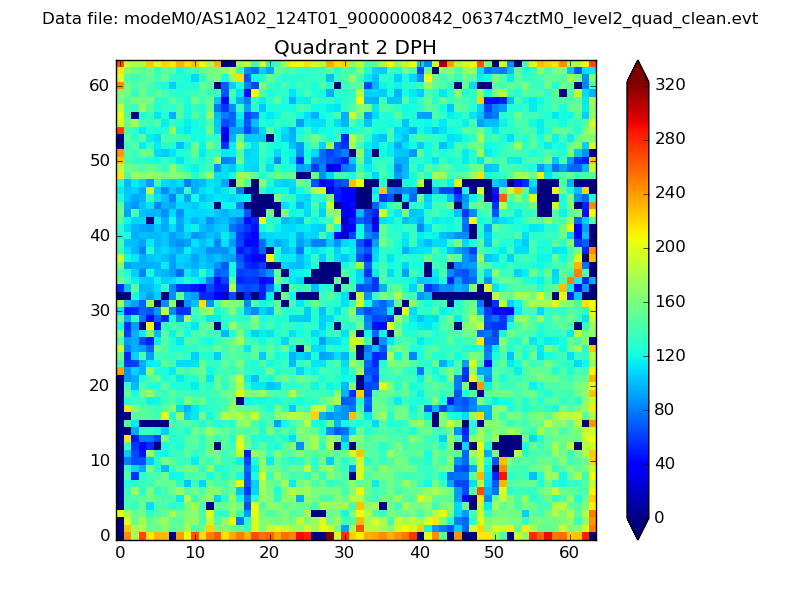 |
Quadrant C |
| Plot type | Count rate plots | Images |
|---|---|---|
| Comparison with Poisson distribution Blue bars denote a histogram of data divided into 1 sec bins. Red curve is a Poisson curve with rate = median count rate of data. |
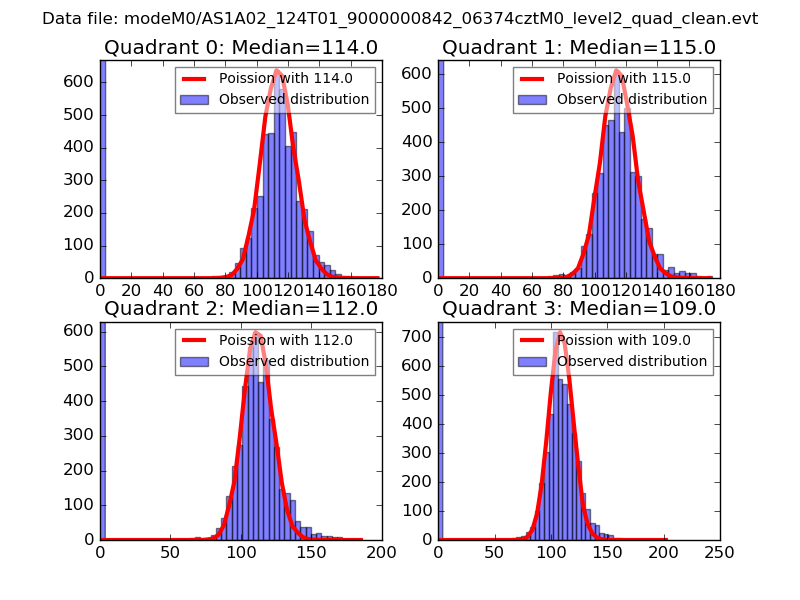 |
 |
| Quadrant-wise count rates Data is divided into 100 sec bins |
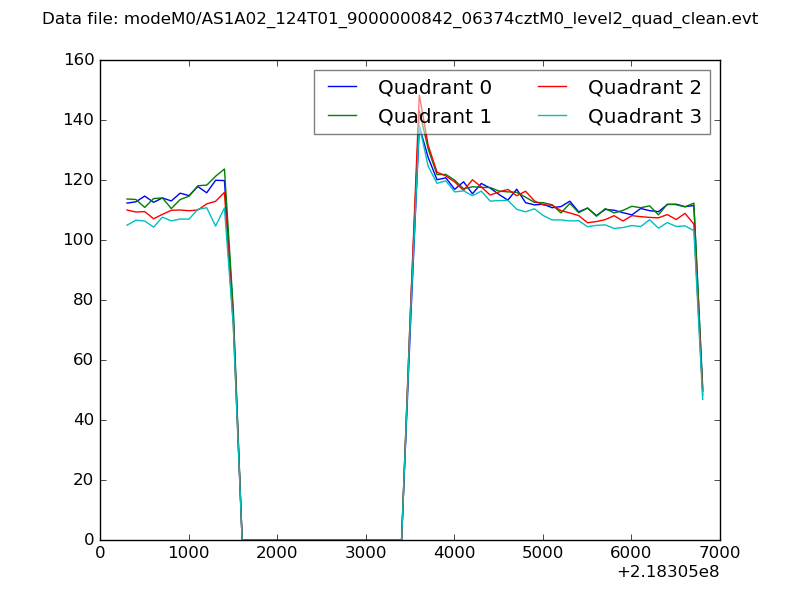 |
|
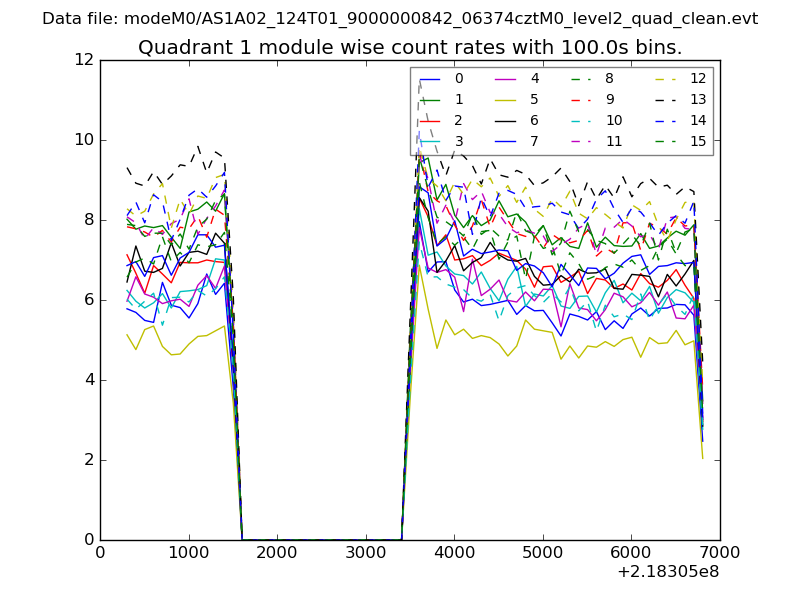
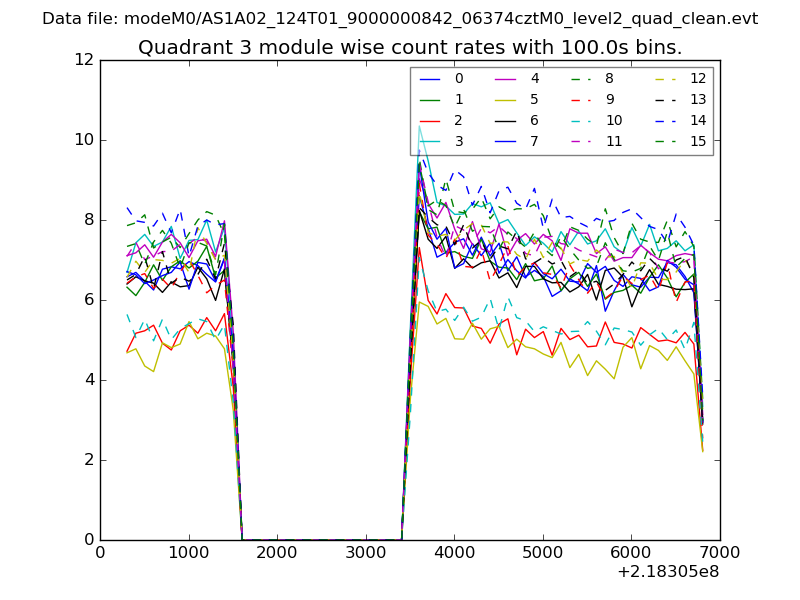
| Module-wise count rates for Quadrant A Data is divided into 100 sec bins |
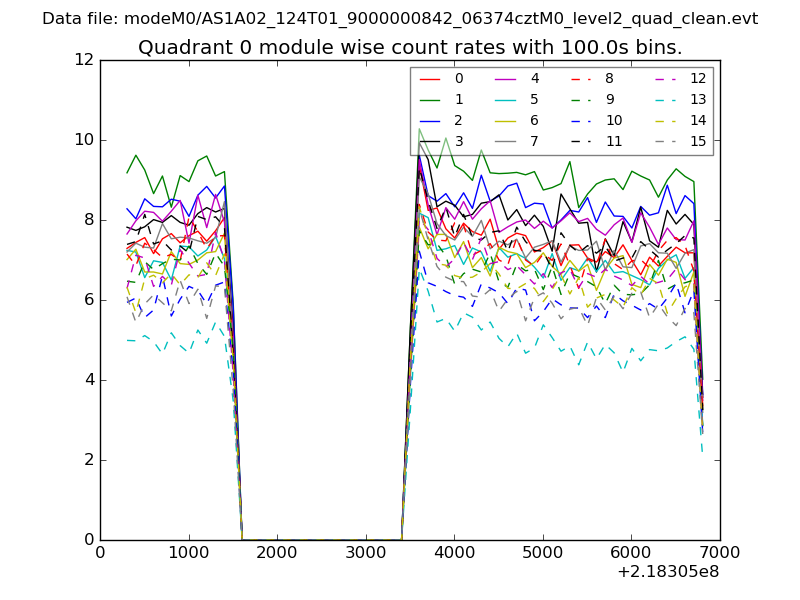 |
 |
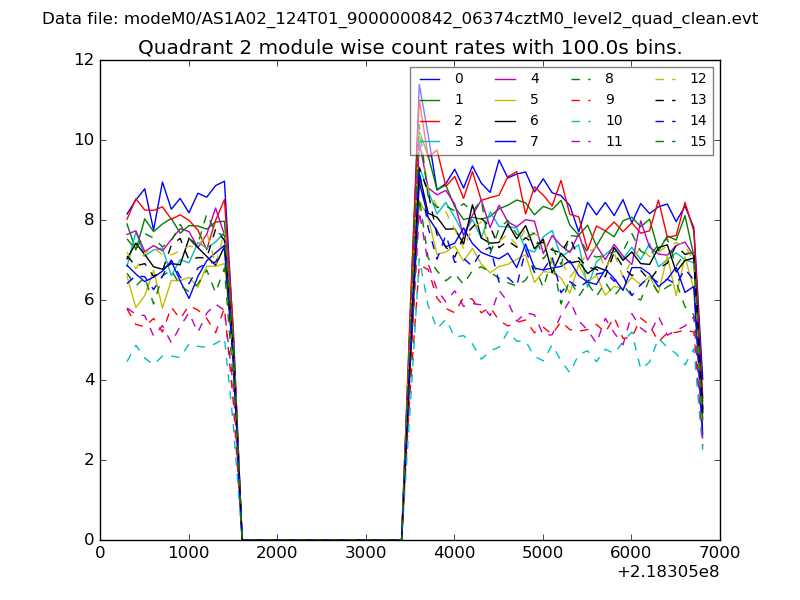
| Module-wise count rates for Quadrant B Data is divided into 100 sec bins |
 |
 |
| Module-wise count rates for Quadrant C Data is divided into 100 sec bins |
 |
 |
| Module-wise count rates for Quadrant D Data is divided into 100 sec bins |
 |
 |
| Parameter | Plot |
|---|---|
| CZT HV Monitor | 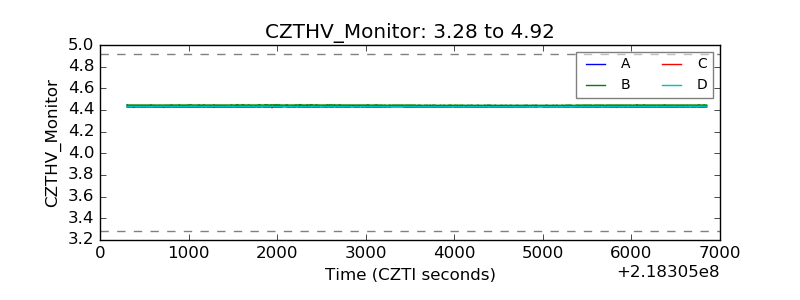 |
| D_VDD | 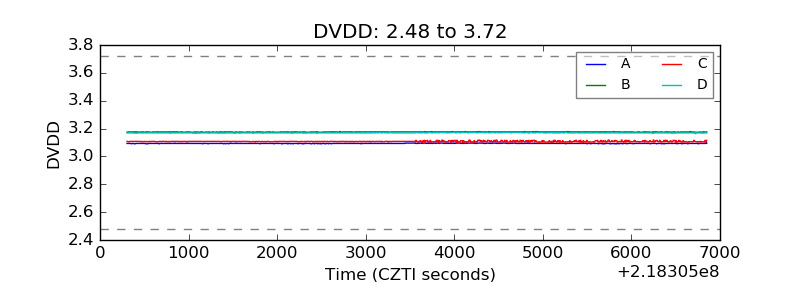 |
| Temperature 1 | 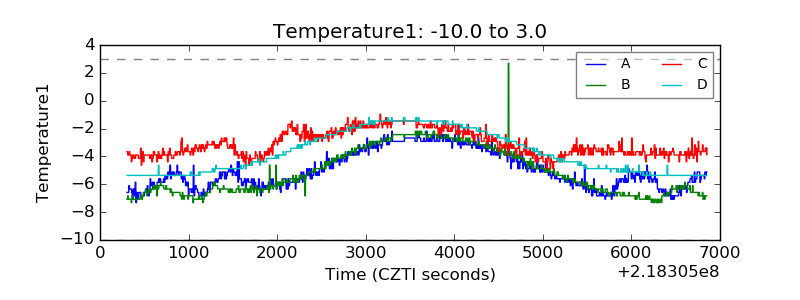 |
| Veto HV Monitor | 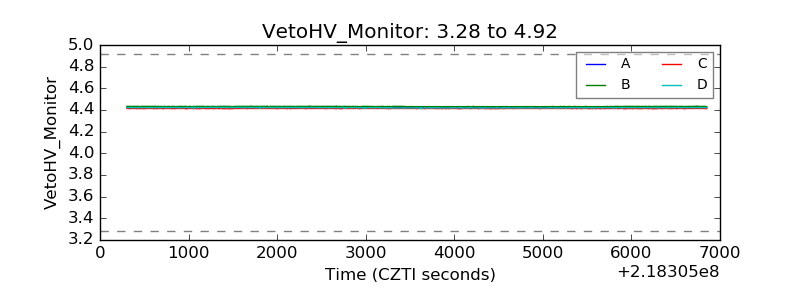 |
| Veto LLD | 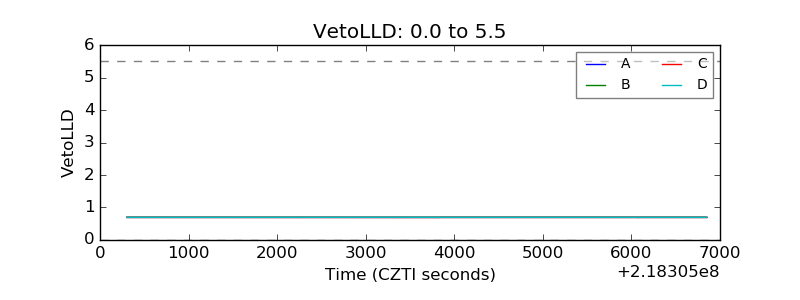 |
| Alpha Counter | 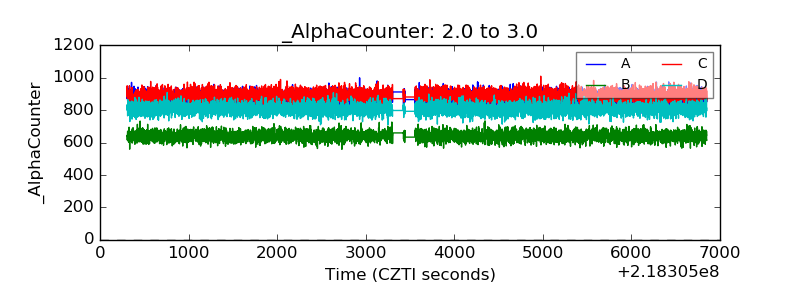 |
| _CPM_Rate | 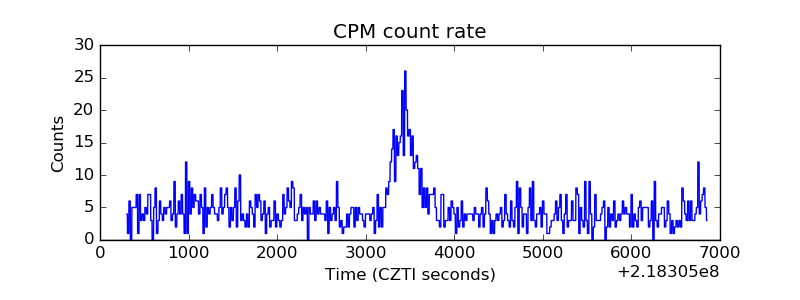 |
| CZT Counter | 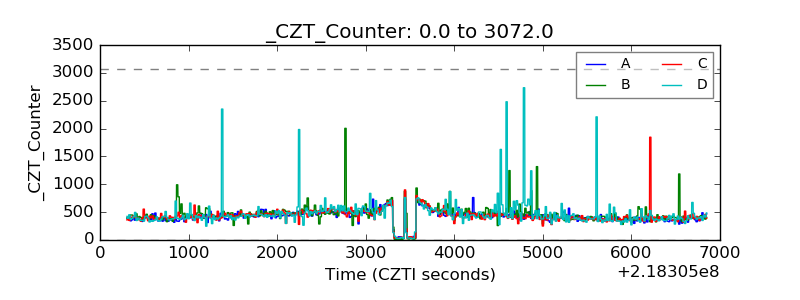 |
| +2.5 Volts monitor |  |
| +5 Volts monitor | 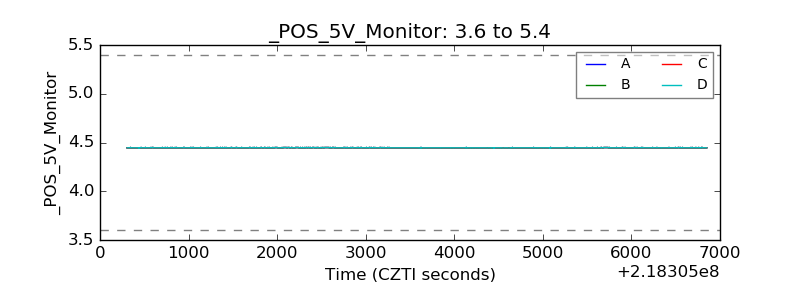 |
| _ROLL_ROT | 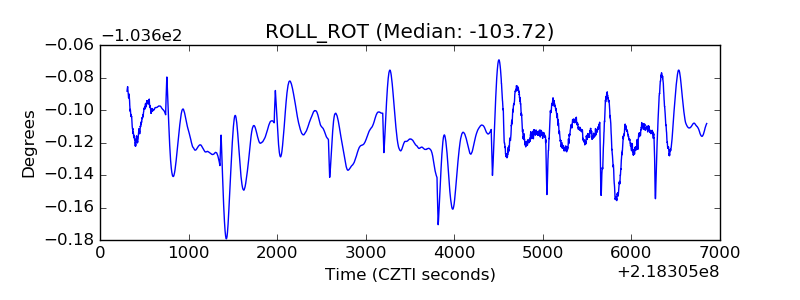 |
| _Roll_DEC | 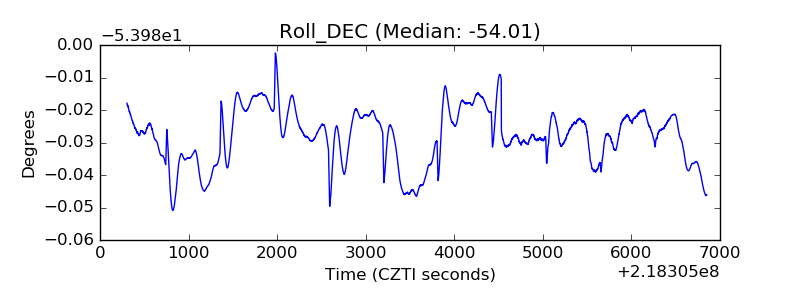 |
| _Roll_RA | 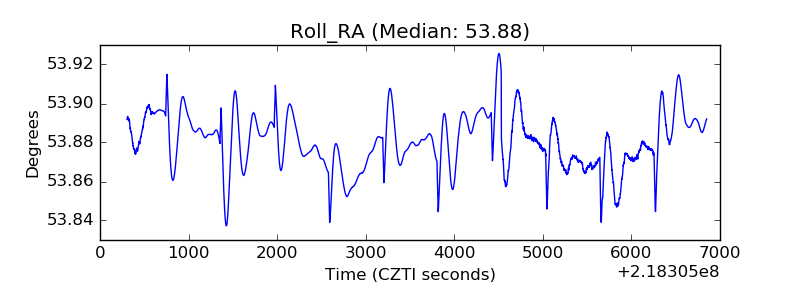 |
| Veto Counter | 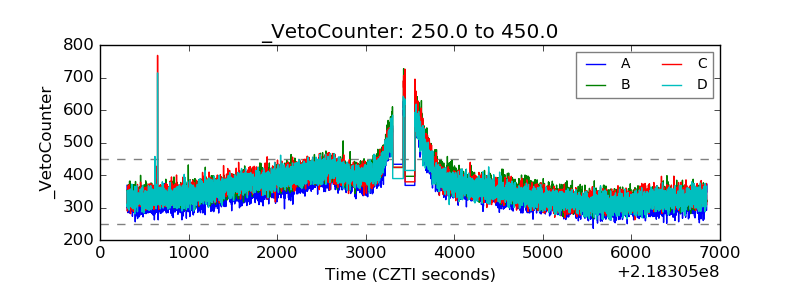 |