| Param | Original file | Final file |
|---|---|---|
| Filename | modeM0/AS1A02_124T01_9000000842_06377cztM0_level2.evt | modeM0/AS1A02_124T01_9000000842_06377cztM0_level2_quad_clean.evt |
| Size (bytes) | 1,452,513,600 | 275,590,080 |
| Size | 1.4 GB | 262.8 MB |
| Events in quadrant A | 10,227,093 | 1,722,439 |
| Events in quadrant B | 10,990,562 | 1,731,169 |
| Events in quadrant C | 9,881,327 | 1,696,785 |
| Events in quadrant D | 11,372,060 | 1,651,400 |
| Mode M9 | |||
|---|---|---|---|
| Quadrant | BADHDUFLAG | Total packets | Discarded packets |
| A | 0 | 26 | 0 |
| B | 0 | 26 | 0 |
| C | 0 | 26 | 0 |
| D | 0 | 26 | 0 |
| Mode M0 | |||
|---|---|---|---|
| Quadrant | BADHDUFLAG | Total packets | Discarded packets |
| A | 0 | 46070 | 5 |
| B | 0 | 48254 | 4 |
| C | 0 | 45602 | 4 |
| D | 0 | 50375 | 4 |
| Mode SS | |||
|---|---|---|---|
| Quadrant | BADHDUFLAG | Total packets | Discarded packets |
| A | 0 | 456 | 0 |
| B | 0 | 456 | 0 |
| C | 0 | 456 | 0 |
| D | 0 | 456 | 0 |
| Quadrant | Total seconds | Saturated seconds | Saturation percentage |
|---|---|---|---|
| A | 22453 | 70 | 0.311762% |
| B | 22453 | 221 | 0.984278% |
| C | 22453 | 36 | 0.160335% |
| D | 22453 | 372 | 1.656794% |
Noise dominated data is calculated using 1-second bins in cleaned event files. If a bin has >2000 counts, and if more than 50% of those come from <1% of pixels, then it is considered to be noise-dominated and hence unusable.
| Quadrant | # 1 sec bins | Bins with >0 counts | Bins with >2000 counts | High rate bins dominated by noise | Noise dominated (total time) | Noise dominated (detector-on time) | Marked lightcurve |
|---|---|---|---|---|---|---|---|
| A | 24988 | 22457 | 21 | 21 | 0.08% | 0.09% | 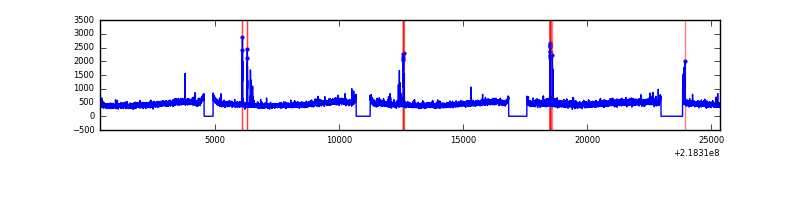 |
| B | 24988 | 22457 | 52 | 52 | 0.21% | 0.23% | 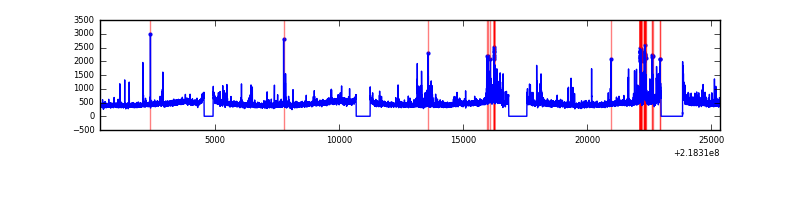 |
| C | 24988 | 22457 | 8 | 8 | 0.03% | 0.04% | 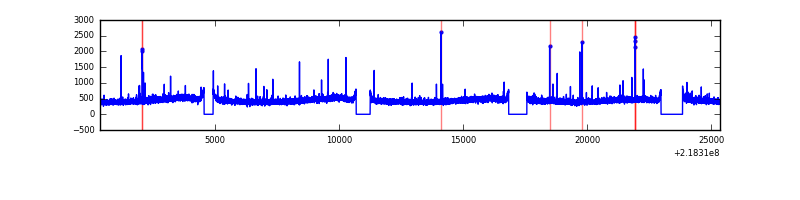 |
| D | 24988 | 22457 | 273 | 273 | 1.09% | 1.22% | 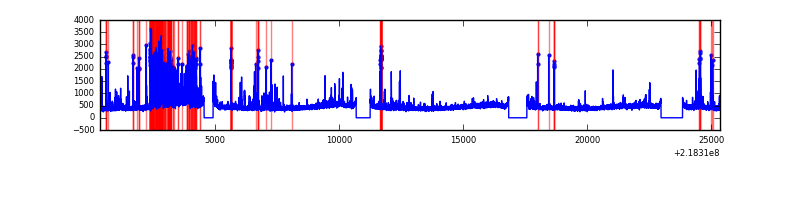 |
Top three noisy pixels from each quadrant. If the there are fewer than three noisy pixels in the level2.evt file, extra rows are filled as -1
| Pixel properties | Quadrant properties | ||||||
|---|---|---|---|---|---|---|---|
| Quadrant | DetID | PixID | Counts | Sigma | Mean | Median | Sigma |
| A | 15 | 236 | 228323 | 442.93 | 2531 | 2476 | 509.9 |
| A | 15 | 174 | 122122 | 234.65 | 2531 | 2476 | 509.9 |
| A | 8 | 15 | 90991 | 173.59 | 2531 | 2476 | 509.9 |
| B | 0 | 228 | 757753 | 1536.23 | 2560 | 2498 | 491.6 |
| B | 0 | 219 | 172582 | 345.96 | 2560 | 2498 | 491.6 |
| B | 4 | 81 | 56062 | 108.95 | 2560 | 2498 | 491.6 |
| C | 4 | 254 | 126354 | 216.3 | 2479 | 2488 | 572.7 |
| C | 8 | 128 | 27184 | 43.12 | 2479 | 2488 | 572.7 |
| C | 1 | 241 | 23064 | 35.93 | 2479 | 2488 | 572.7 |
| D | 4 | 95 | 1176688 | 1976.87 | 2452 | 2376 | 594.0 |
| D | 2 | 152 | 531256 | 890.33 | 2452 | 2376 | 594.0 |
| D | 11 | 241 | 209824 | 349.22 | 2452 | 2376 | 594.0 |
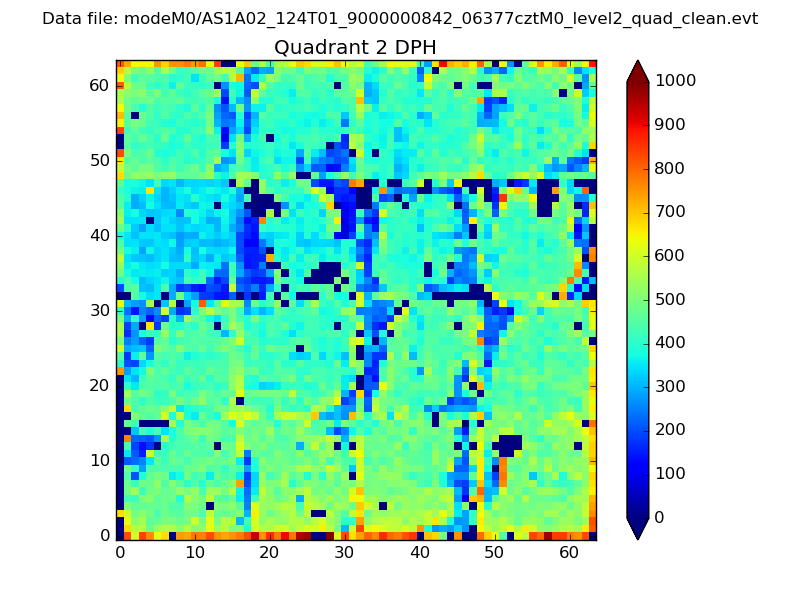
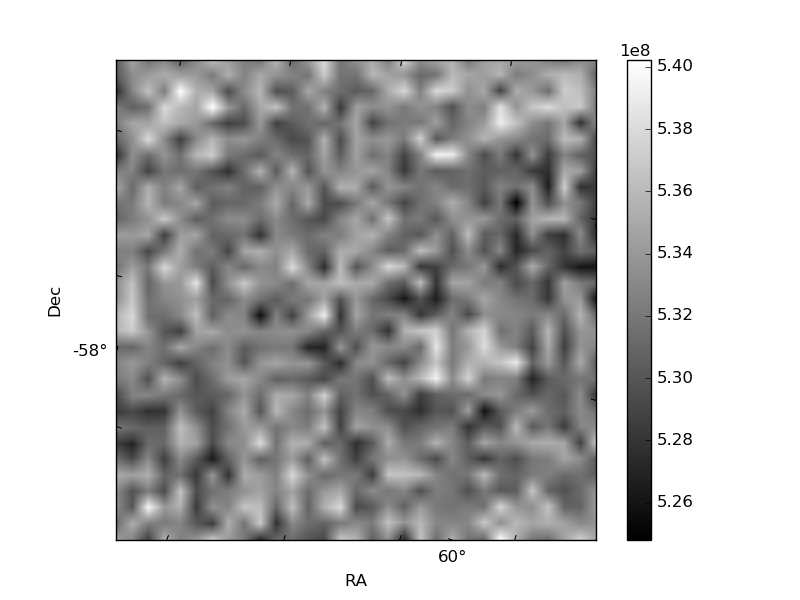
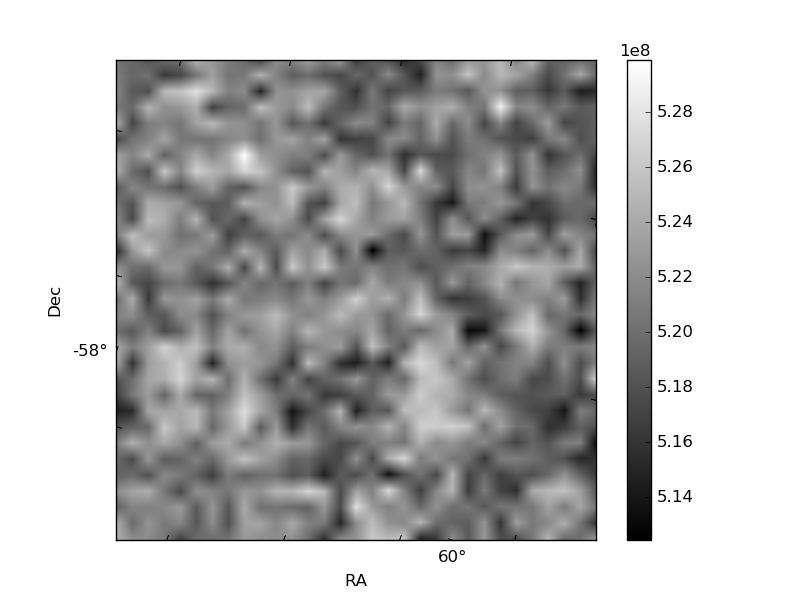
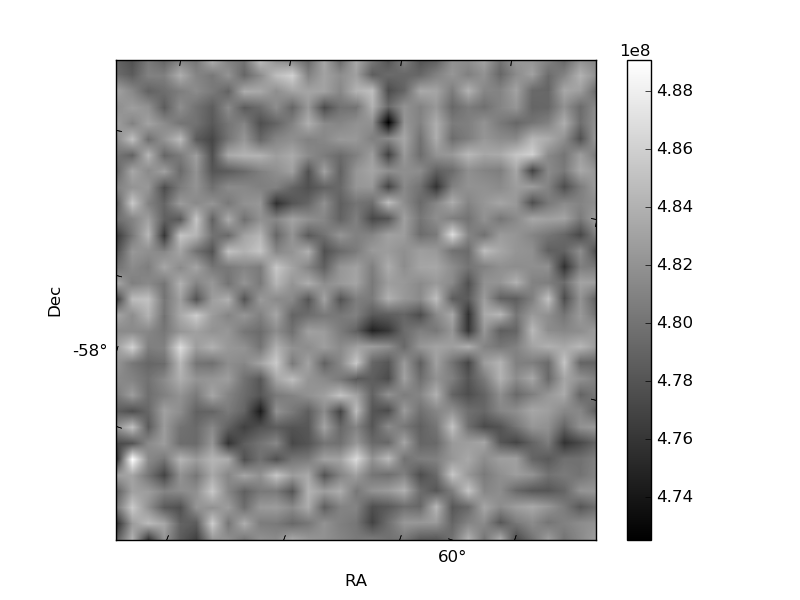
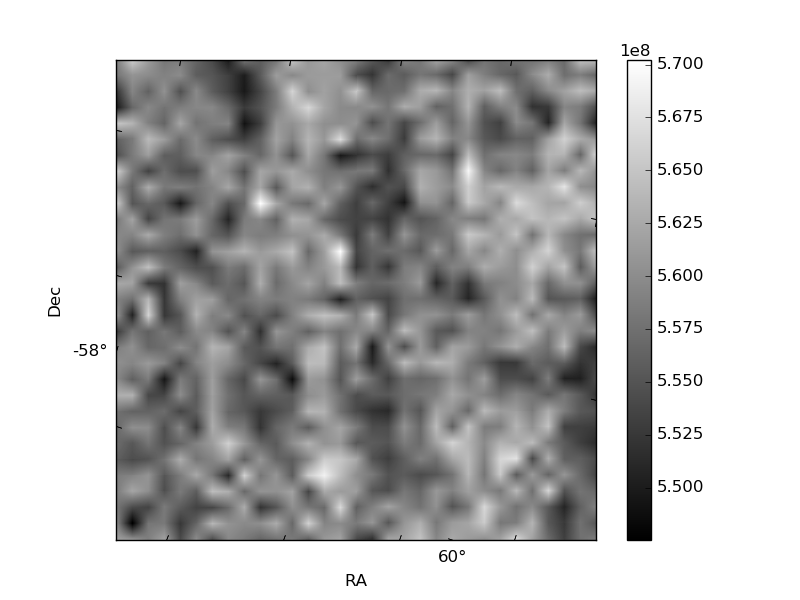
Histogram calculated using DETX and DETY for each event in the final _common_clean file
| Quadrant A | 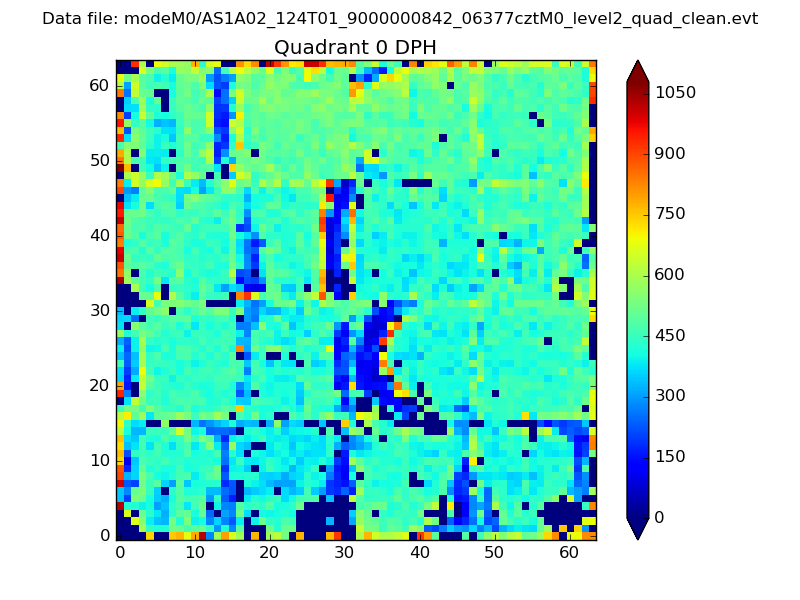 |
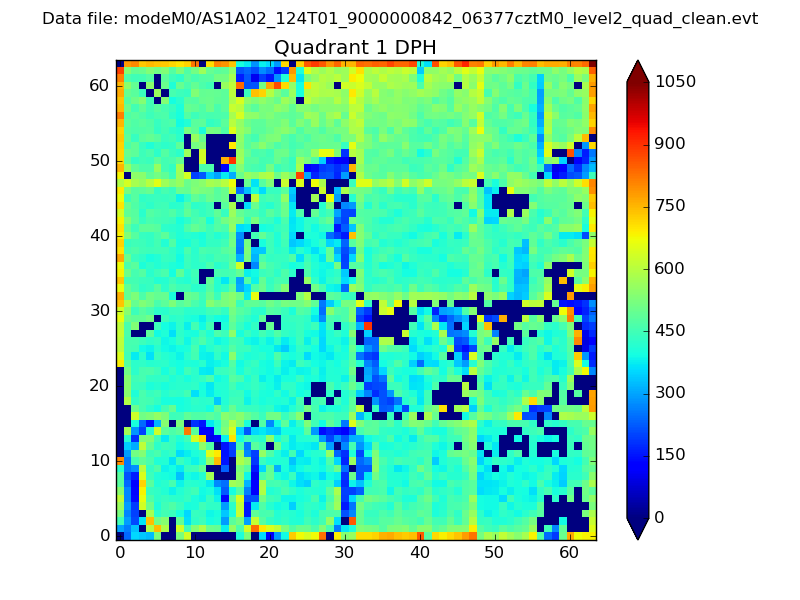 |
Quadrant B |
|---|---|---|---|
| Quadrant D | 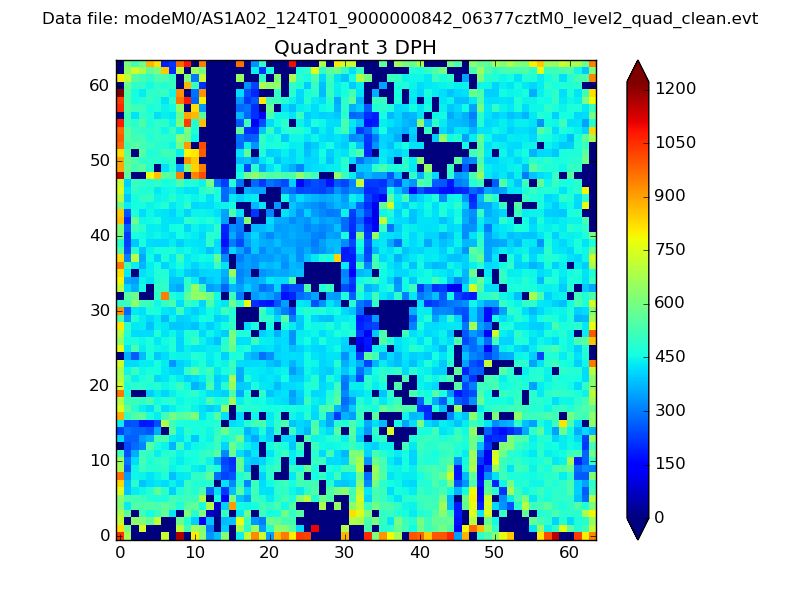 |
 |
Quadrant C |
| Plot type | Count rate plots | Images |
|---|---|---|
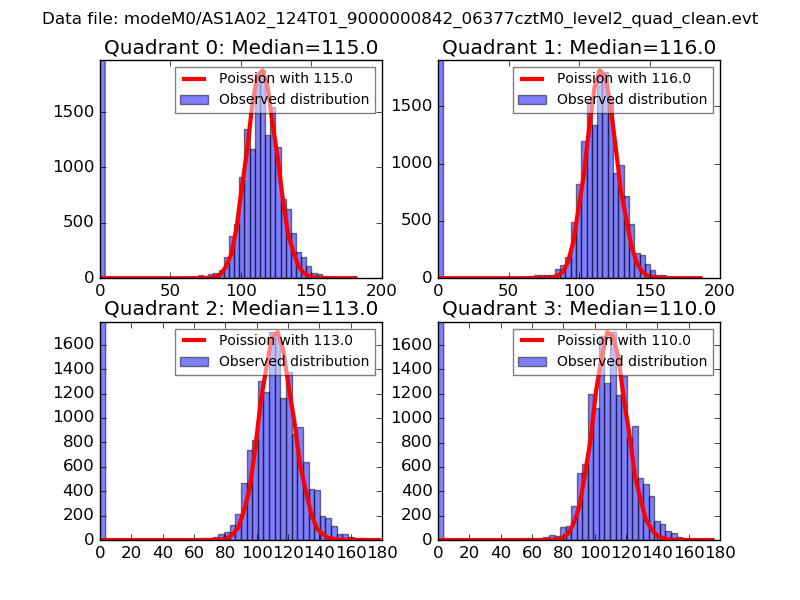
| Comparison with Poisson distribution Blue bars denote a histogram of data divided into 1 sec bins. Red curve is a Poisson curve with rate = median count rate of data. |
 |
 |
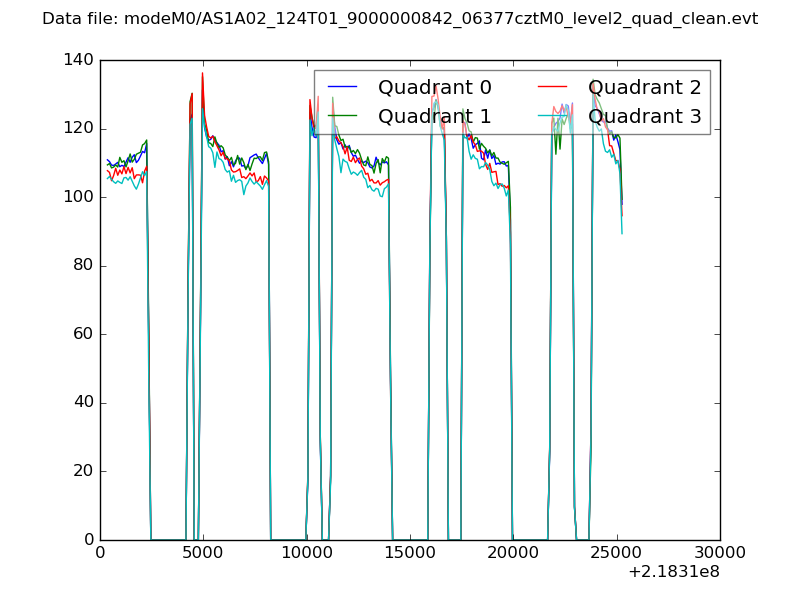
| Quadrant-wise count rates Data is divided into 100 sec bins |
 |
|
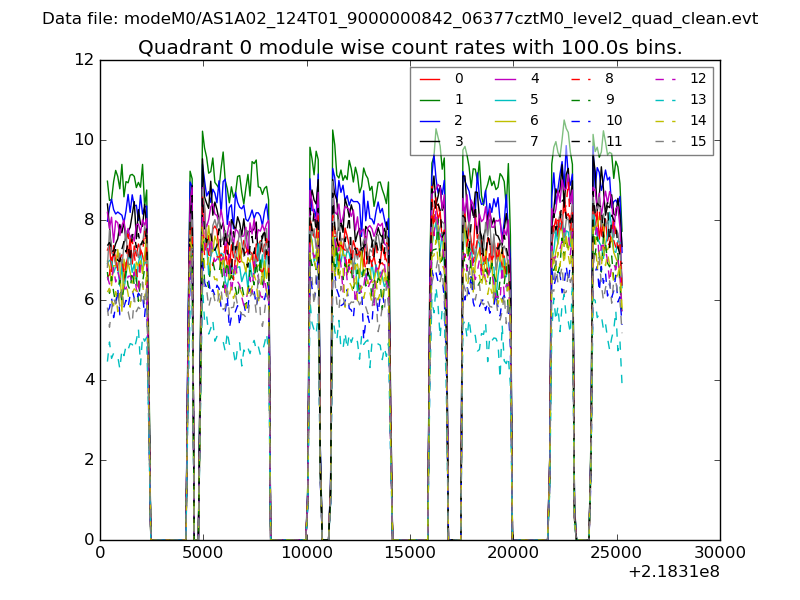
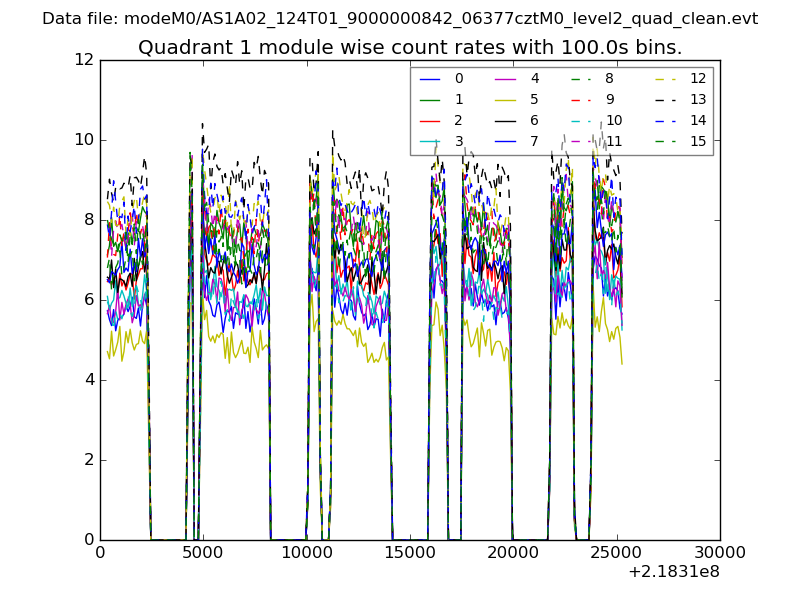
| Module-wise count rates for Quadrant A Data is divided into 100 sec bins |
 |
 |
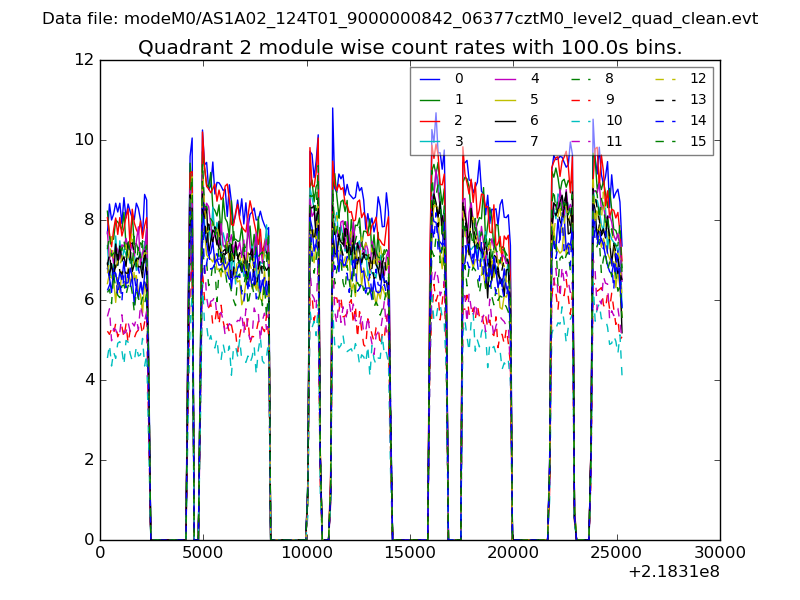
| Module-wise count rates for Quadrant B Data is divided into 100 sec bins |
 |
 |
| Module-wise count rates for Quadrant C Data is divided into 100 sec bins |
 |
 |
| Module-wise count rates for Quadrant D Data is divided into 100 sec bins |
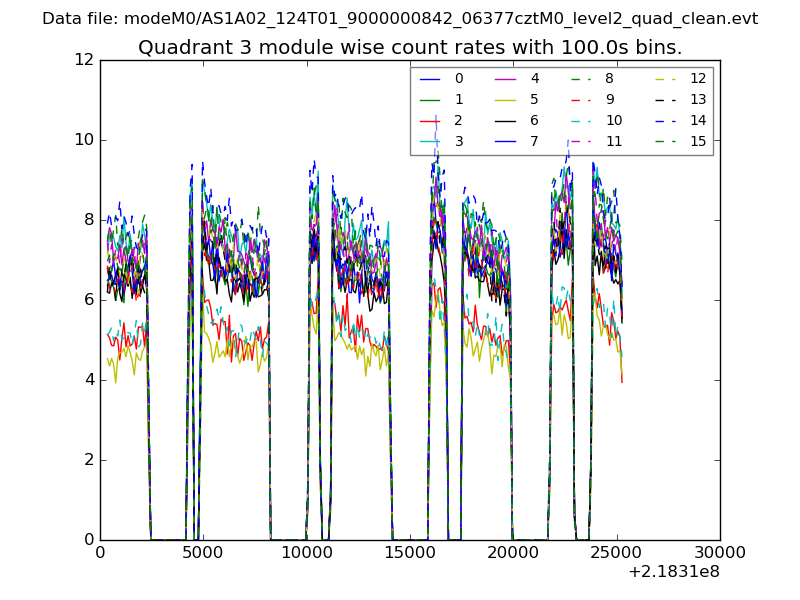 |
 |
| Parameter | Plot |
|---|---|
| CZT HV Monitor | 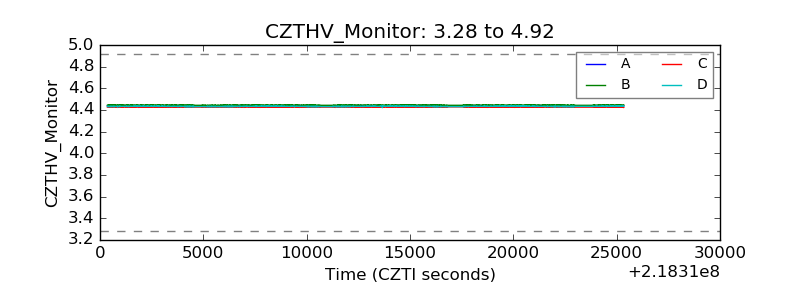 |
| D_VDD | 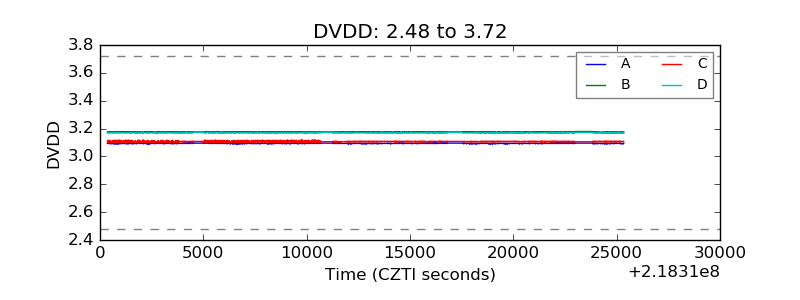 |
| Temperature 1 | 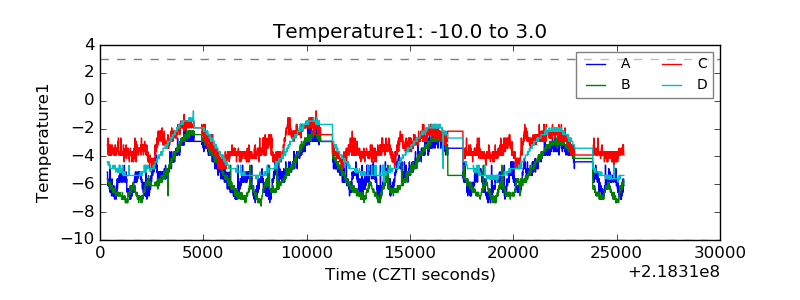 |
| Veto HV Monitor | 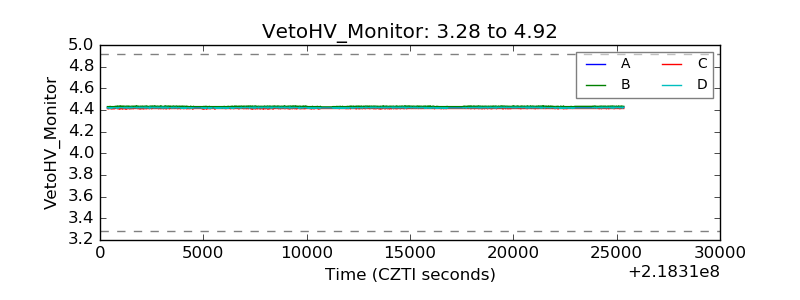 |
| Veto LLD | 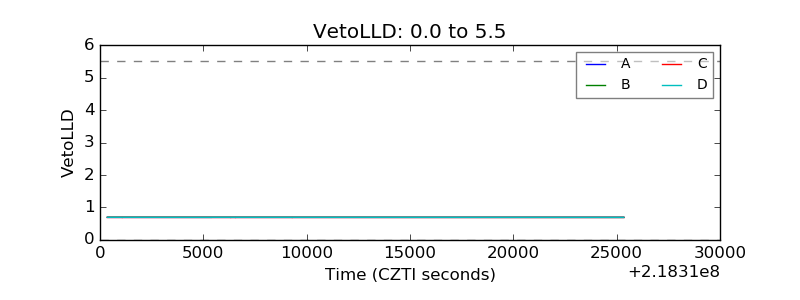 |
| Alpha Counter | 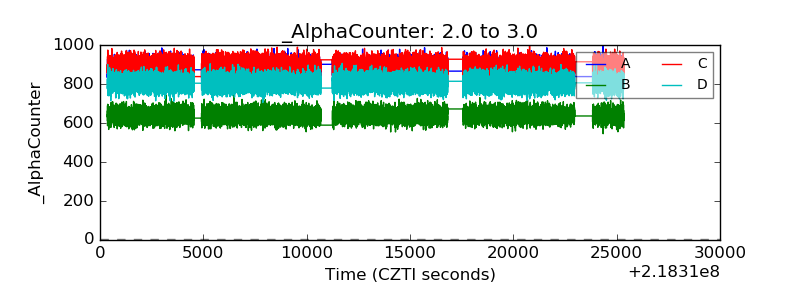 |
| _CPM_Rate | 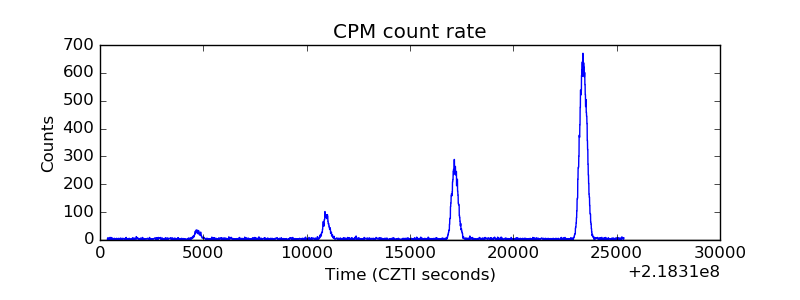 |
| CZT Counter | 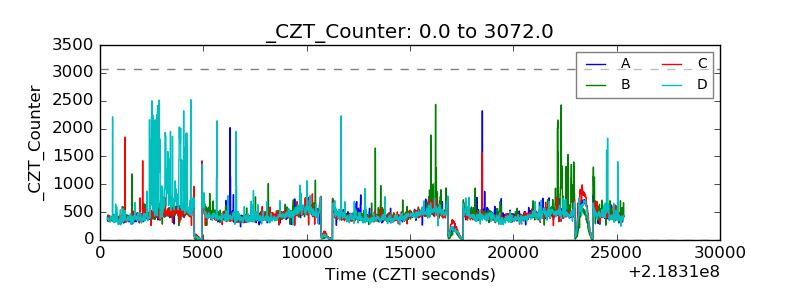 |
| +2.5 Volts monitor |  |
| +5 Volts monitor |  |
| _ROLL_ROT | 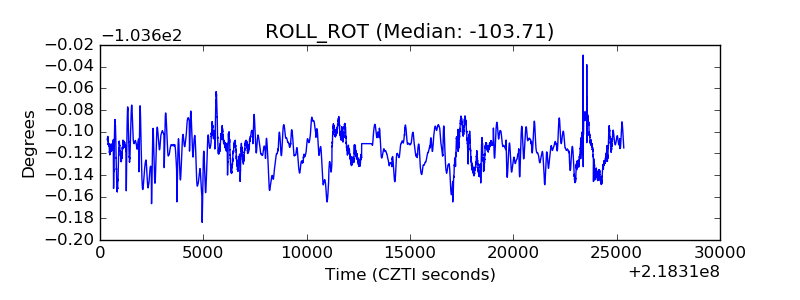 |
| _Roll_DEC | 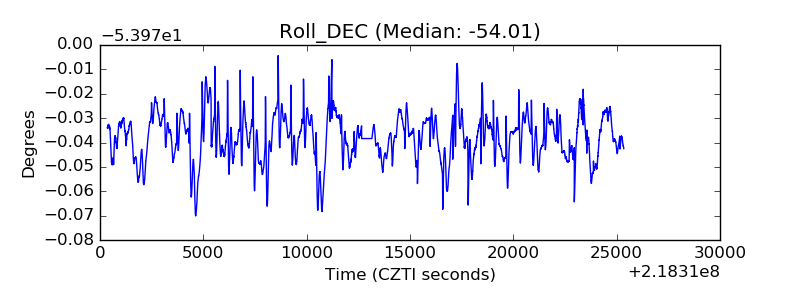 |
| _Roll_RA | 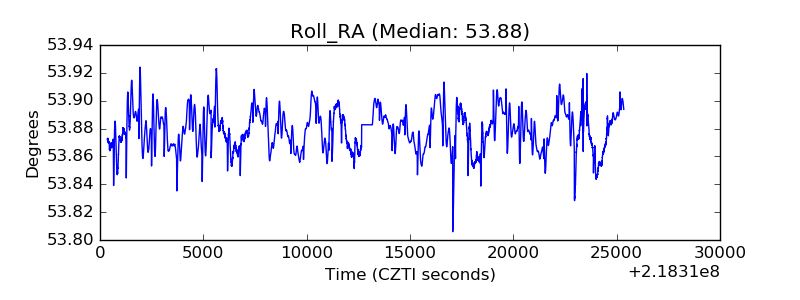 |
| Veto Counter | 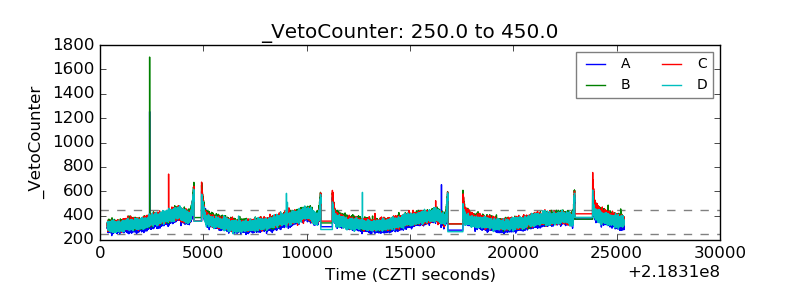 |