| Param | Original file | Final file |
|---|---|---|
| Filename | modeM0/AS1A02_124T01_9000000842_06378cztM0_level2.evt | modeM0/AS1A02_124T01_9000000842_06378cztM0_level2_quad_clean.evt |
| Size (bytes) | 156,225,600 | 41,016,960 |
| Size | 149.0 MB | 39.1 MB |
| Events in quadrant A | 1,092,496 | 271,048 |
| Events in quadrant B | 1,299,643 | 272,970 |
| Events in quadrant C | 1,062,697 | 265,775 |
| Events in quadrant D | 1,109,062 | 257,576 |
| Mode M9 | |||
|---|---|---|---|
| Quadrant | BADHDUFLAG | Total packets | Discarded packets |
| A | 0 | 9 | 0 |
| B | 0 | 9 | 0 |
| C | 0 | 9 | 0 |
| D | 0 | 9 | 0 |
| Mode M0 | |||
|---|---|---|---|
| Quadrant | BADHDUFLAG | Total packets | Discarded packets |
| A | 0 | 5025 | 1 |
| B | 0 | 5493 | 1 |
| C | 0 | 4954 | 1 |
| D | 0 | 5136 | 1 |
| Mode SS | |||
|---|---|---|---|
| Quadrant | BADHDUFLAG | Total packets | Discarded packets |
| A | 0 | 50 | 0 |
| B | 0 | 50 | 0 |
| C | 0 | 50 | 0 |
| D | 0 | 50 | 0 |
| Quadrant | Total seconds | Saturated seconds | Saturation percentage |
|---|---|---|---|
| A | 2426 | 13 | 0.535862% |
| B | 2426 | 56 | 2.308326% |
| C | 2426 | 5 | 0.206101% |
| D | 2426 | 12 | 0.494641% |
Noise dominated data is calculated using 1-second bins in cleaned event files. If a bin has >2000 counts, and if more than 50% of those come from <1% of pixels, then it is considered to be noise-dominated and hence unusable.
| Quadrant | # 1 sec bins | Bins with >0 counts | Bins with >2000 counts | High rate bins dominated by noise | Noise dominated (total time) | Noise dominated (detector-on time) | Marked lightcurve |
|---|---|---|---|---|---|---|---|
| A | 3296 | 2427 | 1 | 1 | 0.03% | 0.04% | 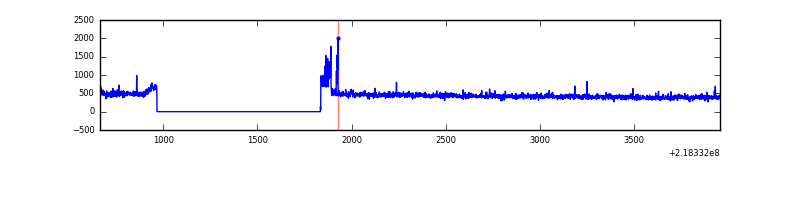 |
| B | 3296 | 2427 | 2 | 2 | 0.06% | 0.08% | 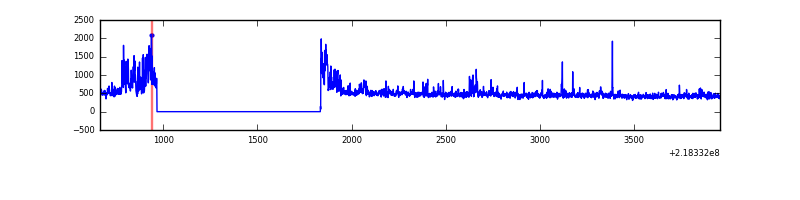 |
| C | 3296 | 2427 | 0 | 0 | 0.00% | 0.00% | 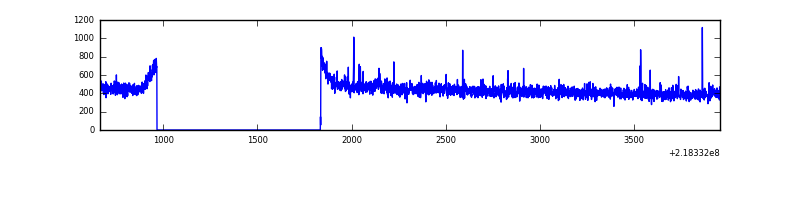 |
| D | 3296 | 2427 | 9 | 9 | 0.27% | 0.37% | 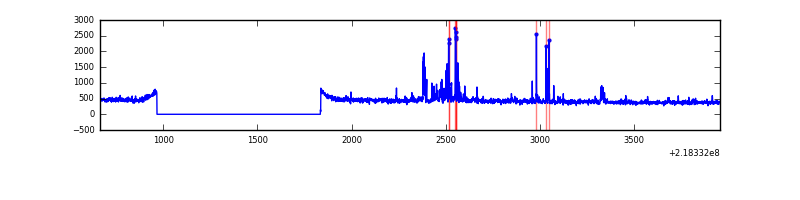 |
Top three noisy pixels from each quadrant. If the there are fewer than three noisy pixels in the level2.evt file, extra rows are filled as -1
| Pixel properties | Quadrant properties | ||||||
|---|---|---|---|---|---|---|---|
| Quadrant | DetID | PixID | Counts | Sigma | Mean | Median | Sigma |
| A | 15 | 236 | 33325 | 580.01 | 272 | 266 | 57.0 |
| A | 8 | 15 | 9945 | 169.81 | 272 | 266 | 57.0 |
| A | 12 | 194 | 2522 | 39.58 | 272 | 266 | 57.0 |
| B | 0 | 228 | 171580 | 3144.0 | 277 | 270 | 54.5 |
| B | 0 | 219 | 30357 | 552.18 | 277 | 270 | 54.5 |
| B | 4 | 81 | 16779 | 302.98 | 277 | 270 | 54.5 |
| C | 1 | 241 | 8146 | 123.07 | 268 | 268 | 64.0 |
| C | 4 | 254 | 5369 | 79.69 | 268 | 268 | 64.0 |
| C | 13 | 61 | 2053 | 27.89 | 268 | 268 | 64.0 |
| D | 2 | 152 | 94077 | 1447.13 | 263 | 256 | 64.8 |
| D | 11 | 241 | 12464 | 188.3 | 263 | 256 | 64.8 |
| D | 5 | 97 | 8810 | 131.94 | 263 | 256 | 64.8 |
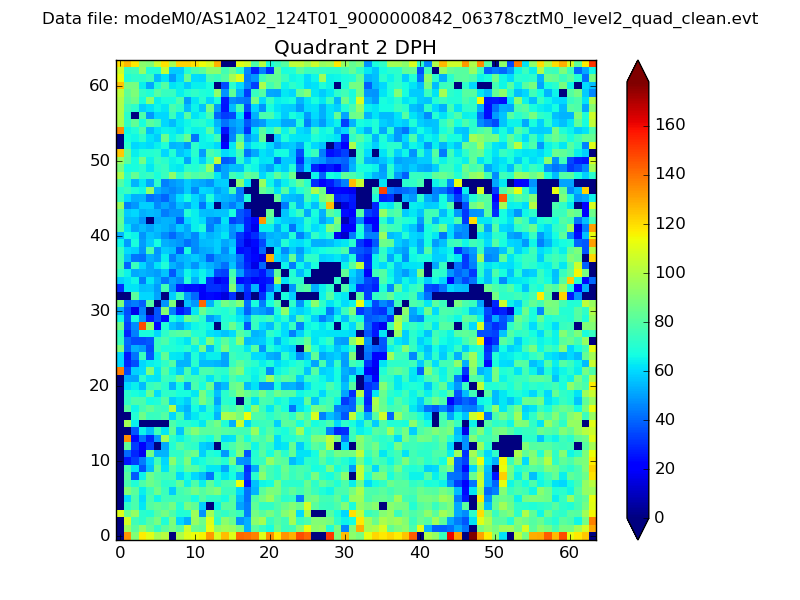
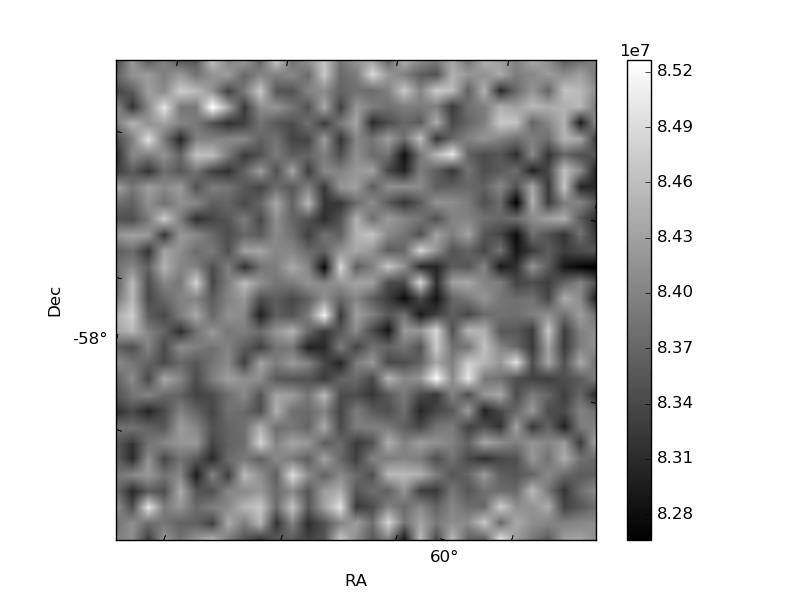
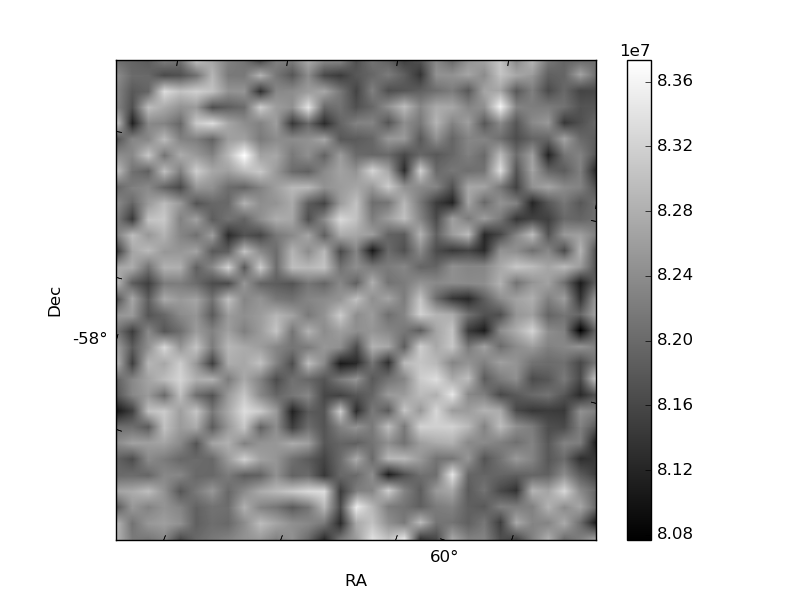
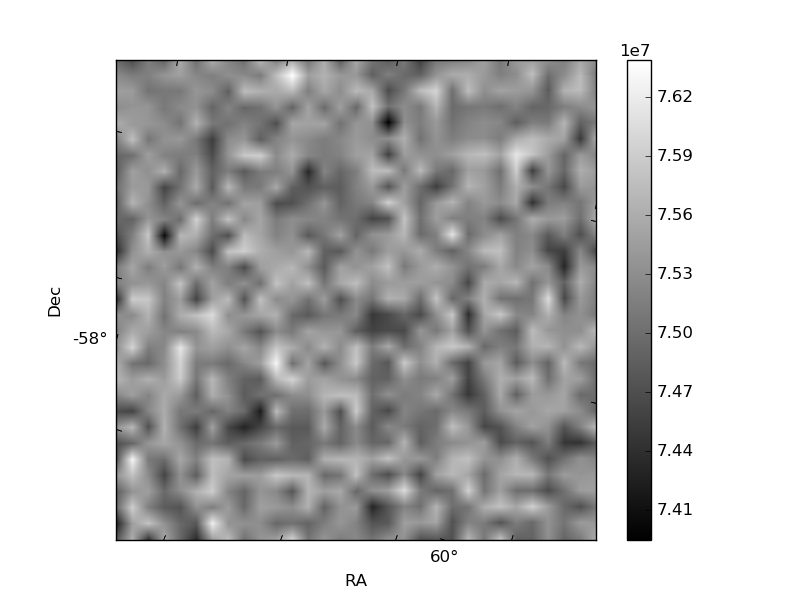
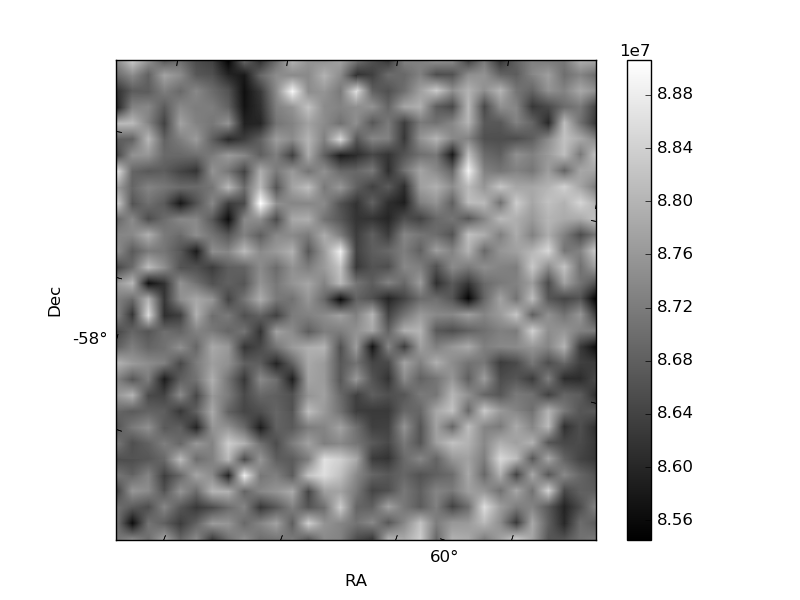
Histogram calculated using DETX and DETY for each event in the final _common_clean file
| Quadrant A | 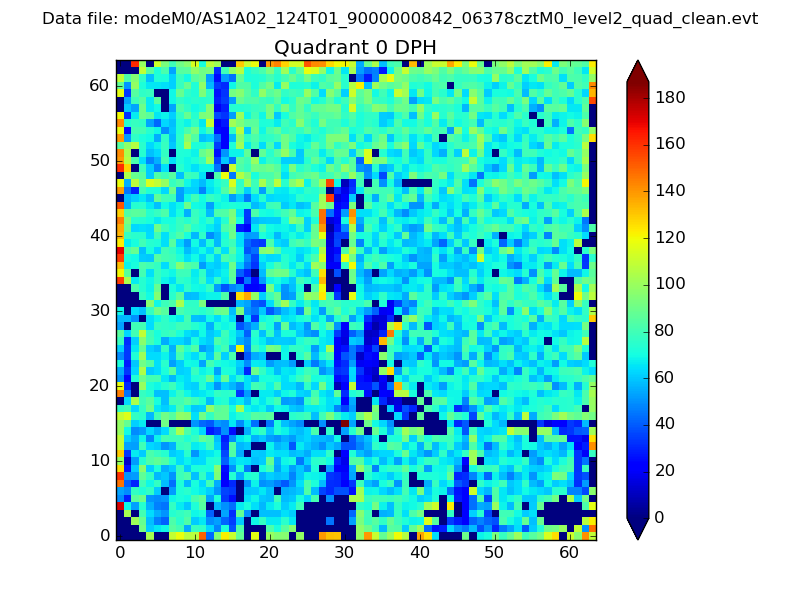 |
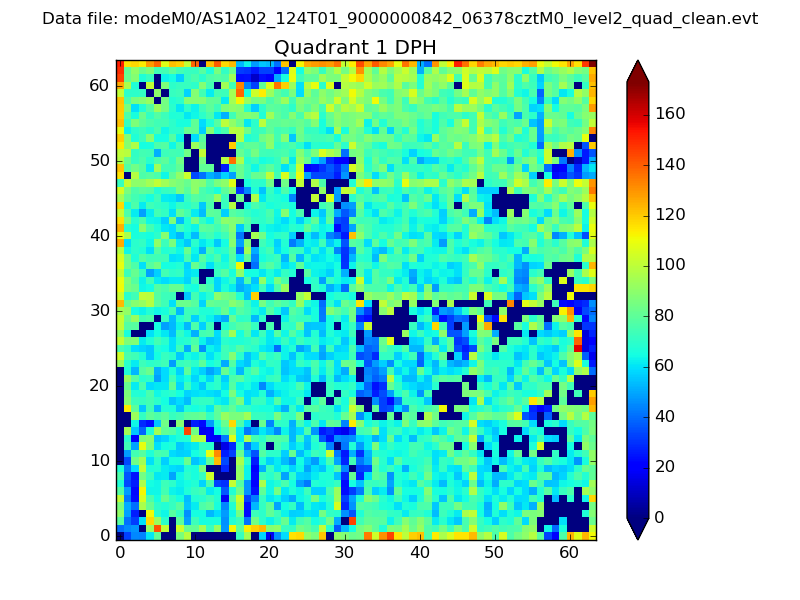 |
Quadrant B |
|---|---|---|---|
| Quadrant D | 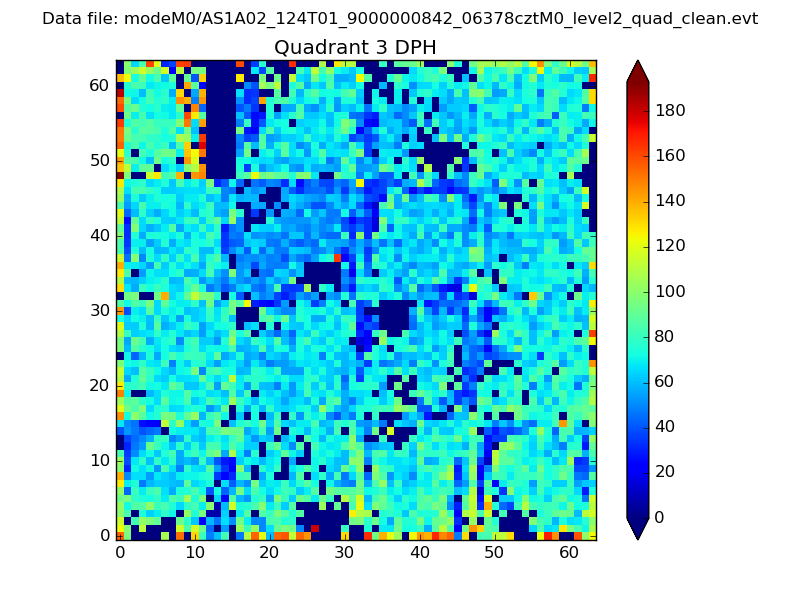 |
 |
Quadrant C |
| Plot type | Count rate plots | Images |
|---|---|---|
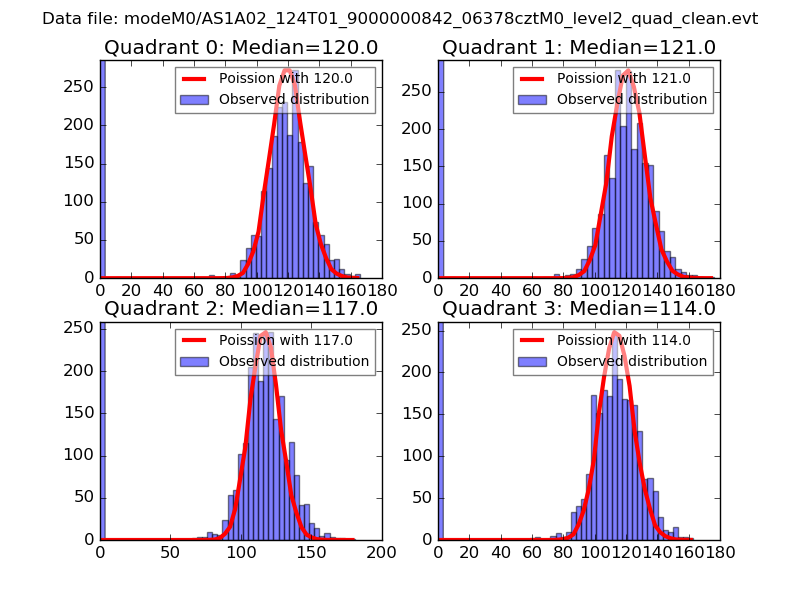
| Comparison with Poisson distribution Blue bars denote a histogram of data divided into 1 sec bins. Red curve is a Poisson curve with rate = median count rate of data. |
 |
 |
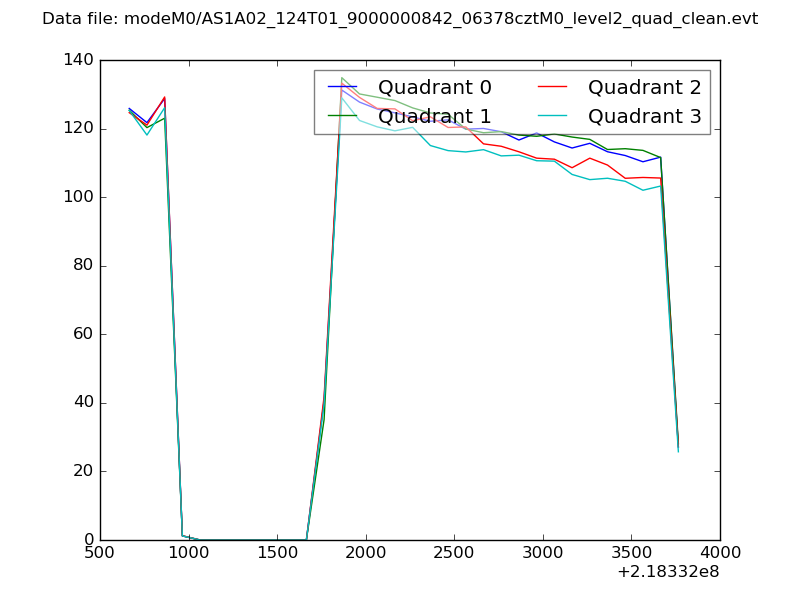
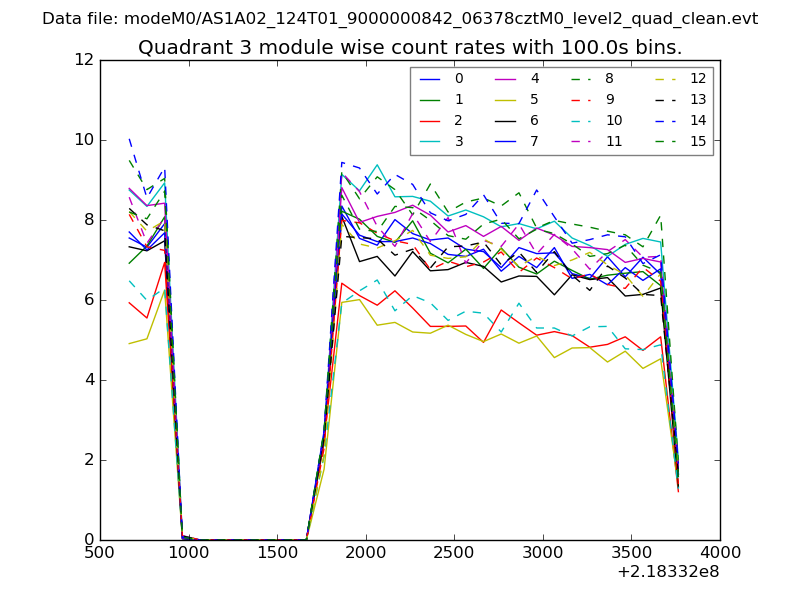
| Quadrant-wise count rates Data is divided into 100 sec bins |
 |
|
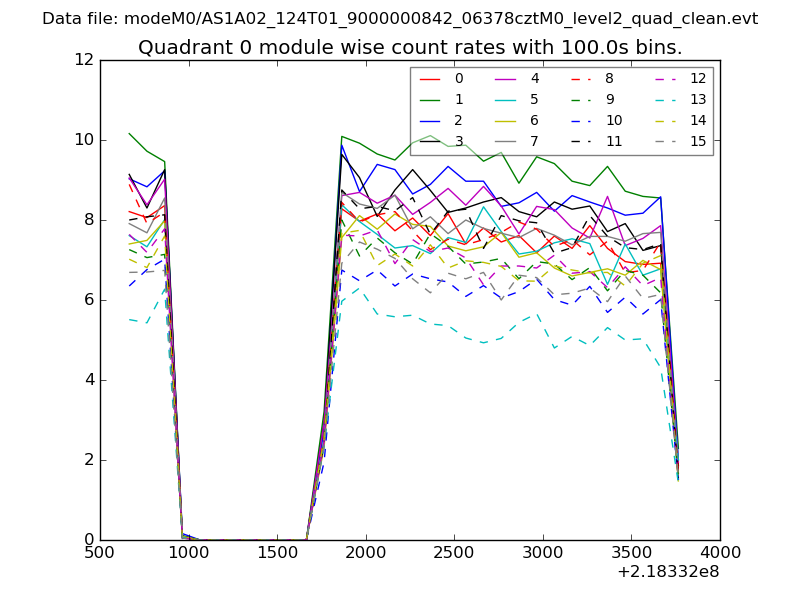
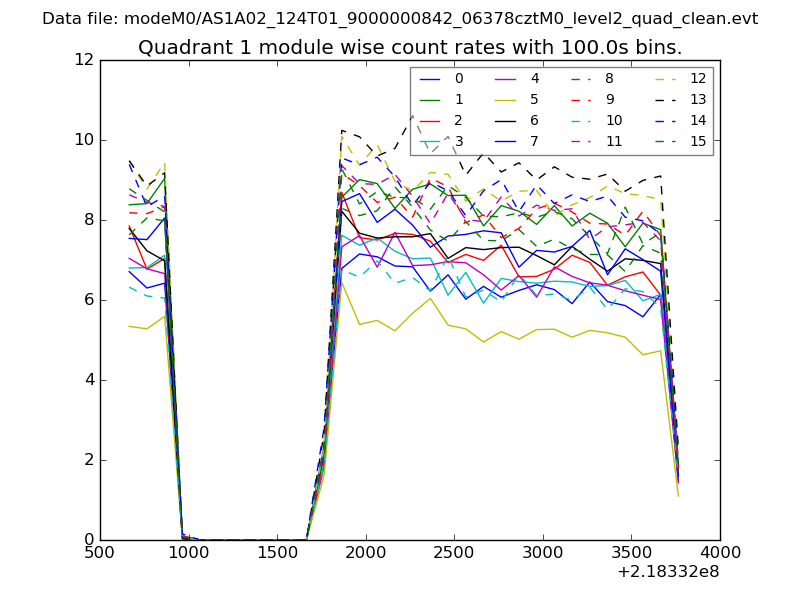
| Module-wise count rates for Quadrant A Data is divided into 100 sec bins |
 |
 |
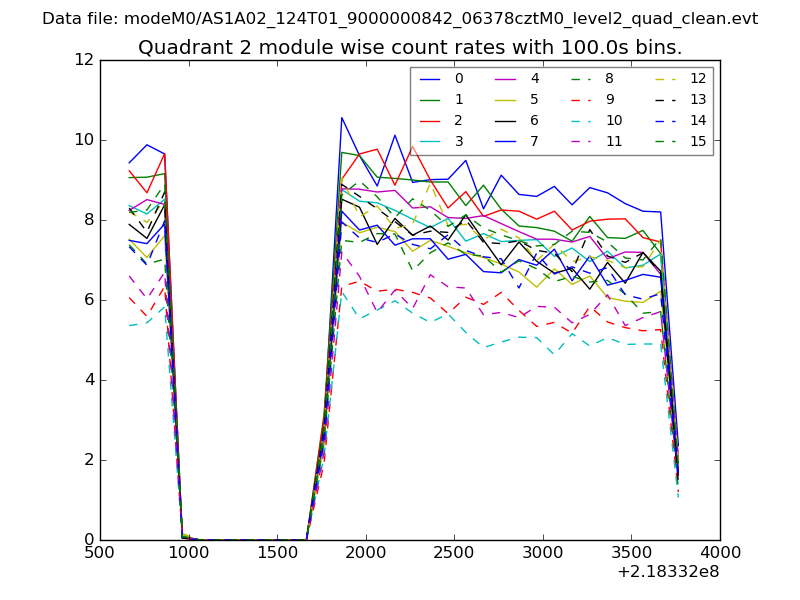
| Module-wise count rates for Quadrant B Data is divided into 100 sec bins |
 |
 |
| Module-wise count rates for Quadrant C Data is divided into 100 sec bins |
 |
 |
| Module-wise count rates for Quadrant D Data is divided into 100 sec bins |
 |
 |
| Parameter | Plot |
|---|---|
| CZT HV Monitor | 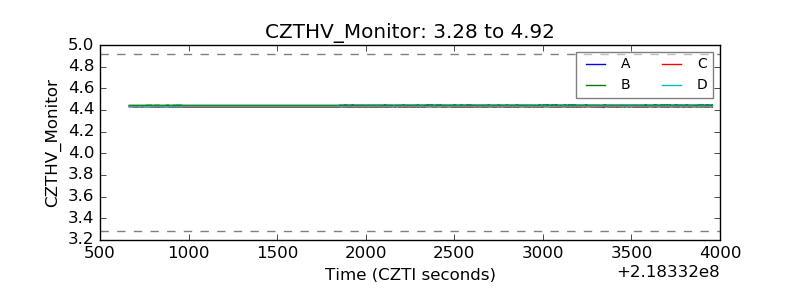 |
| D_VDD | 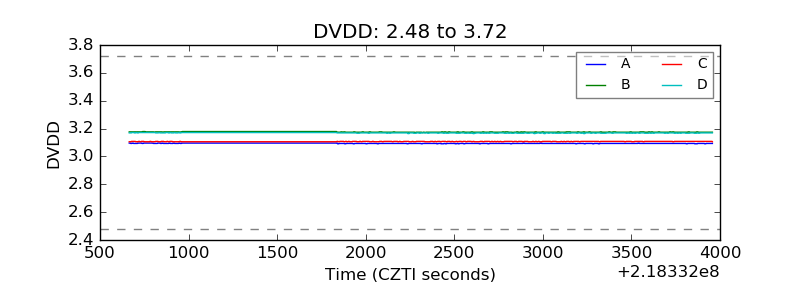 |
| Temperature 1 | 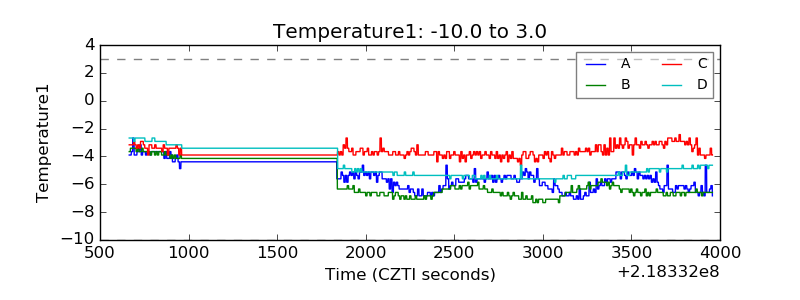 |
| Veto HV Monitor | 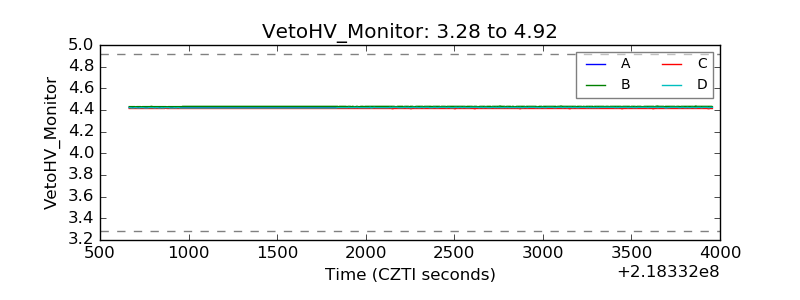 |
| Veto LLD | 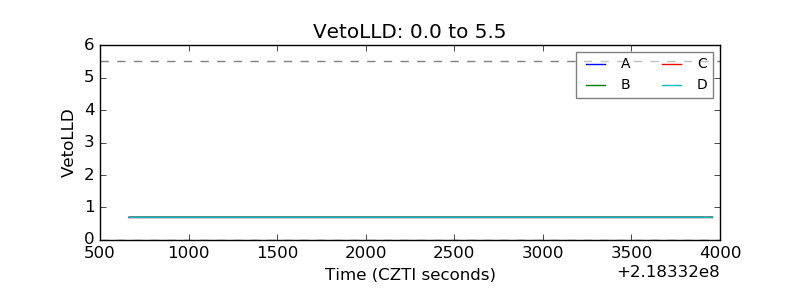 |
| Alpha Counter | 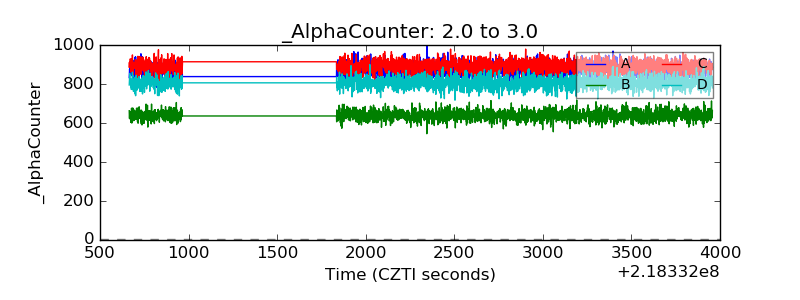 |
| _CPM_Rate | 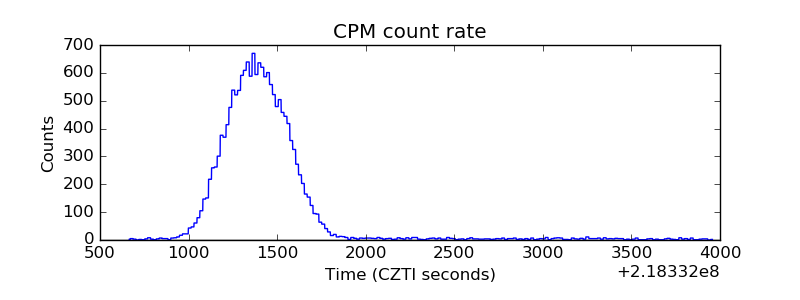 |
| CZT Counter | 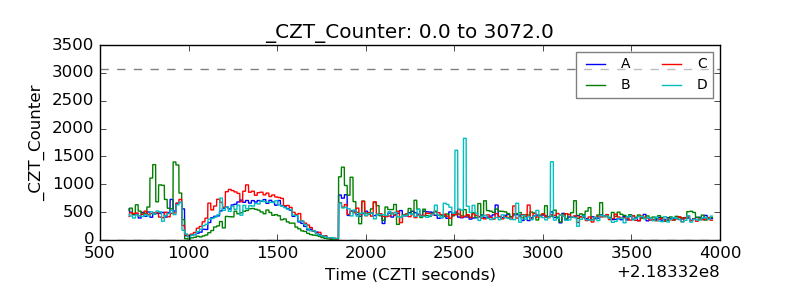 |
| +2.5 Volts monitor |  |
| +5 Volts monitor |  |
| _ROLL_ROT | 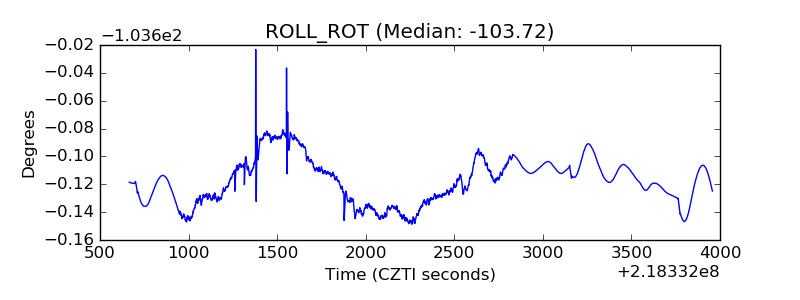 |
| _Roll_DEC | 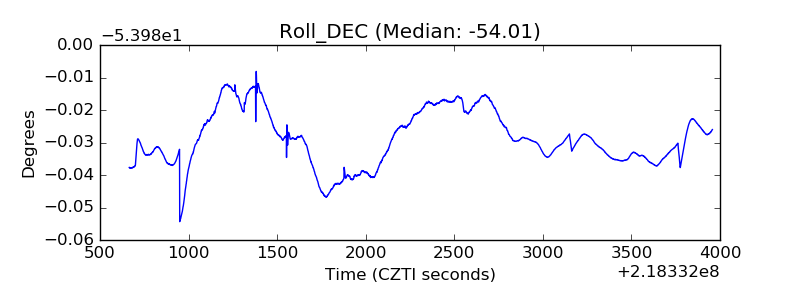 |
| _Roll_RA | 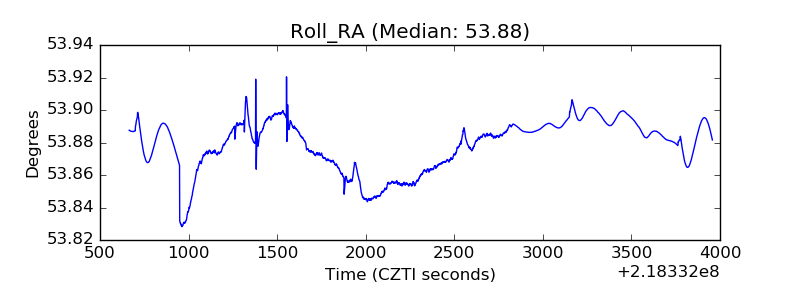 |
| Veto Counter | 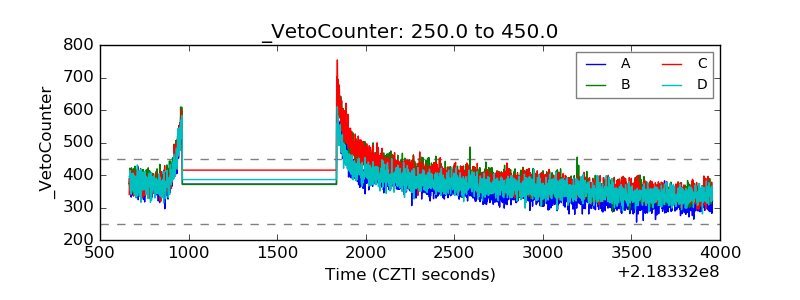 |