| Param | Original file | Final file |
|---|---|---|
| Filename | modeM0/AS1C02_017T01_9000000848cztM0_level2.fits | modeM0/AS1C02_017T01_9000000848cztM0_level2_quad_clean.evt |
| Size (bytes) | 407,730,240 | 529,629,120 |
| Size | 388.8 MB | 505.1 MB |
| Events in quadrant A | 2,386,508 | 3,270,212 |
| Events in quadrant B | 2,384,864 | 3,421,127 |
| Events in quadrant C | 2,450,534 | 3,304,439 |
| Events in quadrant D | 2,107,056 | 3,027,225 |
| Mode SS | |||
|---|---|---|---|
| Quadrant | BADHDUFLAG | Total packets | Discarded packets |
| A | 0 | 896 | 0 |
| B | 0 | 896 | 0 |
| C | 0 | 896 | 0 |
| D | 0 | 896 | 0 |
| Mode M0 | |||
|---|---|---|---|
| Quadrant | BADHDUFLAG | Total packets | Discarded packets |
| A | 0 | 108406 | 0 |
| B | 0 | 95405 | 0 |
| C | 0 | 89498 | 0 |
| D | 0 | 99790 | 0 |
| Mode M9 | |||
|---|---|---|---|
| Quadrant | BADHDUFLAG | Total packets | Discarded packets |
| A | 0 | 75 | 0 |
| B | 0 | 75 | 0 |
| C | 0 | 75 | 0 |
| D | 0 | 75 | 0 |
| Quadrant | Total seconds | Saturated seconds | Saturation percentage |
|---|---|---|---|
| A | 43957 | 2592 | 5.896672% |
| B | 43957 | 686 | 1.560616% |
| C | 43957 | 310 | 0.705235% |
| D | 43957 | 629 | 1.430944% |
Noise dominated data is calculated using 1-second bins in cleaned event files. If a bin has >2000 counts, and if more than 50% of those come from <1% of pixels, then it is considered to be noise-dominated and hence unusable.
| Quadrant | # 1 sec bins | Bins with >0 counts | Bins with >2000 counts | High rate bins dominated by noise | Noise dominated (total time) | Noise dominated (detector-on time) | Marked lightcurve |
|---|---|---|---|---|---|---|---|
| A | 51592 | 43887 | 0 | 0 | 0.00% | 0.00% |  |
| B | 51592 | 43956 | 0 | 0 | 0.00% | 0.00% |  |
| C | 51592 | 43957 | 0 | 0 | 0.00% | 0.00% |  |
| D | 51592 | 43954 | 0 | 0 | 0.00% | 0.00% |  |
Top three noisy pixels from each quadrant. If the there are fewer than three noisy pixels in the level2.evt file, extra rows are filled as -1
| Pixel properties | Quadrant properties | ||||||
|---|---|---|---|---|---|---|---|
| Quadrant | DetID | PixID | Counts | Sigma | Mean | Median | Sigma |
| A | 0 | 29 | 2371 | 11.51 | 622 | 585 | 155.2 |
| A | 7 | 110 | 1985 | 9.02 | 622 | 585 | 155.2 |
| A | 0 | 30 | 1846 | 8.13 | 622 | 585 | 155.2 |
| B | 2 | 9 | 2125 | 12.16 | 630 | 603 | 125.1 |
| B | 14 | 254 | 1690 | 8.69 | 630 | 603 | 125.1 |
| B | 5 | 128 | 1643 | 8.31 | 630 | 603 | 125.1 |
| C | 1 | 81 | 1833 | 7.22 | 647 | 602 | 170.5 |
| C | 1 | 80 | 1751 | 6.74 | 647 | 602 | 170.5 |
| C | 12 | 241 | 1687 | 6.36 | 647 | 602 | 170.5 |
| D | 3 | 14 | 1605 | 6.71 | 600 | 548 | 157.6 |
| D | 6 | 231 | 1600 | 6.68 | 600 | 548 | 157.6 |
| D | 11 | 82 | 1571 | 6.49 | 600 | 548 | 157.6 |
Histogram calculated using DETX and DETY for each event in the final _common_clean file
| Quadrant A | 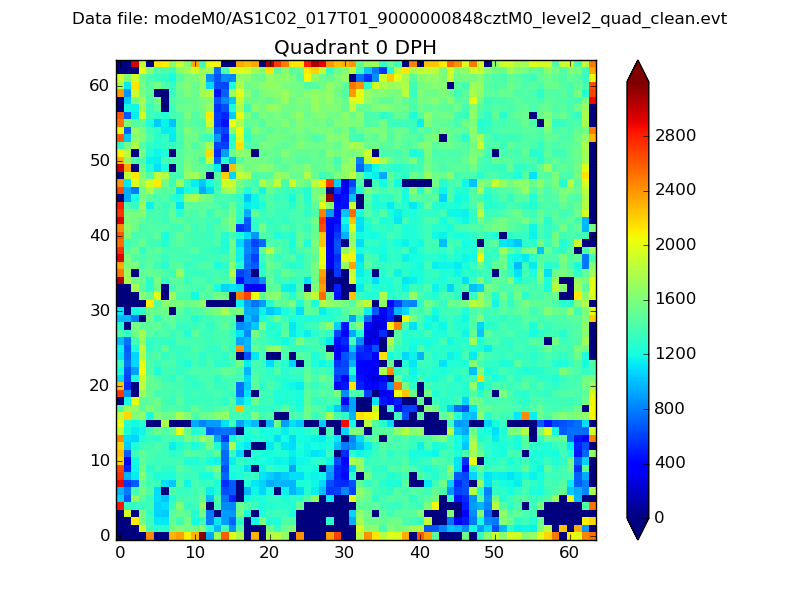 |
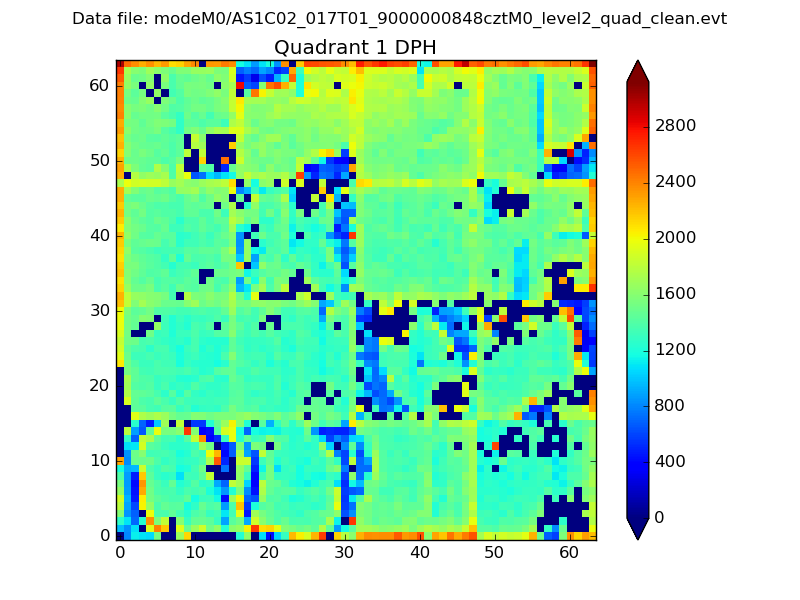 |
Quadrant B |
|---|---|---|---|
| Quadrant D | 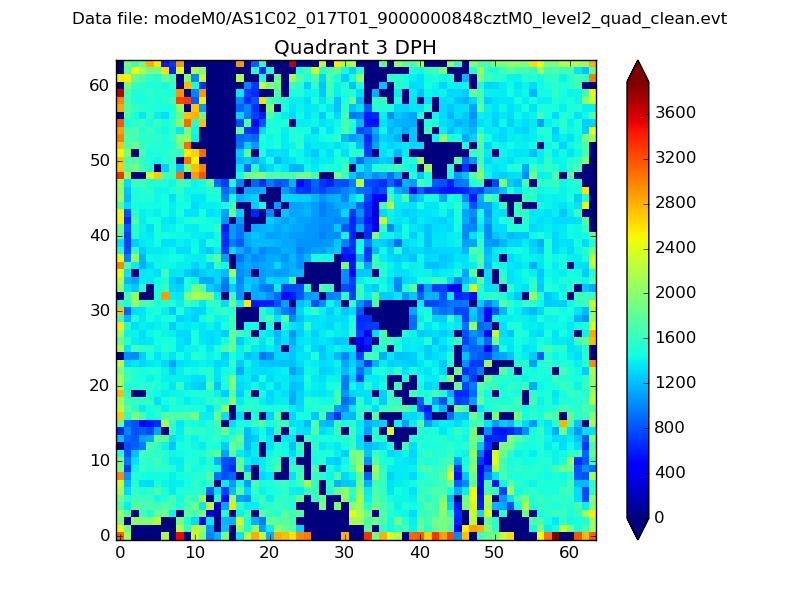 |
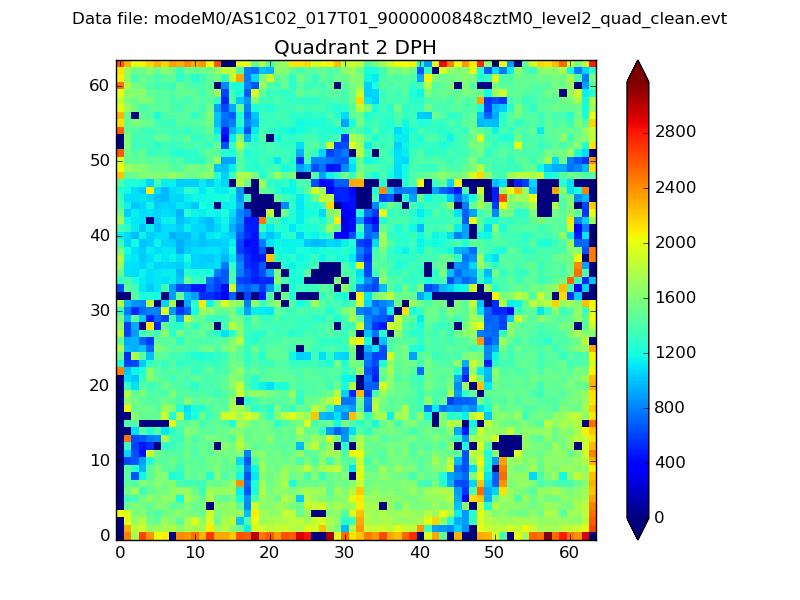 |
Quadrant C |
| Plot type | Count rate plots | Images |
|---|---|---|
| Comparison with Poisson distribution Blue bars denote a histogram of data divided into 1 sec bins. Red curve is a Poisson curve with rate = median count rate of data. |
 |
 |
| Quadrant-wise count rates Data is divided into 100 sec bins |
 |
|
| Module-wise count rates for Quadrant A Data is divided into 100 sec bins |
 |
 |
| Module-wise count rates for Quadrant B Data is divided into 100 sec bins |
 |
 |
| Module-wise count rates for Quadrant C Data is divided into 100 sec bins |
 |
 |
| Module-wise count rates for Quadrant D Data is divided into 100 sec bins |
 |
 |
| Parameter | Plot |
|---|---|
| CZT HV Monitor |  |
| D_VDD | 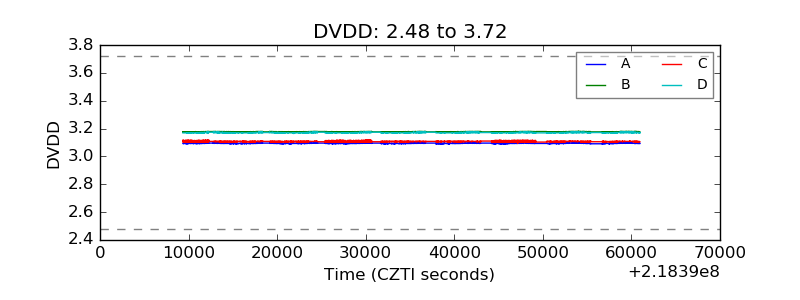 |
| Temperature 1 |  |
| Veto HV Monitor |  |
| Veto LLD |  |
| Alpha Counter |  |
| _CPM_Rate |  |
| CZT Counter |  |
| +2.5 Volts monitor |  |
| +5 Volts monitor |  |
| _ROLL_ROT |  |
| _Roll_DEC |  |
| _Roll_RA |  |
| Veto Counter |  |