| Param | Original file | Final file |
|---|---|---|
| Filename | modeM0/AS1C02_017T01_9000000848_06394cztM0_level2.evt | modeM0/AS1C02_017T01_9000000848_06394cztM0_level2_quad_clean.evt |
| Size (bytes) | 456,376,320 | 129,009,600 |
| Size | 435.2 MB | 123.0 MB |
| Events in quadrant A | 3,181,255 | 861,888 |
| Events in quadrant B | 3,405,757 | 877,612 |
| Events in quadrant C | 3,139,347 | 861,954 |
| Events in quadrant D | 3,621,308 | 820,776 |
| Mode SS | |||
|---|---|---|---|
| Quadrant | BADHDUFLAG | Total packets | Discarded packets |
| A | 0 | 142 | 0 |
| B | 0 | 142 | 0 |
| C | 0 | 142 | 0 |
| D | 0 | 142 | 0 |
| Mode M0 | |||
|---|---|---|---|
| Quadrant | BADHDUFLAG | Total packets | Discarded packets |
| A | 0 | 14179 | 3 |
| B | 0 | 14739 | 2 |
| C | 0 | 14195 | 2 |
| D | 0 | 15570 | 2 |
| Mode M9 | |||
|---|---|---|---|
| Quadrant | BADHDUFLAG | Total packets | Discarded packets |
| A | 0 | 21 | 0 |
| B | 0 | 21 | 0 |
| C | 0 | 21 | 0 |
| D | 0 | 21 | 0 |
| Quadrant | Total seconds | Saturated seconds | Saturation percentage |
|---|---|---|---|
| A | 6974 | 46 | 0.659593% |
| B | 6974 | 91 | 1.304847% |
| C | 6974 | 46 | 0.659593% |
| D | 6974 | 109 | 1.562948% |
Noise dominated data is calculated using 1-second bins in cleaned event files. If a bin has >2000 counts, and if more than 50% of those come from <1% of pixels, then it is considered to be noise-dominated and hence unusable.
| Quadrant | # 1 sec bins | Bins with >0 counts | Bins with >2000 counts | High rate bins dominated by noise | Noise dominated (total time) | Noise dominated (detector-on time) | Marked lightcurve |
|---|---|---|---|---|---|---|---|
| A | 9029 | 6976 | 0 | 0 | 0.00% | 0.00% | 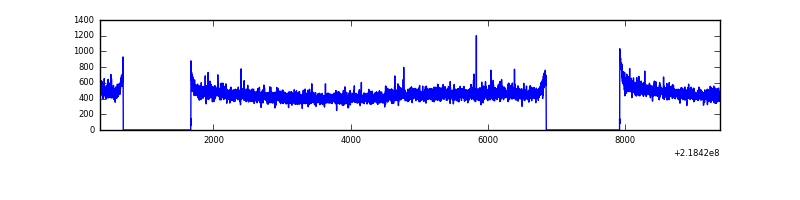 |
| B | 9029 | 6976 | 9 | 9 | 0.10% | 0.13% | 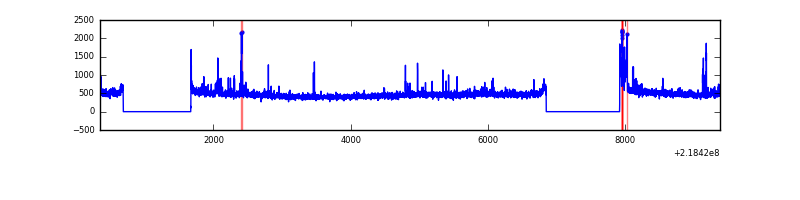 |
| C | 9029 | 6976 | 0 | 0 | 0.00% | 0.00% | 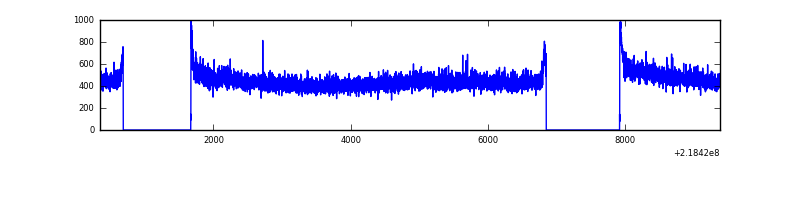 |
| D | 9029 | 6976 | 56 | 56 | 0.62% | 0.80% | 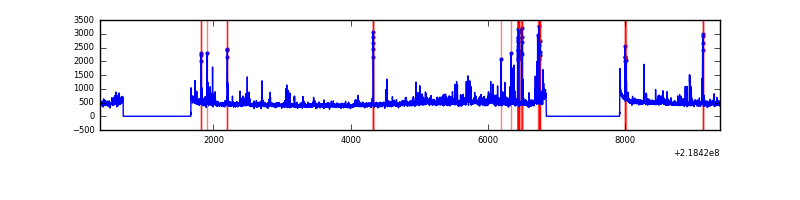 |
Top three noisy pixels from each quadrant. If the there are fewer than three noisy pixels in the level2.evt file, extra rows are filled as -1
| Pixel properties | Quadrant properties | ||||||
|---|---|---|---|---|---|---|---|
| Quadrant | DetID | PixID | Counts | Sigma | Mean | Median | Sigma |
| A | 8 | 15 | 36696 | 220.26 | 810 | 791 | 163.0 |
| A | 3 | 1 | 10997 | 62.61 | 810 | 791 | 163.0 |
| A | 0 | 226 | 7712 | 42.46 | 810 | 791 | 163.0 |
| B | 0 | 228 | 111537 | 714.91 | 822 | 804 | 154.9 |
| B | 4 | 80 | 25247 | 157.81 | 822 | 804 | 154.9 |
| B | 10 | 246 | 23583 | 147.06 | 822 | 804 | 154.9 |
| C | 1 | 16 | 23442 | 122.93 | 797 | 800 | 184.2 |
| C | 13 | 61 | 6438 | 30.61 | 797 | 800 | 184.2 |
| C | 9 | 54 | 3361 | 13.9 | 797 | 800 | 184.2 |
| D | 11 | 241 | 141805 | 734.86 | 787 | 760 | 191.9 |
| D | 13 | 169 | 140982 | 730.57 | 787 | 760 | 191.9 |
| D | 2 | 152 | 107095 | 554.01 | 787 | 760 | 191.9 |
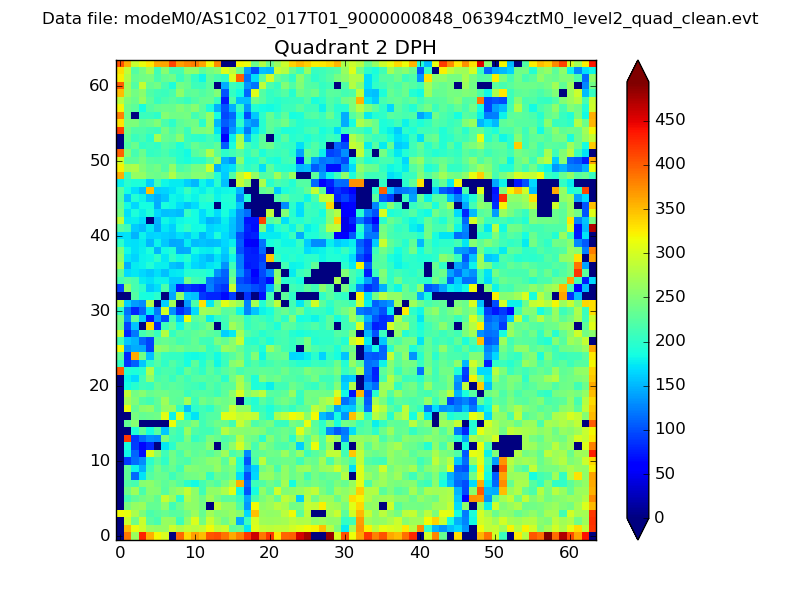
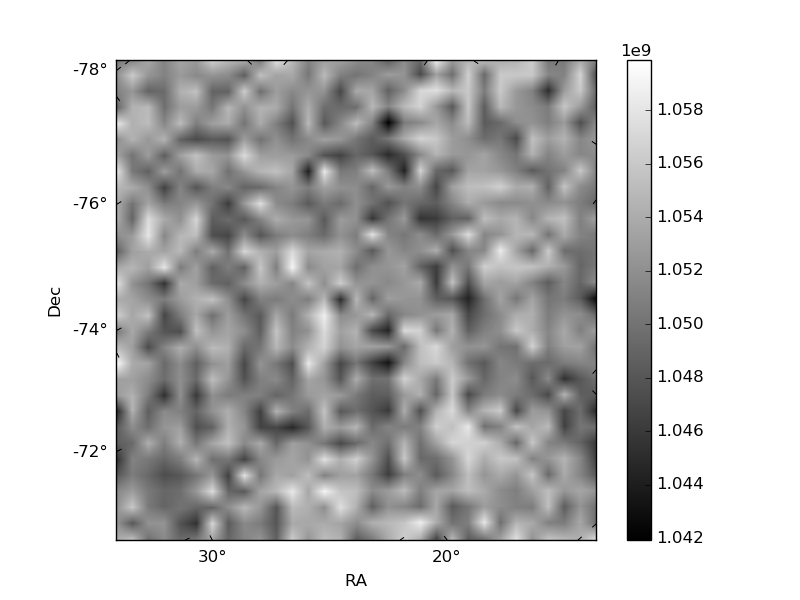
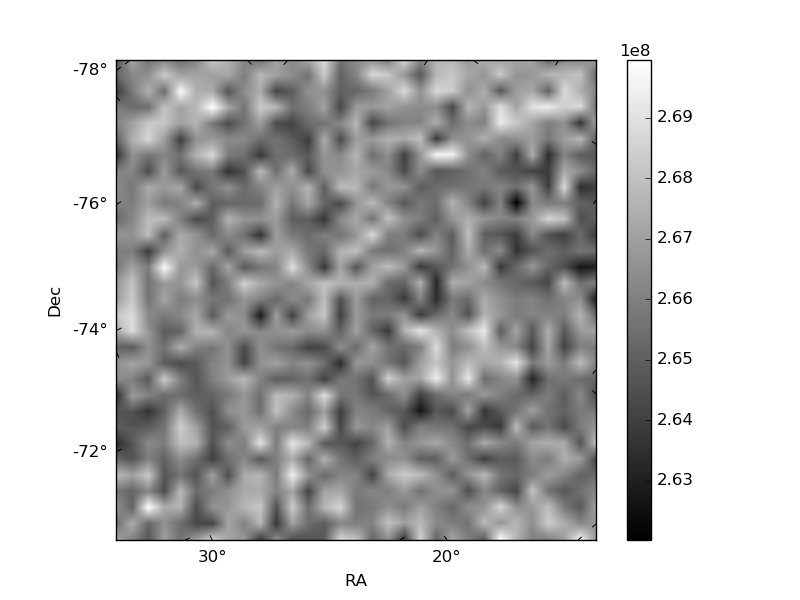
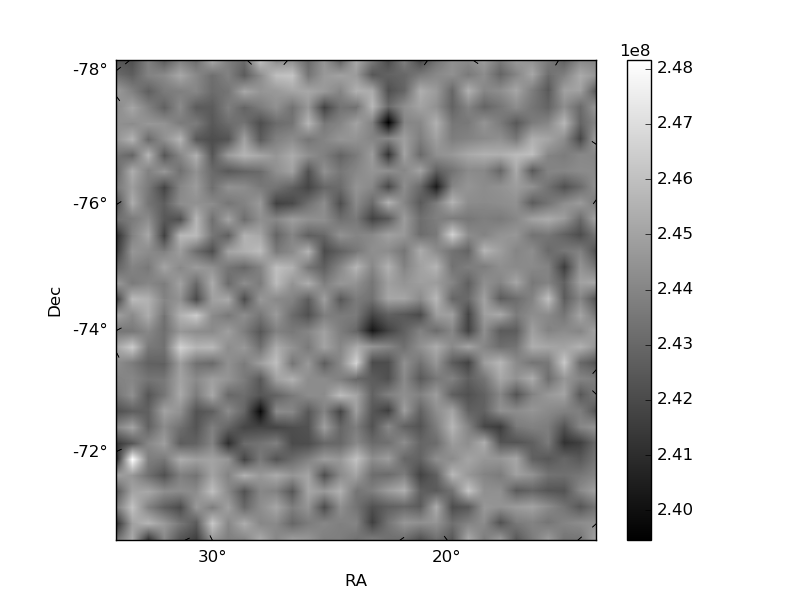
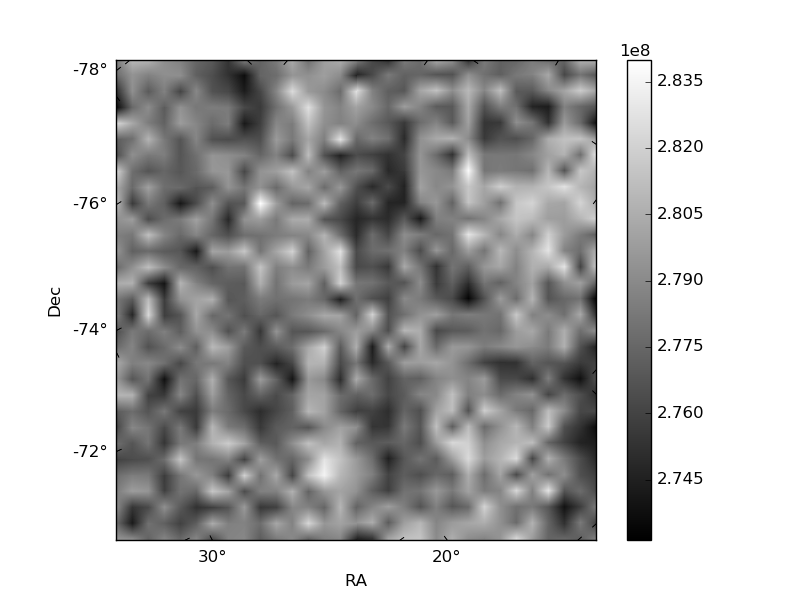
Histogram calculated using DETX and DETY for each event in the final _common_clean file
| Quadrant A | 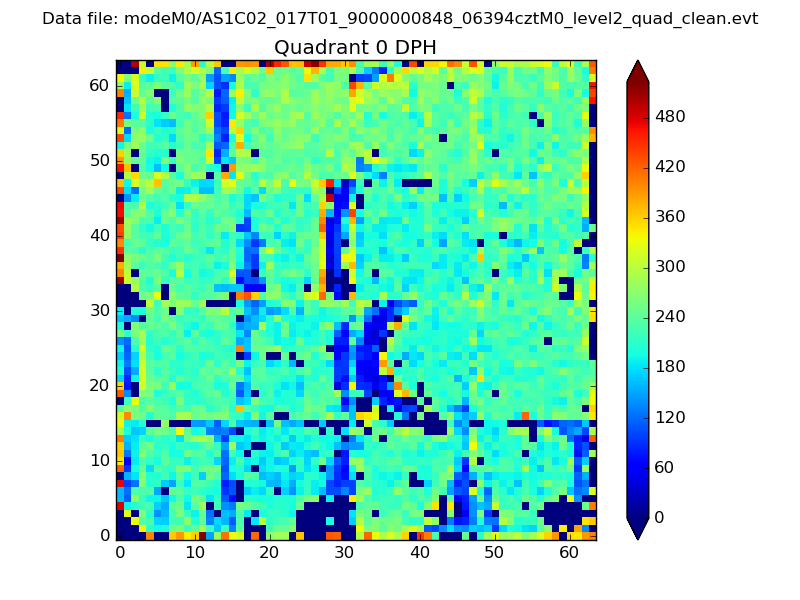 |
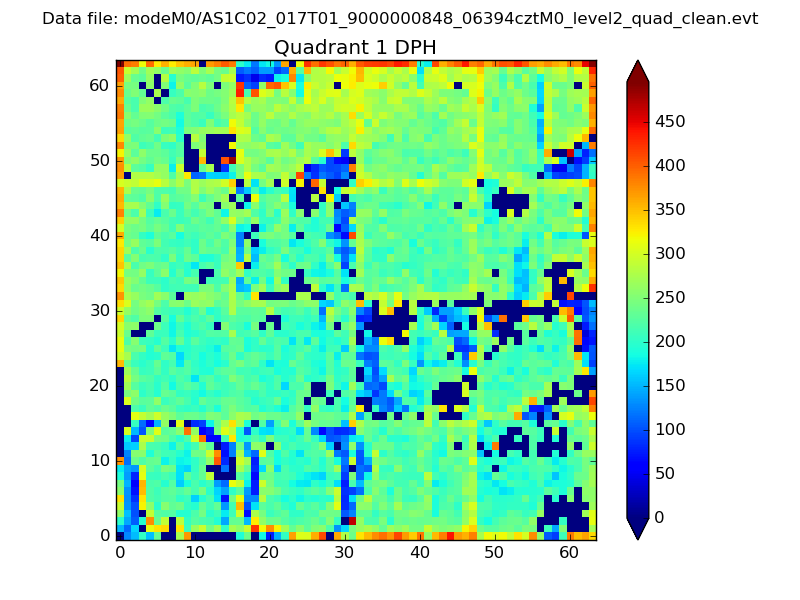 |
Quadrant B |
|---|---|---|---|
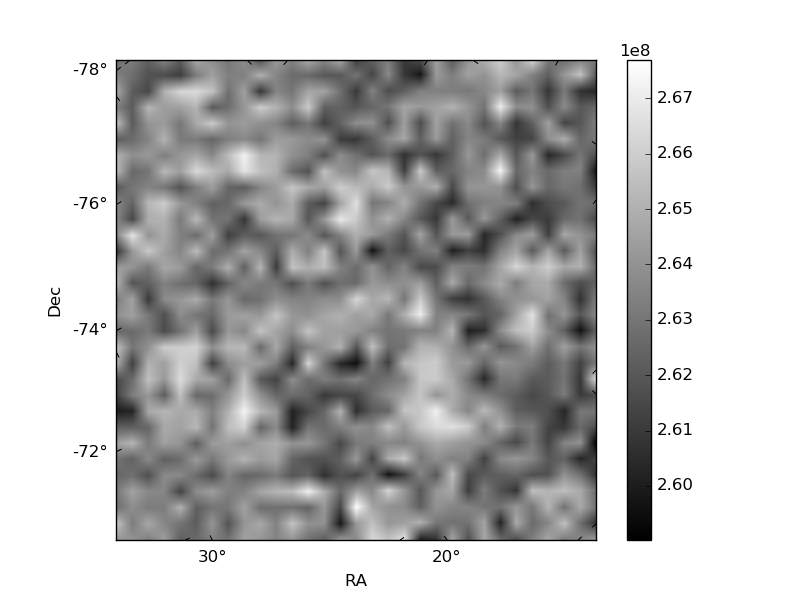
| Quadrant D | 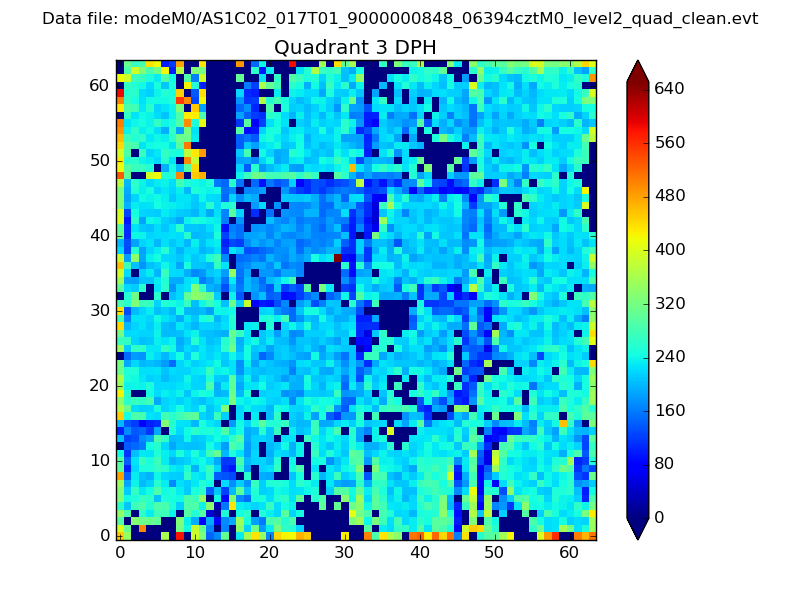 |
 |
Quadrant C |
| Plot type | Count rate plots | Images |
|---|---|---|
| Comparison with Poisson distribution Blue bars denote a histogram of data divided into 1 sec bins. Red curve is a Poisson curve with rate = median count rate of data. |
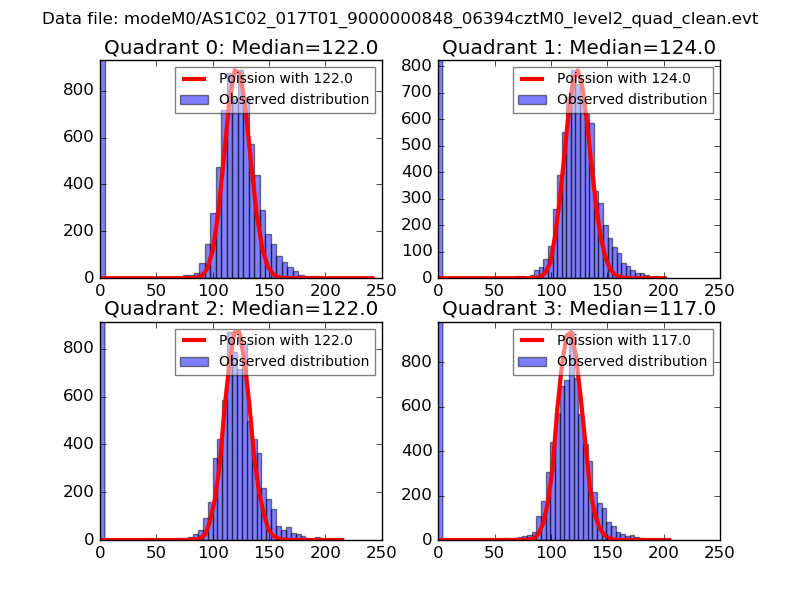 |
 |
| Quadrant-wise count rates Data is divided into 100 sec bins |
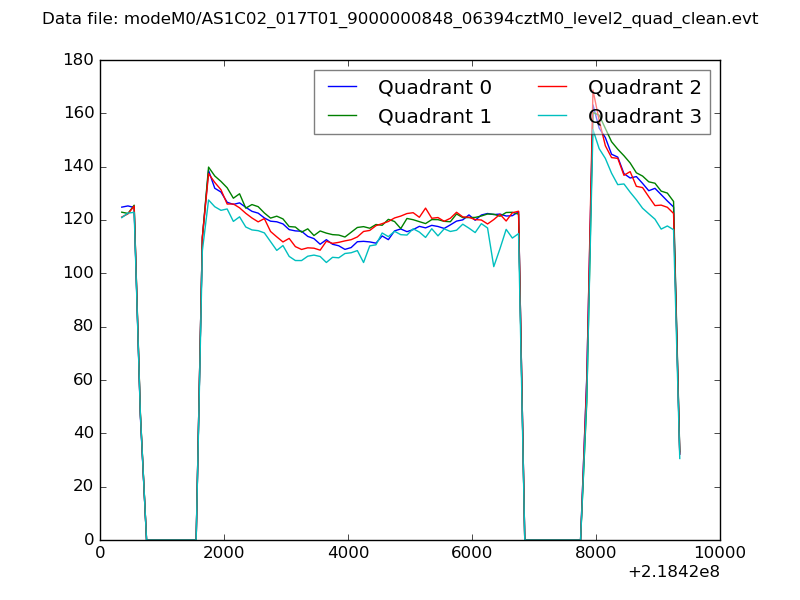 |
|
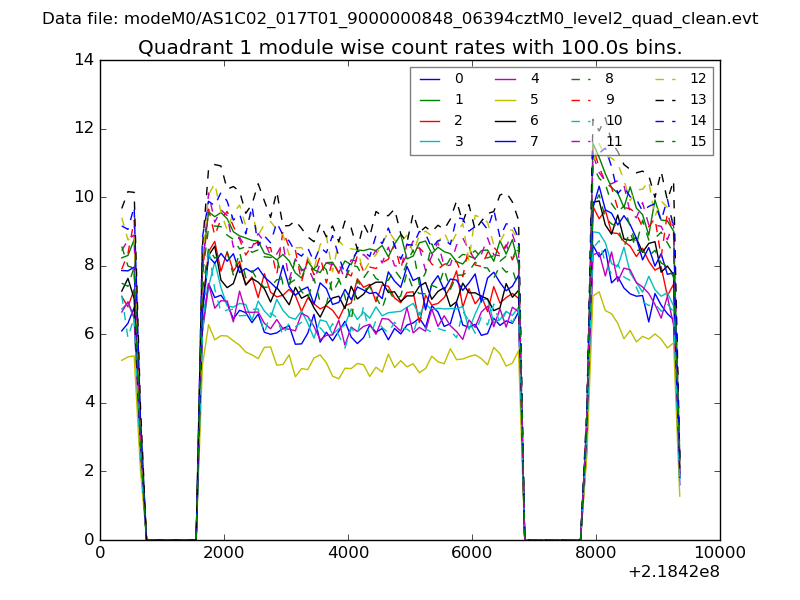
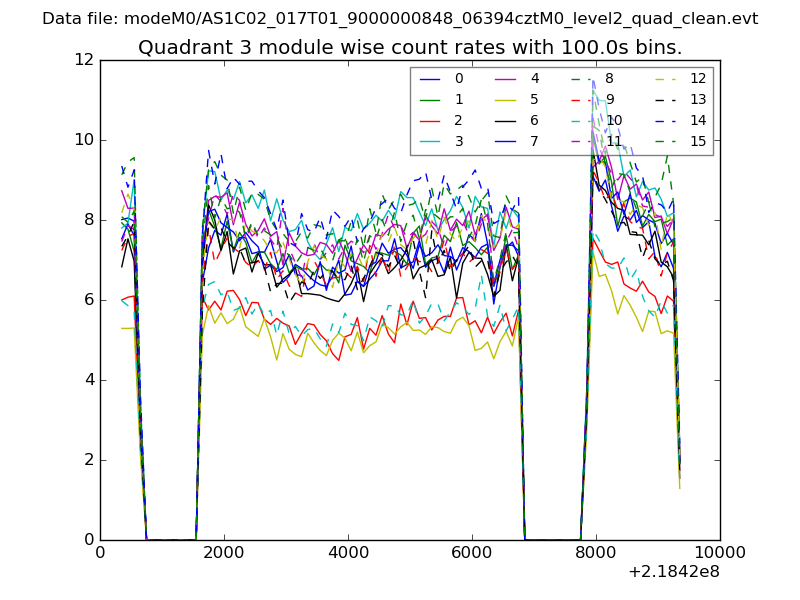
| Module-wise count rates for Quadrant A Data is divided into 100 sec bins |
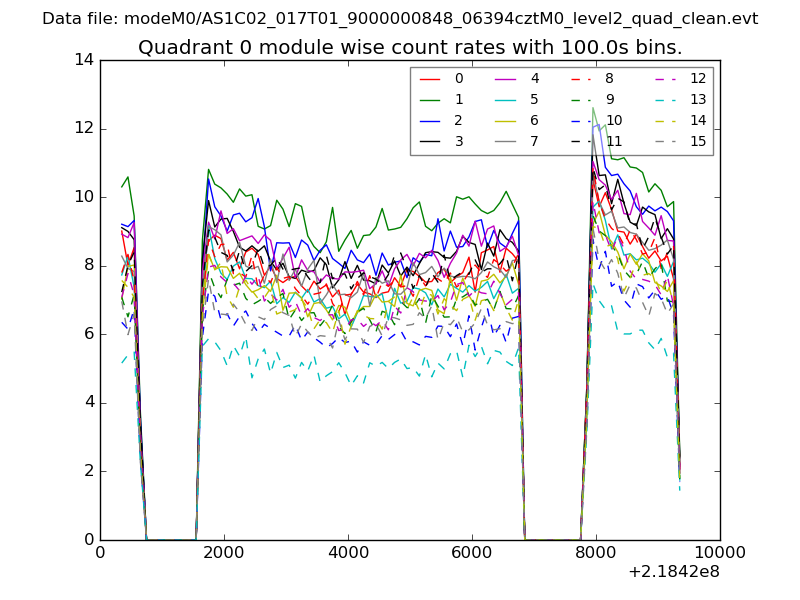 |
 |
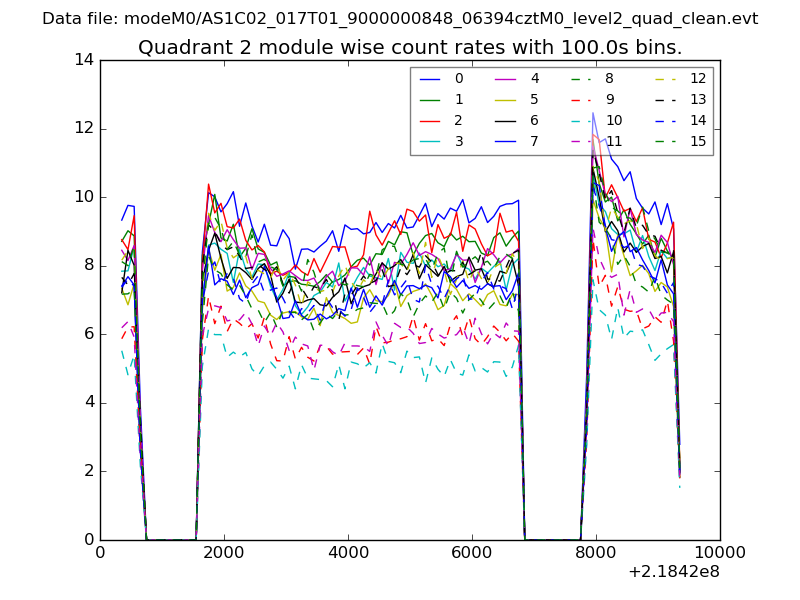
| Module-wise count rates for Quadrant B Data is divided into 100 sec bins |
 |
 |
| Module-wise count rates for Quadrant C Data is divided into 100 sec bins |
 |
 |
| Module-wise count rates for Quadrant D Data is divided into 100 sec bins |
 |
 |
| Parameter | Plot |
|---|---|
| CZT HV Monitor | 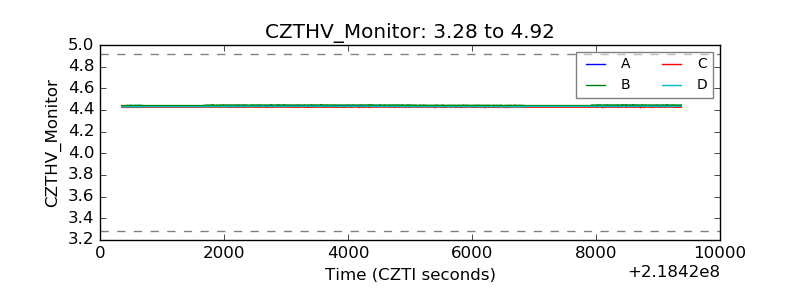 |
| D_VDD | 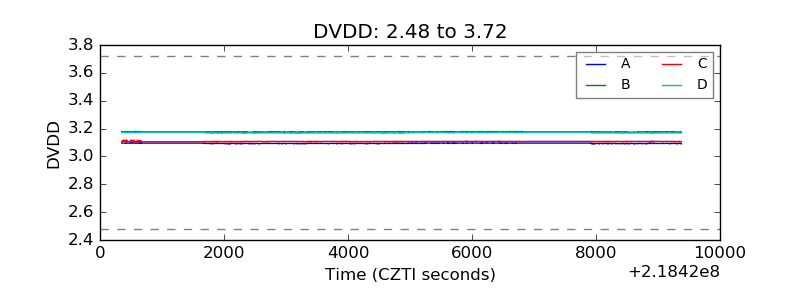 |
| Temperature 1 | 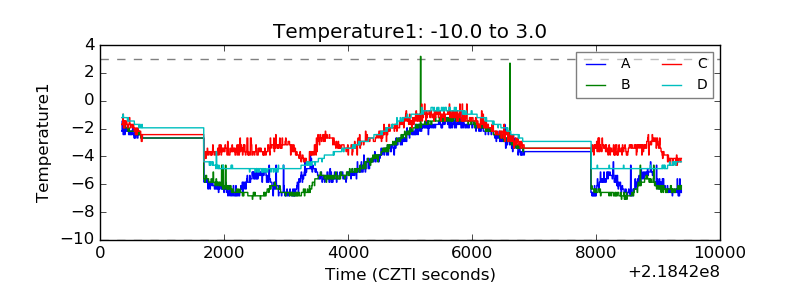 |
| Veto HV Monitor | 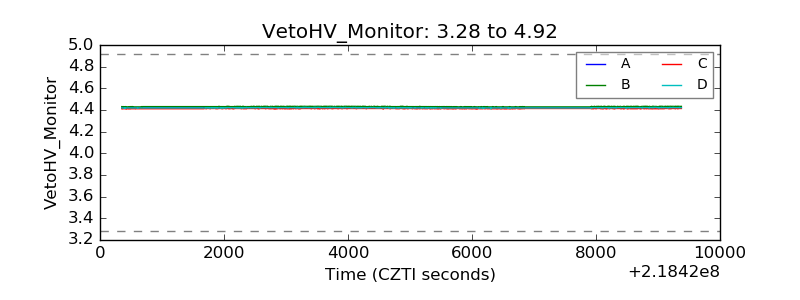 |
| Veto LLD | 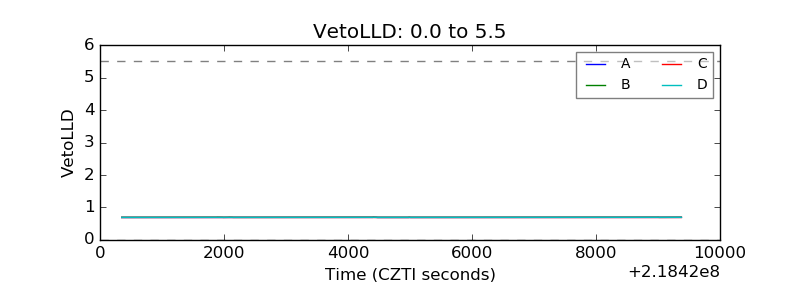 |
| Alpha Counter | 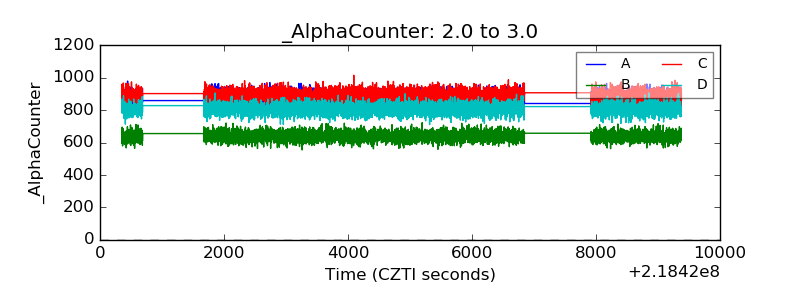 |
| _CPM_Rate | 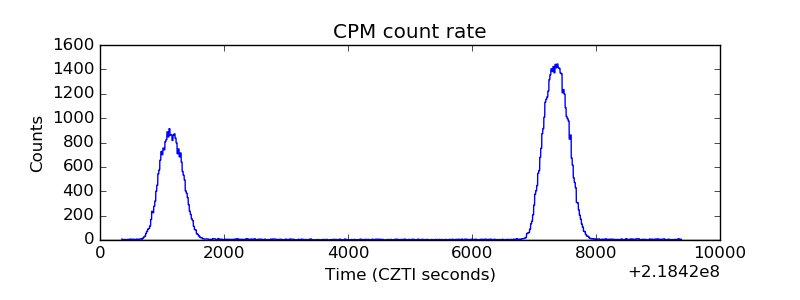 |
| CZT Counter | 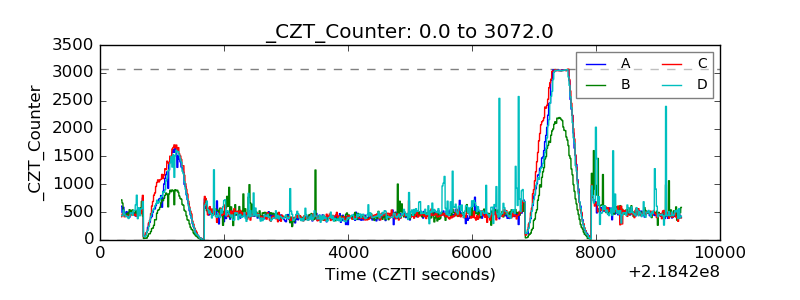 |
| +2.5 Volts monitor |  |
| +5 Volts monitor |  |
| _ROLL_ROT | 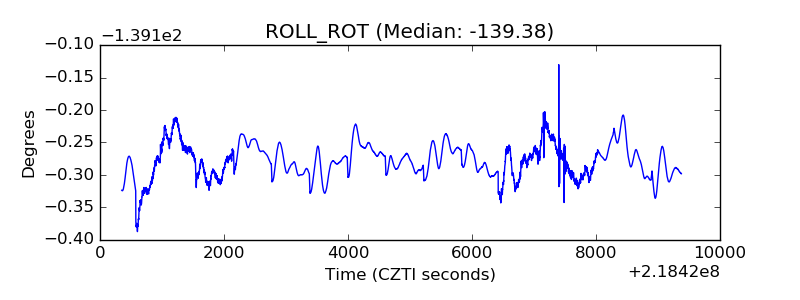 |
| _Roll_DEC | 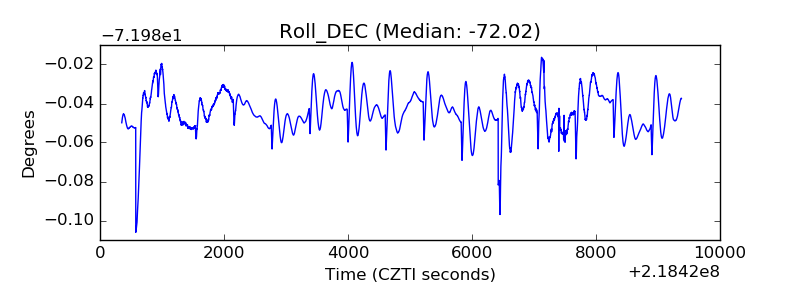 |
| _Roll_RA | 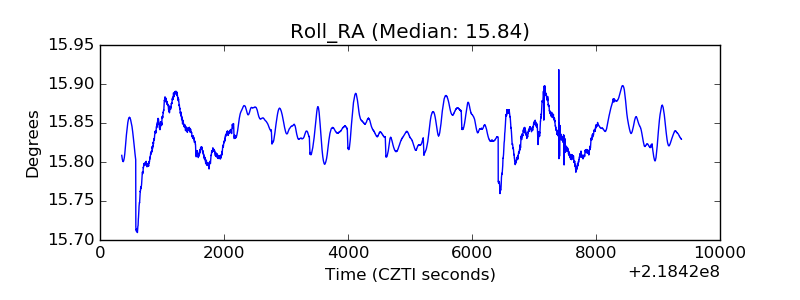 |
| Veto Counter | 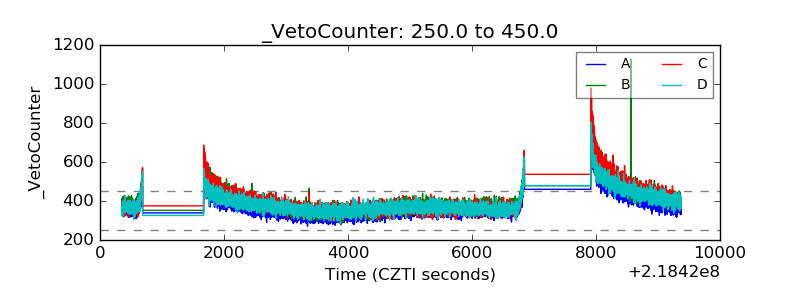 |