| Param | Original file | Final file |
|---|---|---|
| Filename | modeM0/AS1C02_017T01_9000000848_06395cztM0_level2.evt | modeM0/AS1C02_017T01_9000000848_06395cztM0_level2_quad_clean.evt |
| Size (bytes) | 425,194,560 | 120,697,920 |
| Size | 405.5 MB | 115.1 MB |
| Events in quadrant A | 2,909,036 | 809,335 |
| Events in quadrant B | 3,172,282 | 826,840 |
| Events in quadrant C | 2,877,102 | 815,435 |
| Events in quadrant D | 3,496,158 | 770,513 |
| Mode SS | |||
|---|---|---|---|
| Quadrant | BADHDUFLAG | Total packets | Discarded packets |
| A | 0 | 126 | 0 |
| B | 0 | 126 | 0 |
| C | 0 | 126 | 0 |
| D | 0 | 126 | 0 |
| Mode M0 | |||
|---|---|---|---|
| Quadrant | BADHDUFLAG | Total packets | Discarded packets |
| A | 0 | 12720 | 2 |
| B | 0 | 13313 | 1 |
| C | 0 | 12751 | 1 |
| D | 0 | 14436 | 1 |
| Mode M9 | |||
|---|---|---|---|
| Quadrant | BADHDUFLAG | Total packets | Discarded packets |
| A | 0 | 11 | 0 |
| B | 0 | 11 | 0 |
| C | 0 | 11 | 0 |
| D | 0 | 11 | 0 |
| Quadrant | Total seconds | Saturated seconds | Saturation percentage |
|---|---|---|---|
| A | 6214 | 56 | 0.901191% |
| B | 6214 | 86 | 1.383972% |
| C | 6214 | 59 | 0.949469% |
| D | 6214 | 81 | 1.303508% |
Noise dominated data is calculated using 1-second bins in cleaned event files. If a bin has >2000 counts, and if more than 50% of those come from <1% of pixels, then it is considered to be noise-dominated and hence unusable.
| Quadrant | # 1 sec bins | Bins with >0 counts | Bins with >2000 counts | High rate bins dominated by noise | Noise dominated (total time) | Noise dominated (detector-on time) | Marked lightcurve |
|---|---|---|---|---|---|---|---|
| A | 7379 | 6215 | 0 | 0 | 0.00% | 0.00% | 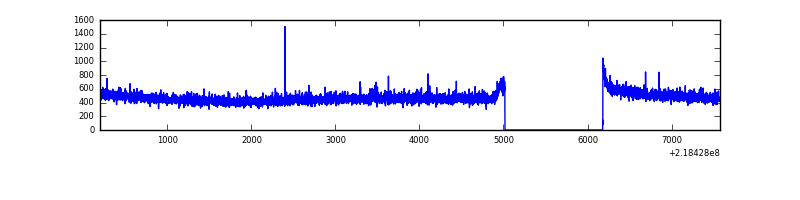 |
| B | 7379 | 6215 | 6 | 6 | 0.08% | 0.10% | 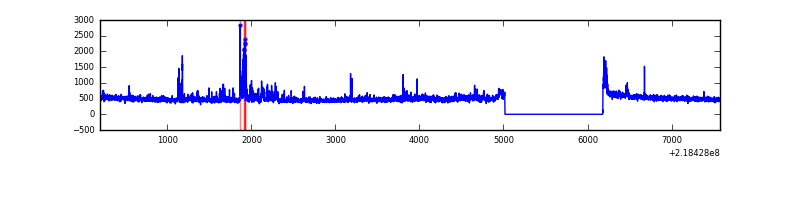 |
| C | 7379 | 6215 | 0 | 0 | 0.00% | 0.00% | 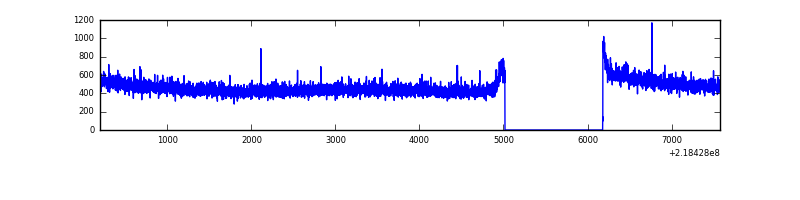 |
| D | 7379 | 6215 | 27 | 27 | 0.37% | 0.43% | 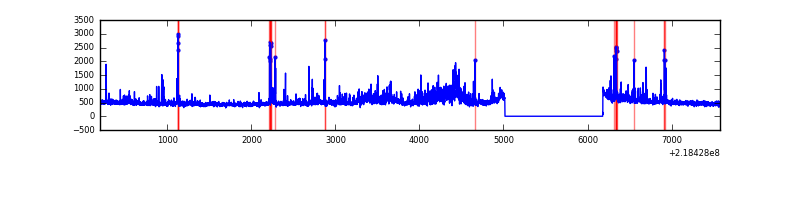 |
Top three noisy pixels from each quadrant. If the there are fewer than three noisy pixels in the level2.evt file, extra rows are filled as -1
| Pixel properties | Quadrant properties | ||||||
|---|---|---|---|---|---|---|---|
| Quadrant | DetID | PixID | Counts | Sigma | Mean | Median | Sigma |
| A | 8 | 15 | 31935 | 210.27 | 742 | 727 | 148.4 |
| A | 3 | 1 | 8877 | 54.91 | 742 | 727 | 148.4 |
| A | 0 | 226 | 7124 | 43.1 | 742 | 727 | 148.4 |
| B | 0 | 228 | 161897 | 1153.25 | 750 | 732 | 139.7 |
| B | 4 | 81 | 45035 | 317.02 | 750 | 732 | 139.7 |
| B | 4 | 170 | 15311 | 104.32 | 750 | 732 | 139.7 |
| C | 13 | 61 | 5913 | 31.06 | 733 | 736 | 166.7 |
| C | 8 | 128 | 5413 | 28.06 | 733 | 736 | 166.7 |
| C | 1 | 16 | 3017 | 13.68 | 733 | 736 | 166.7 |
| D | 13 | 105 | 250137 | 1411.28 | 726 | 702 | 176.7 |
| D | 11 | 241 | 135592 | 763.19 | 726 | 702 | 176.7 |
| D | 2 | 152 | 135288 | 761.47 | 726 | 702 | 176.7 |
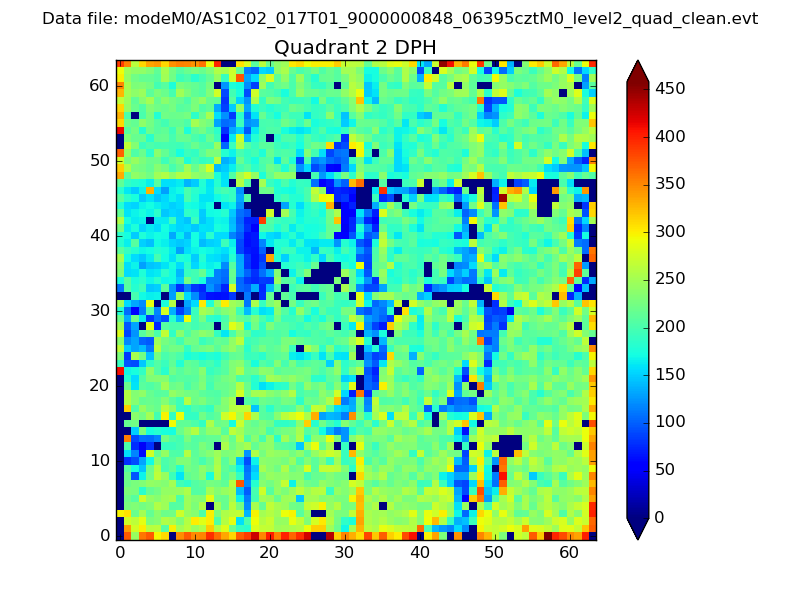
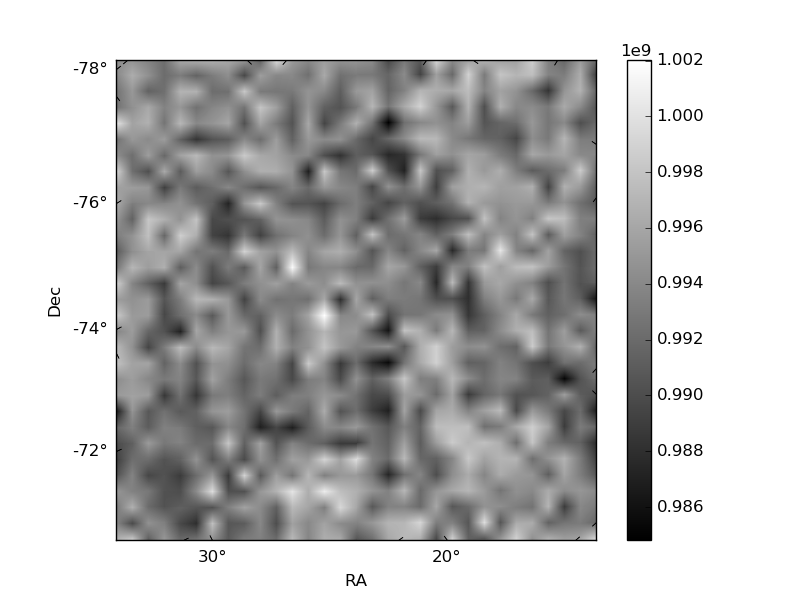
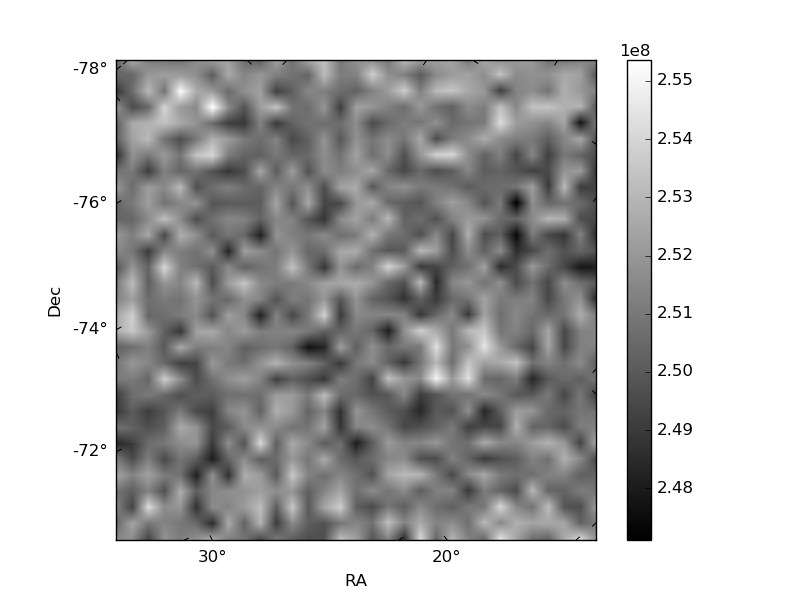
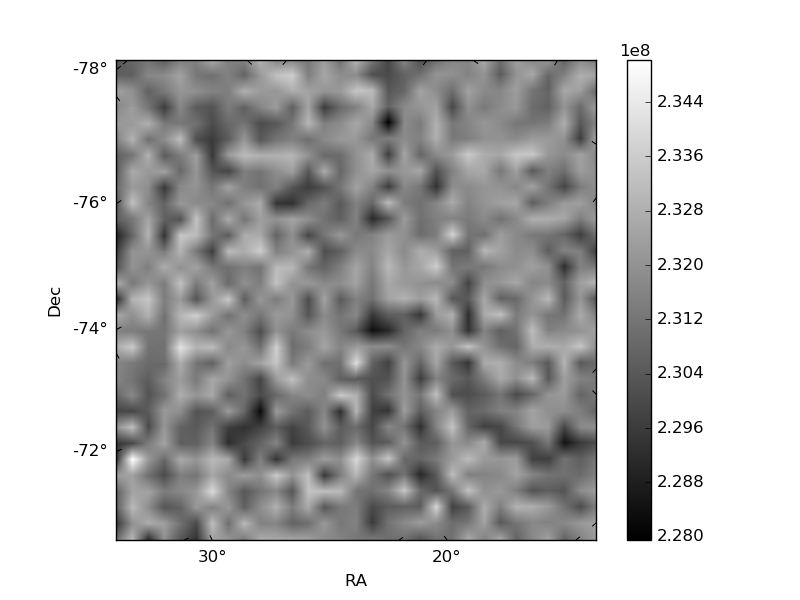
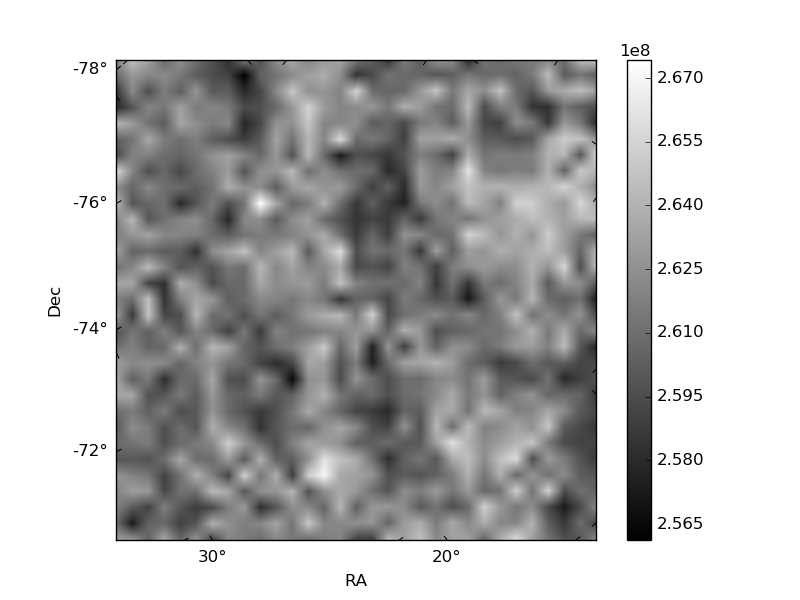
Histogram calculated using DETX and DETY for each event in the final _common_clean file
| Quadrant A | 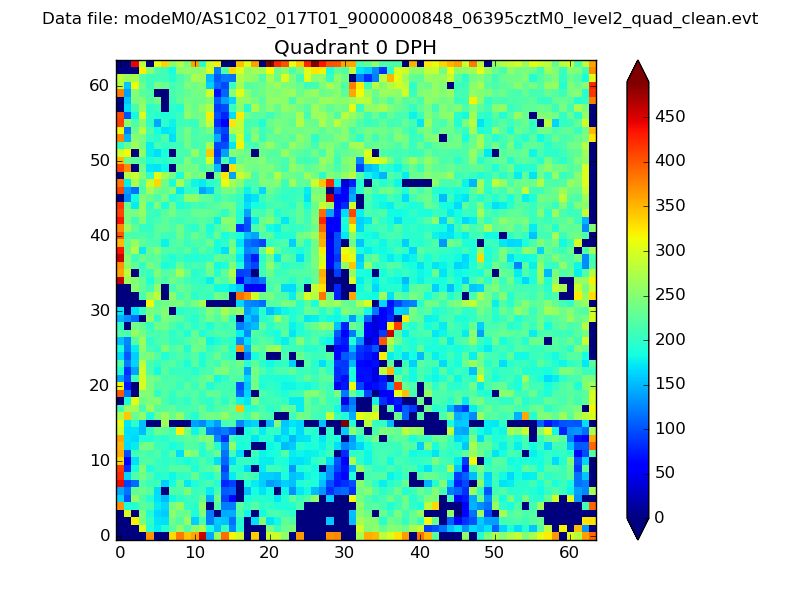 |
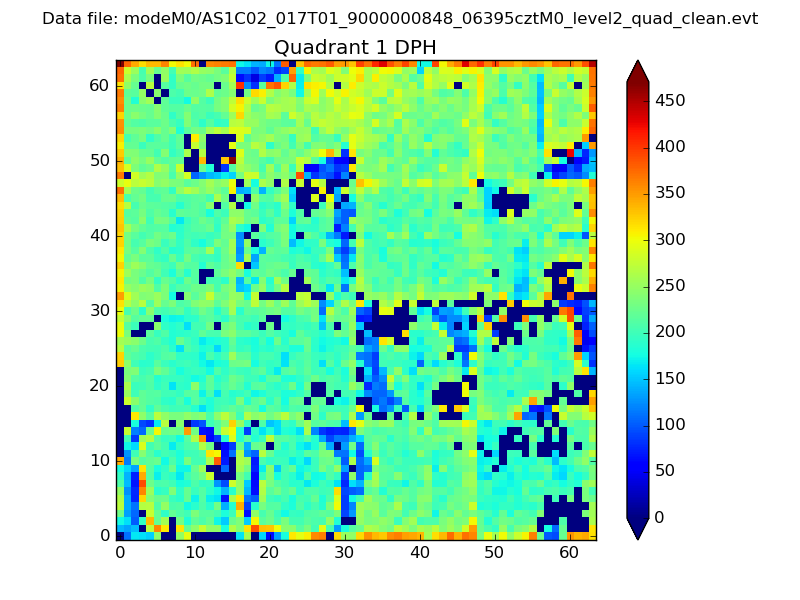 |
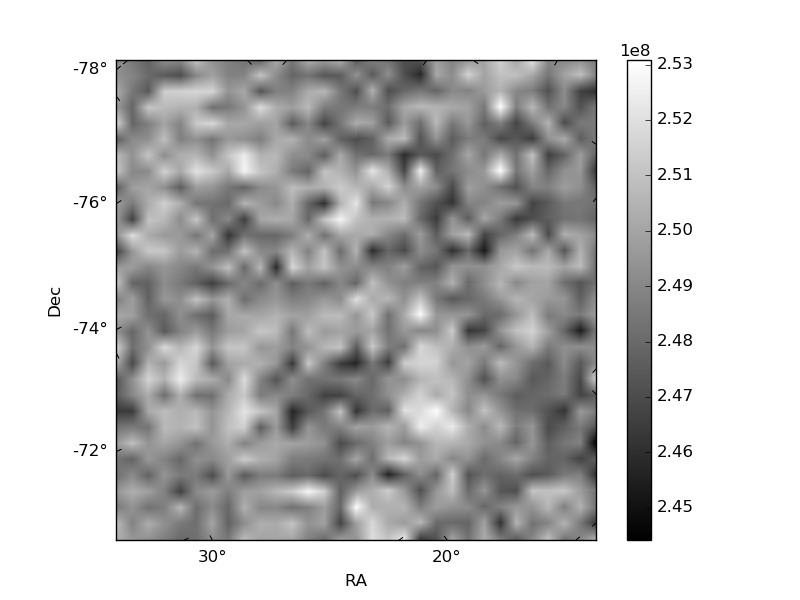
Quadrant B |
|---|---|---|---|
| Quadrant D | 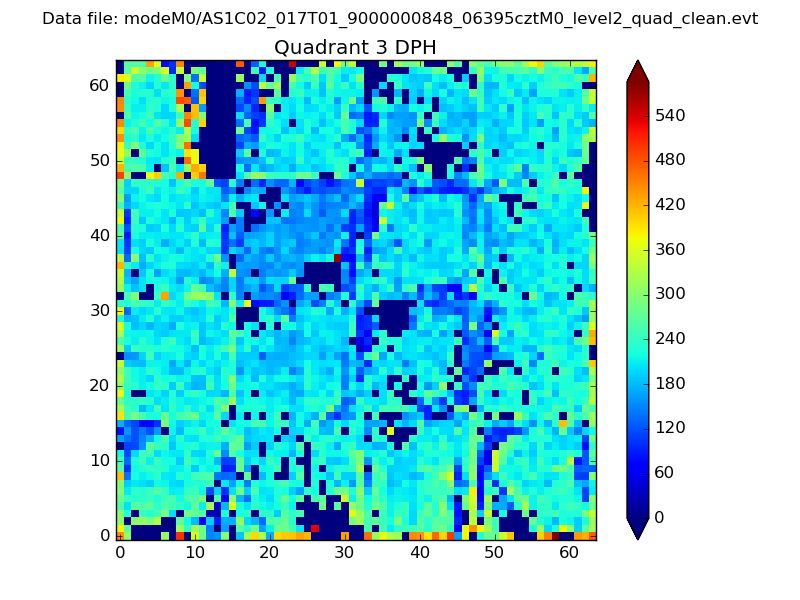 |
 |
Quadrant C |
| Plot type | Count rate plots | Images |
|---|---|---|
| Comparison with Poisson distribution Blue bars denote a histogram of data divided into 1 sec bins. Red curve is a Poisson curve with rate = median count rate of data. |
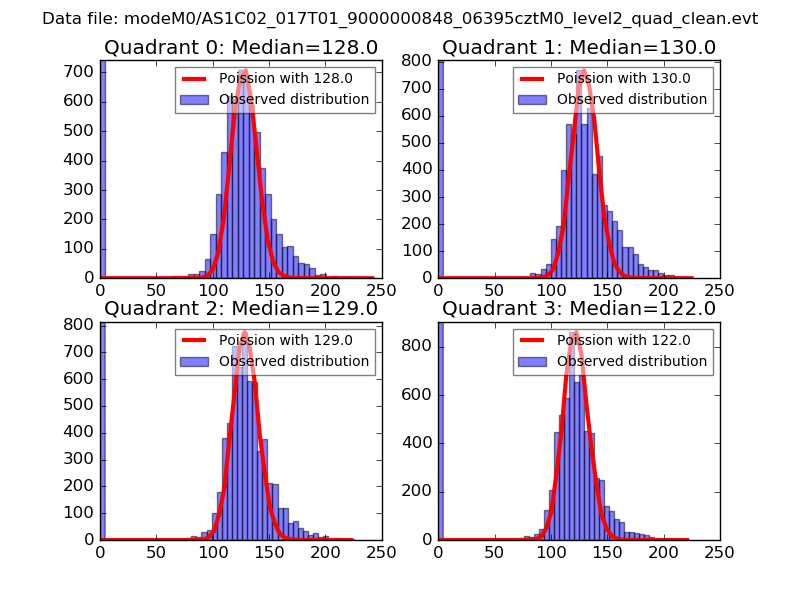 |
 |
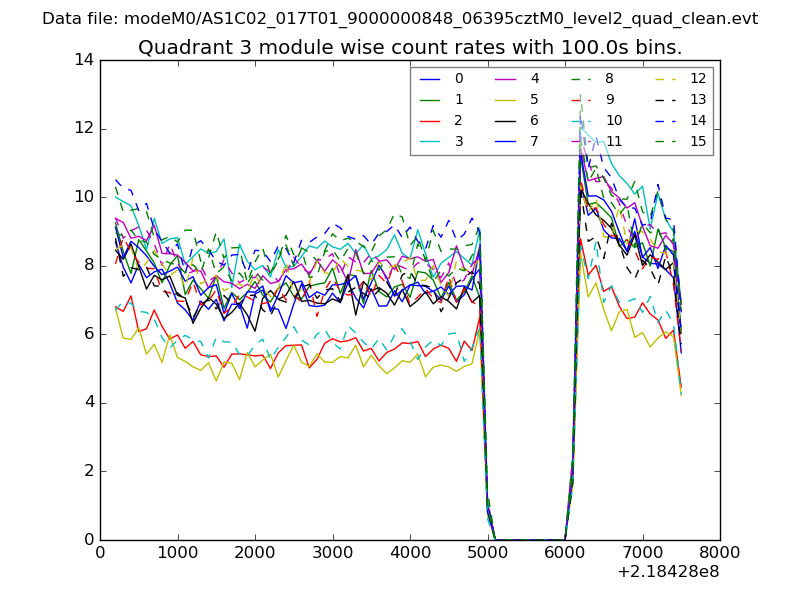
| Quadrant-wise count rates Data is divided into 100 sec bins |
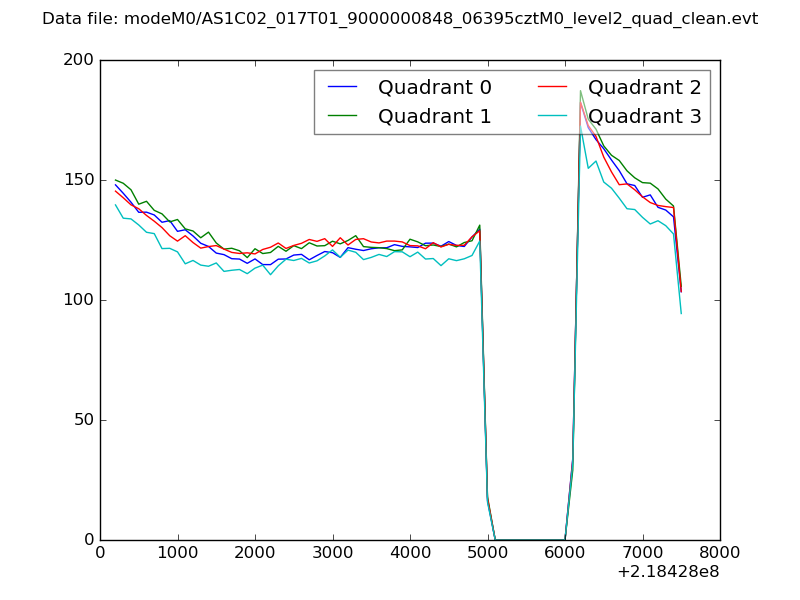 |
|
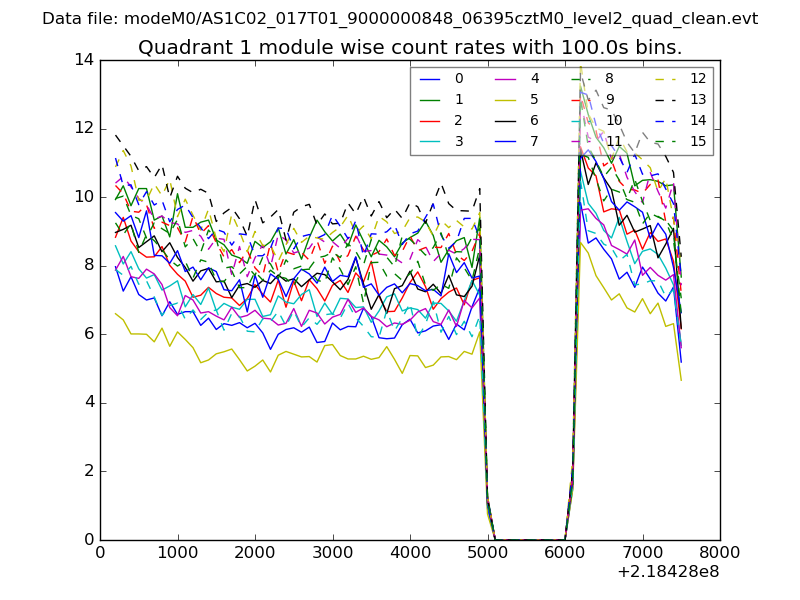
| Module-wise count rates for Quadrant A Data is divided into 100 sec bins |
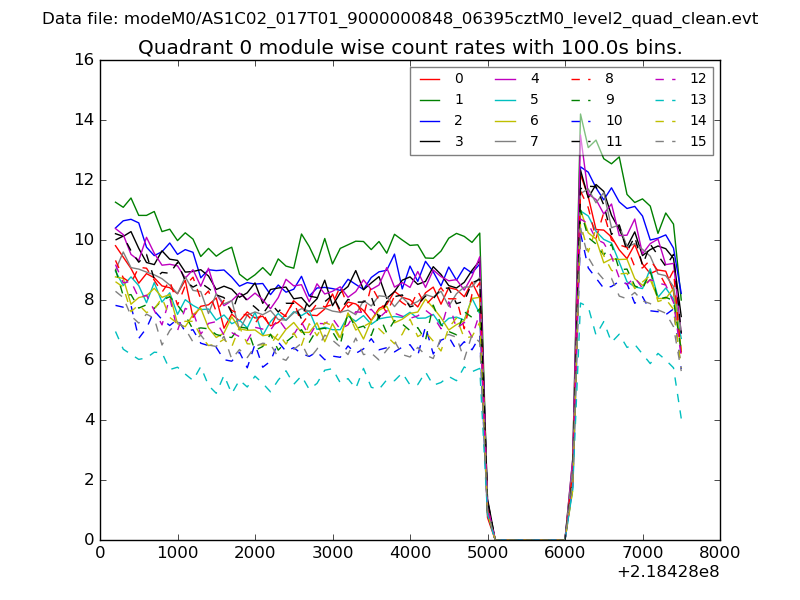 |
 |
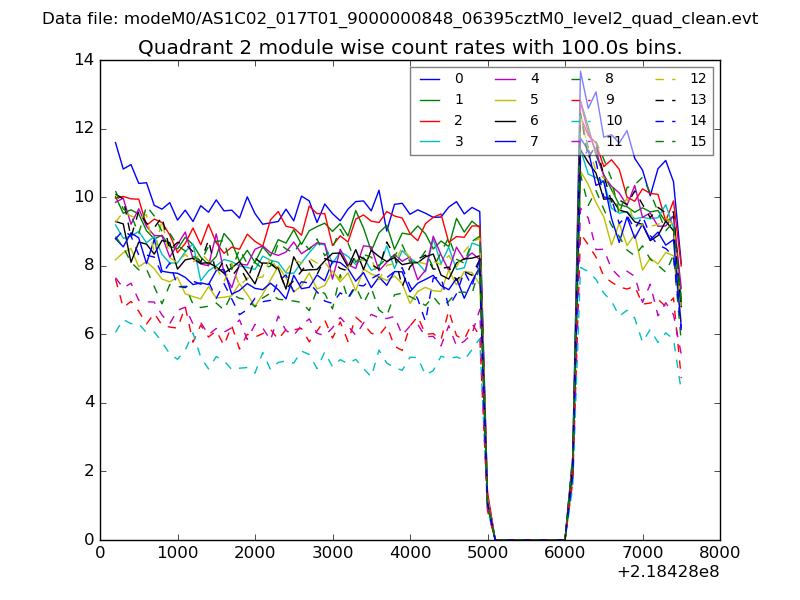
| Module-wise count rates for Quadrant B Data is divided into 100 sec bins |
 |
 |
| Module-wise count rates for Quadrant C Data is divided into 100 sec bins |
 |
 |
| Module-wise count rates for Quadrant D Data is divided into 100 sec bins |
 |
 |
| Parameter | Plot |
|---|---|
| CZT HV Monitor | 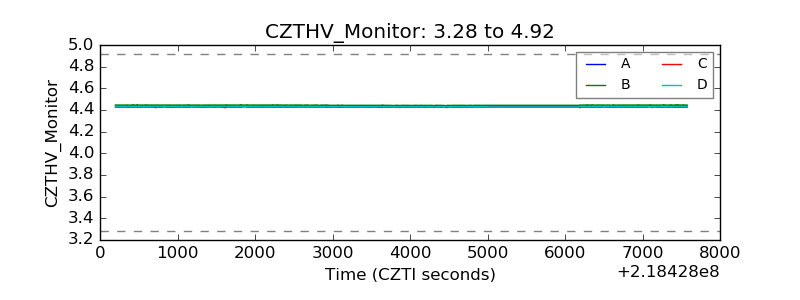 |
| D_VDD |  |
| Temperature 1 | 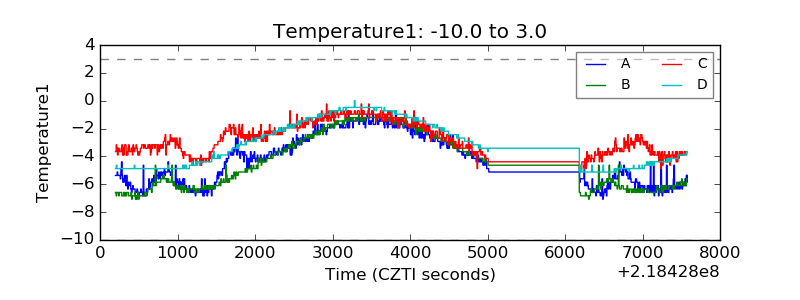 |
| Veto HV Monitor | 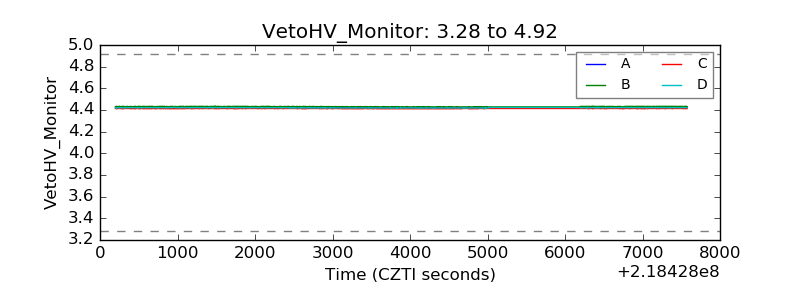 |
| Veto LLD | 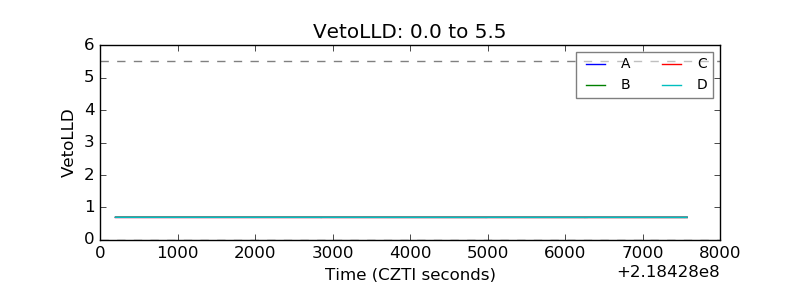 |
| Alpha Counter | 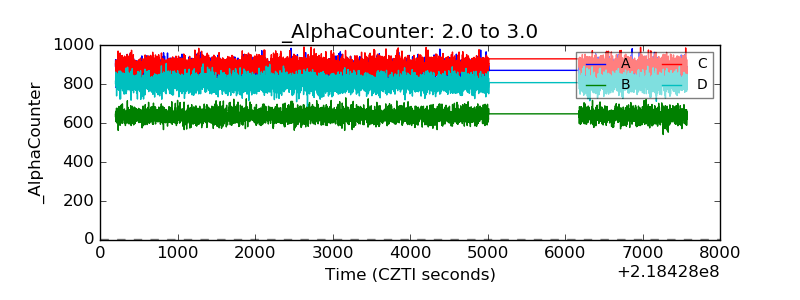 |
| _CPM_Rate | 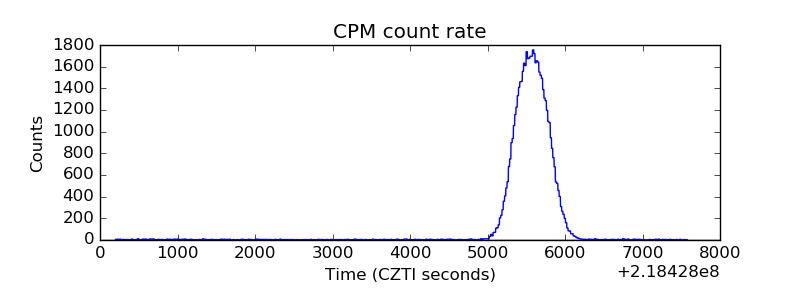 |
| CZT Counter | 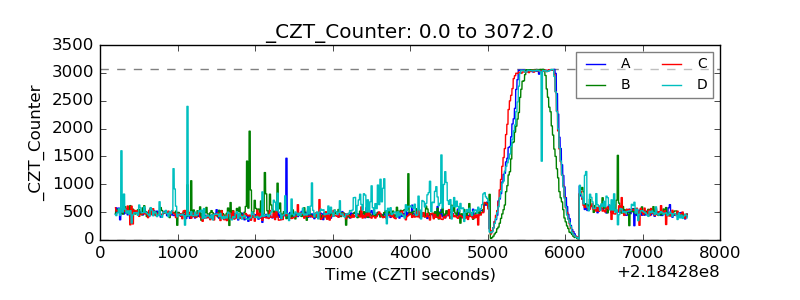 |
| +2.5 Volts monitor |  |
| +5 Volts monitor |  |
| _ROLL_ROT | 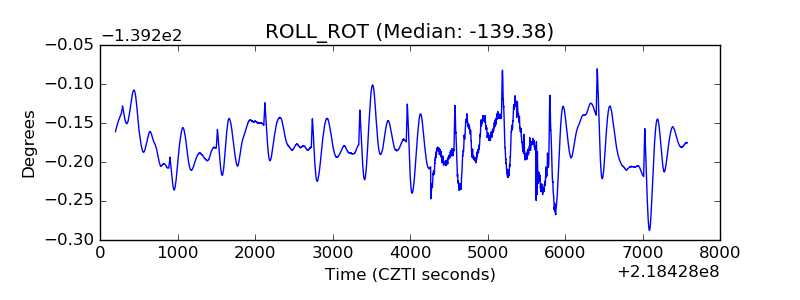 |
| _Roll_DEC | 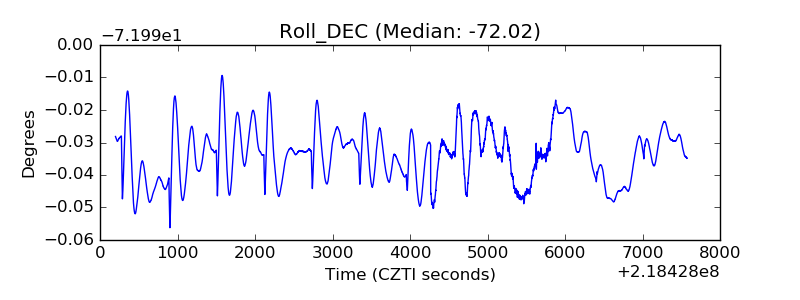 |
| _Roll_RA | 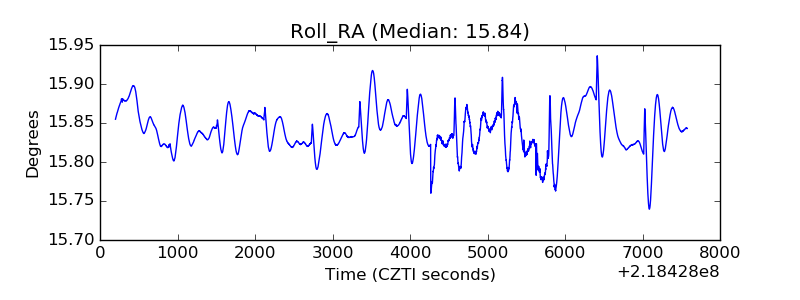 |
| Veto Counter | 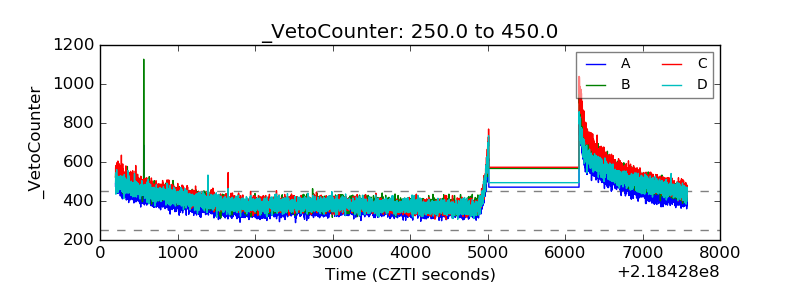 |