| Param | Original file | Final file |
|---|---|---|
| Filename | modeM0/AS1C02_017T01_9000000848_06398cztM0_level2.evt | modeM0/AS1C02_017T01_9000000848_06398cztM0_level2_quad_clean.evt |
| Size (bytes) | 278,925,120 | 84,072,960 |
| Size | 266.0 MB | 80.2 MB |
| Events in quadrant A | 2,001,975 | 564,362 |
| Events in quadrant B | 2,115,108 | 573,446 |
| Events in quadrant C | 1,902,974 | 569,708 |
| Events in quadrant D | 2,140,247 | 542,755 |
| Mode SS | |||
|---|---|---|---|
| Quadrant | BADHDUFLAG | Total packets | Discarded packets |
| A | 0 | 84 | 0 |
| B | 0 | 84 | 0 |
| C | 0 | 84 | 0 |
| D | 0 | 84 | 0 |
| Mode M0 | |||
|---|---|---|---|
| Quadrant | BADHDUFLAG | Total packets | Discarded packets |
| A | 0 | 8526 | 0 |
| B | 0 | 8891 | 0 |
| C | 0 | 8527 | 0 |
| D | 0 | 9124 | 0 |
| Quadrant | Total seconds | Saturated seconds | Saturation percentage |
|---|---|---|---|
| A | 4201 | 4 | 0.095215% |
| B | 4201 | 6 | 0.142823% |
| C | 4201 | 3 | 0.071412% |
| D | 4201 | 29 | 0.690312% |
Noise dominated data is calculated using 1-second bins in cleaned event files. If a bin has >2000 counts, and if more than 50% of those come from <1% of pixels, then it is considered to be noise-dominated and hence unusable.
| Quadrant | # 1 sec bins | Bins with >0 counts | Bins with >2000 counts | High rate bins dominated by noise | Noise dominated (total time) | Noise dominated (detector-on time) | Marked lightcurve |
|---|---|---|---|---|---|---|---|
| A | 4201 | 4201 | 0 | 0 | 0.00% | 0.00% | 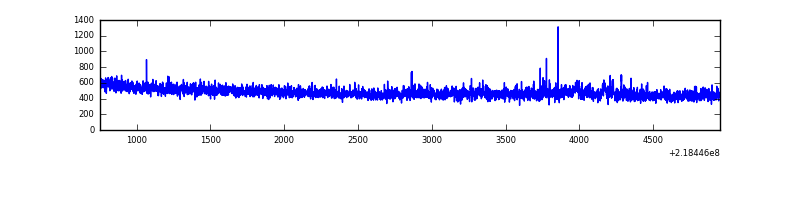 |
| B | 4201 | 4201 | 2 | 2 | 0.05% | 0.05% | 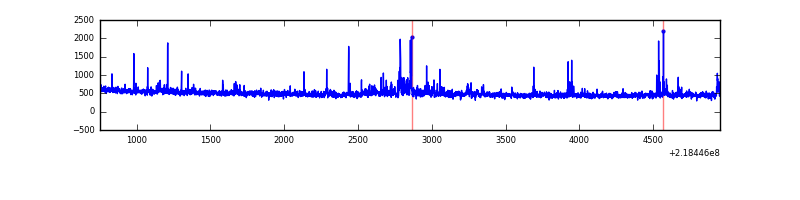 |
| C | 4201 | 4201 | 0 | 0 | 0.00% | 0.00% | 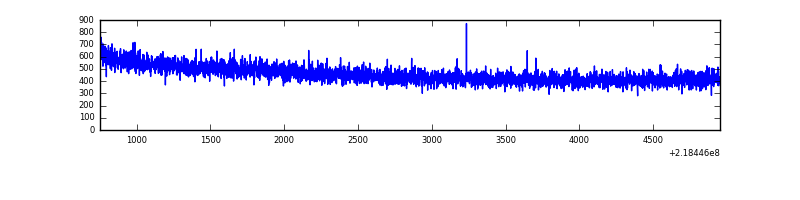 |
| D | 4201 | 4201 | 24 | 24 | 0.57% | 0.57% | 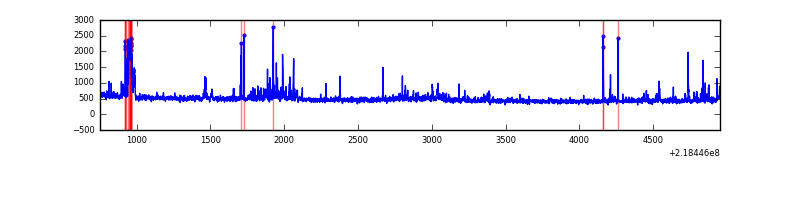 |
Top three noisy pixels from each quadrant. If the there are fewer than three noisy pixels in the level2.evt file, extra rows are filled as -1
| Pixel properties | Quadrant properties | ||||||
|---|---|---|---|---|---|---|---|
| Quadrant | DetID | PixID | Counts | Sigma | Mean | Median | Sigma |
| A | 8 | 15 | 47258 | 460.72 | 502 | 493 | 101.5 |
| A | 15 | 174 | 15133 | 144.23 | 502 | 493 | 101.5 |
| A | 15 | 234 | 6657 | 60.73 | 502 | 493 | 101.5 |
| B | 4 | 81 | 55226 | 579.76 | 502 | 491 | 94.4 |
| B | 15 | 204 | 32795 | 342.17 | 502 | 491 | 94.4 |
| B | 10 | 246 | 25760 | 267.65 | 502 | 491 | 94.4 |
| C | 1 | 16 | 5783 | 47.8 | 486 | 488 | 110.8 |
| C | 13 | 61 | 3957 | 31.32 | 486 | 488 | 110.8 |
| C | 3 | 202 | 1276 | 7.11 | 486 | 488 | 110.8 |
| D | 2 | 152 | 143900 | 1207.55 | 486 | 472 | 118.8 |
| D | 11 | 241 | 56911 | 475.17 | 486 | 472 | 118.8 |
| D | 13 | 172 | 18172 | 149.02 | 486 | 472 | 118.8 |
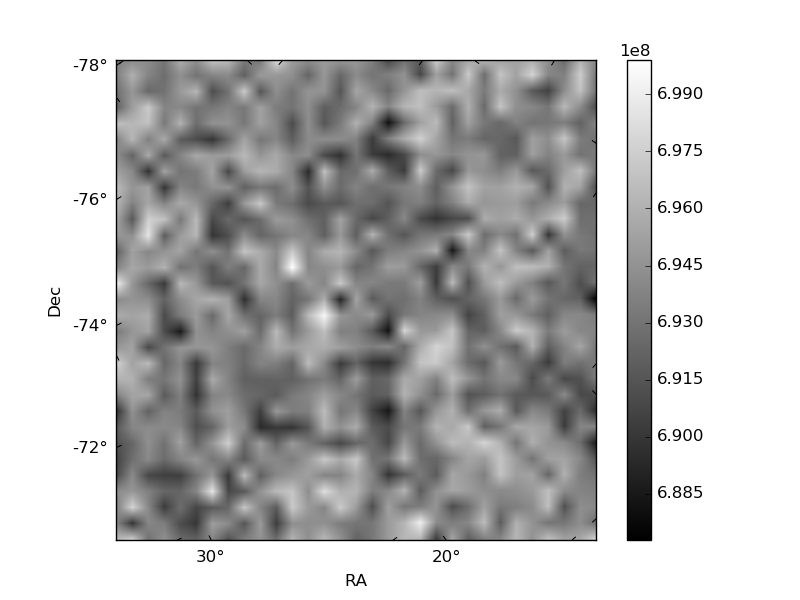
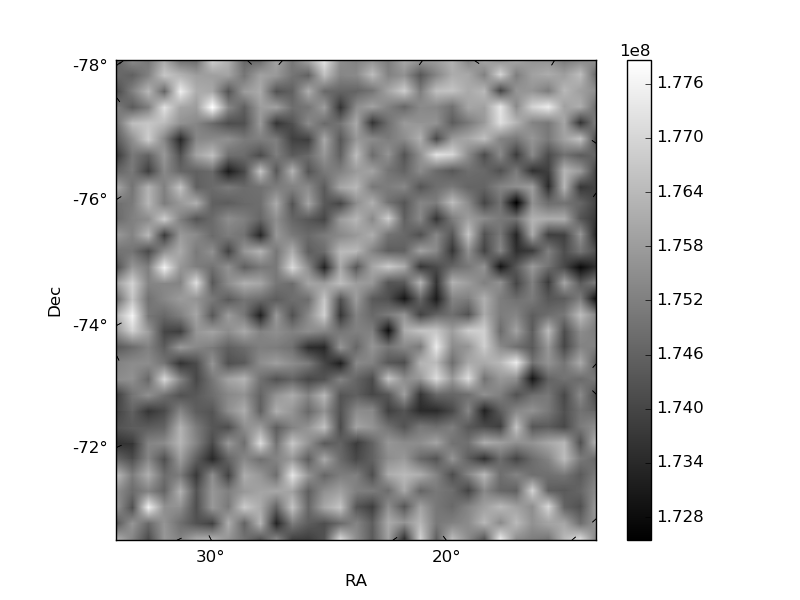
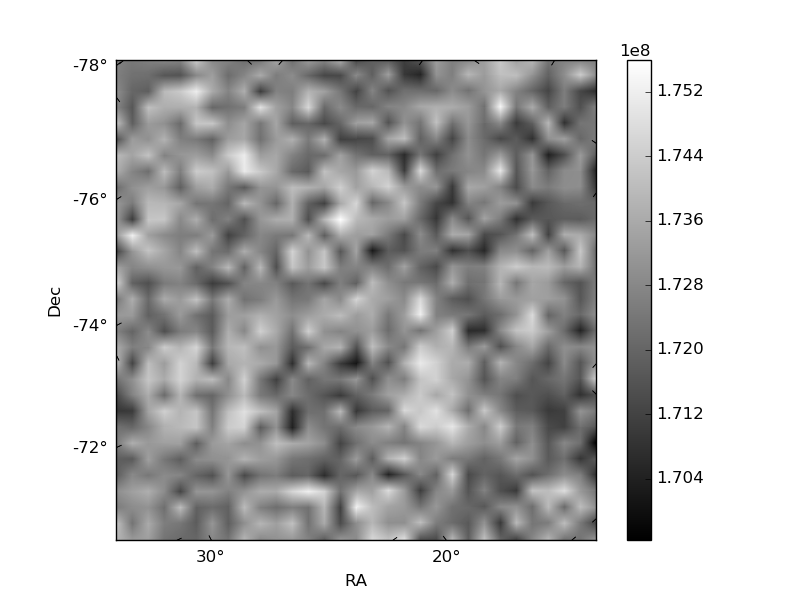
Histogram calculated using DETX and DETY for each event in the final _common_clean file
| Quadrant A | 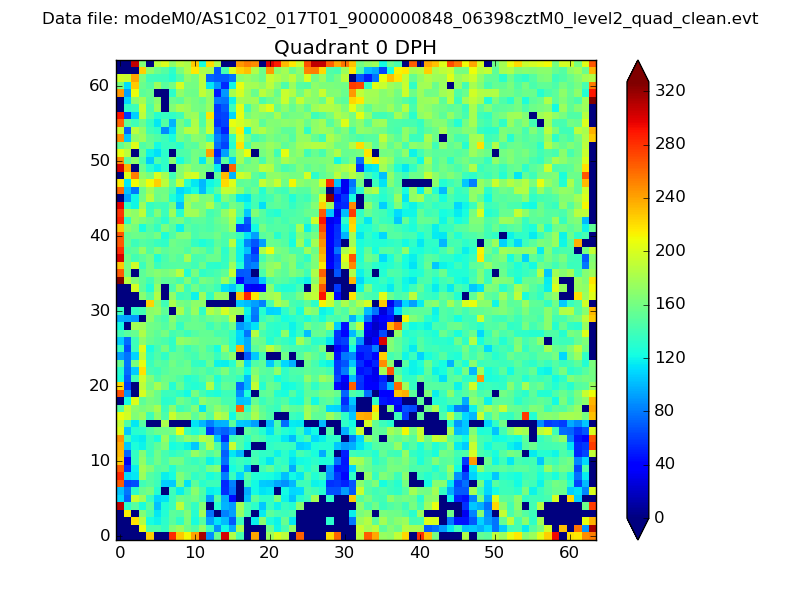 |
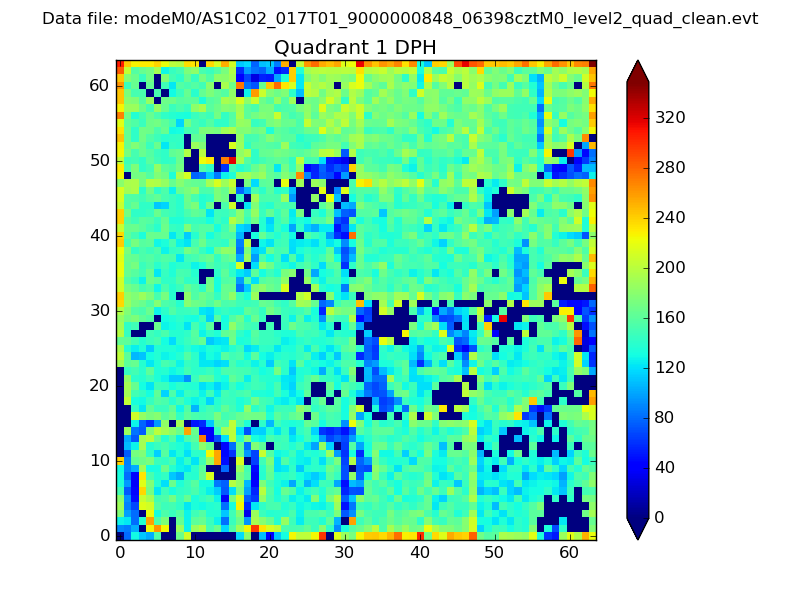 |
Quadrant B |
|---|---|---|---|
| Quadrant D | 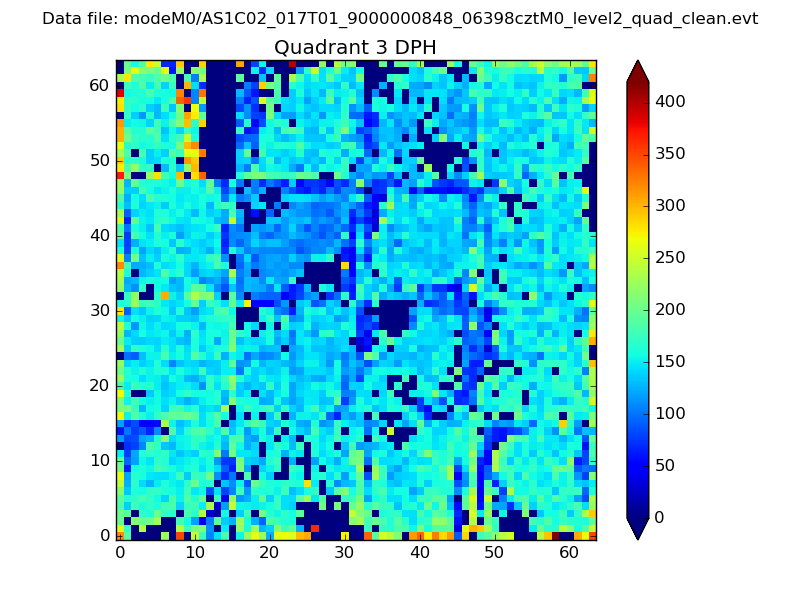 |
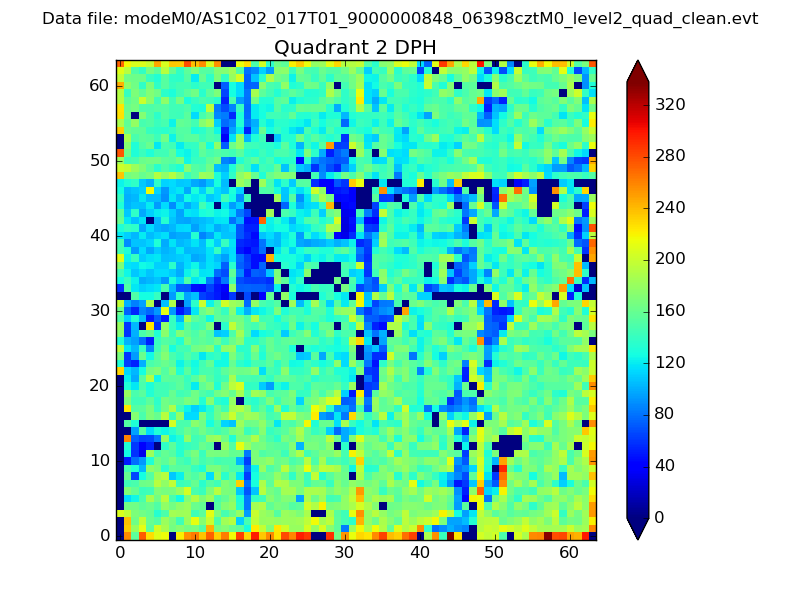 |
Quadrant C |
| Plot type | Count rate plots | Images |
|---|---|---|
| Comparison with Poisson distribution Blue bars denote a histogram of data divided into 1 sec bins. Red curve is a Poisson curve with rate = median count rate of data. |
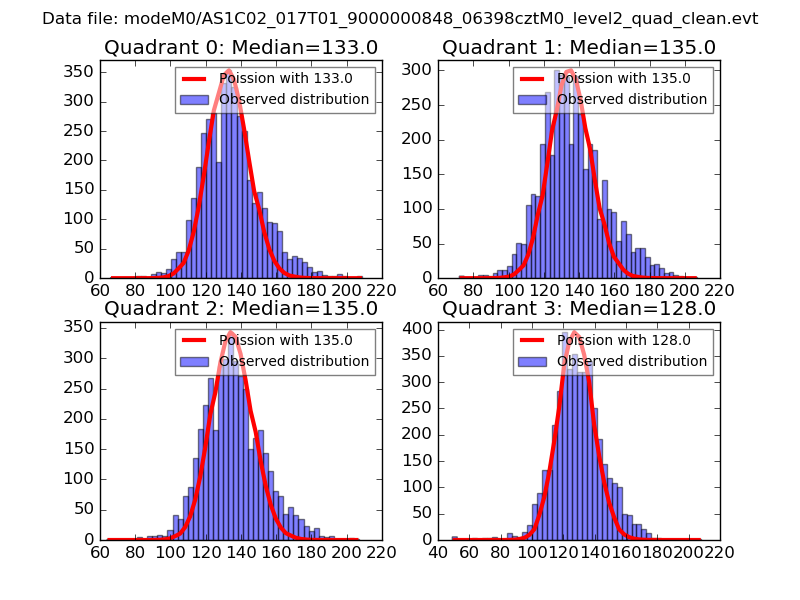 |
 |
| Quadrant-wise count rates Data is divided into 100 sec bins |
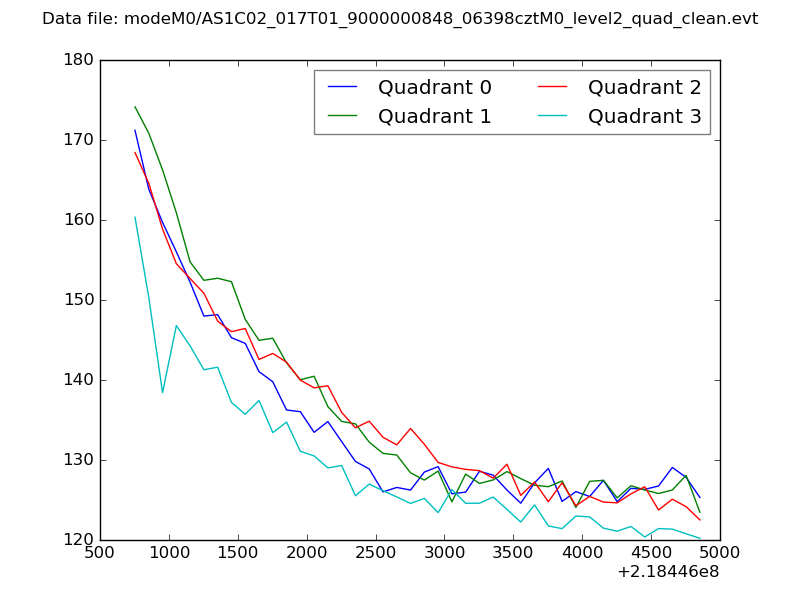 |
|
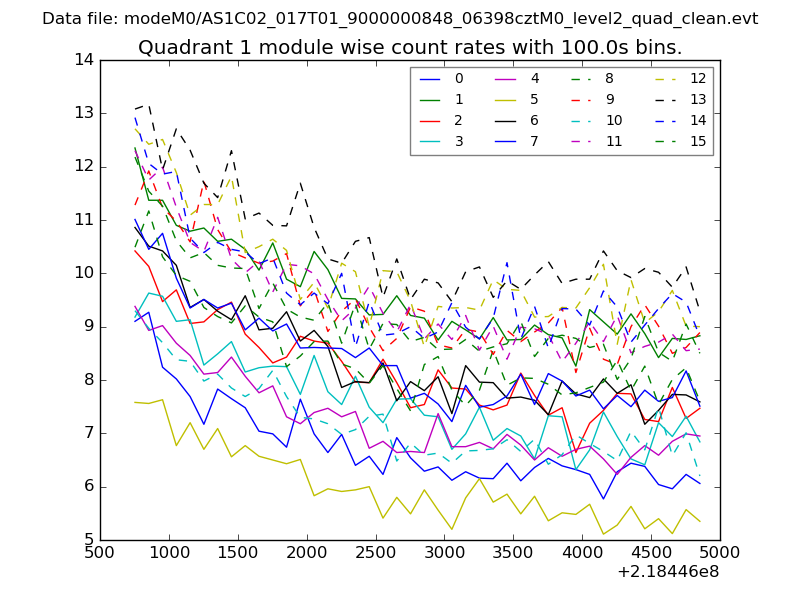
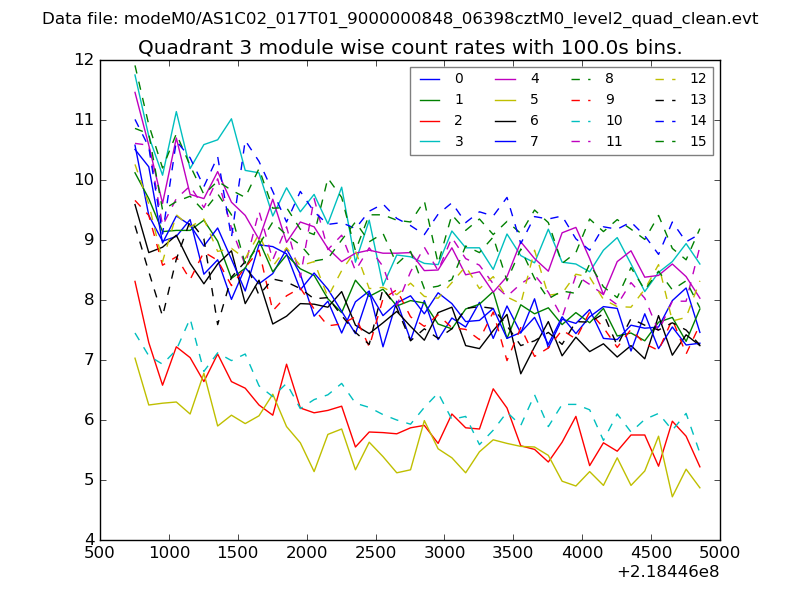
| Module-wise count rates for Quadrant A Data is divided into 100 sec bins |
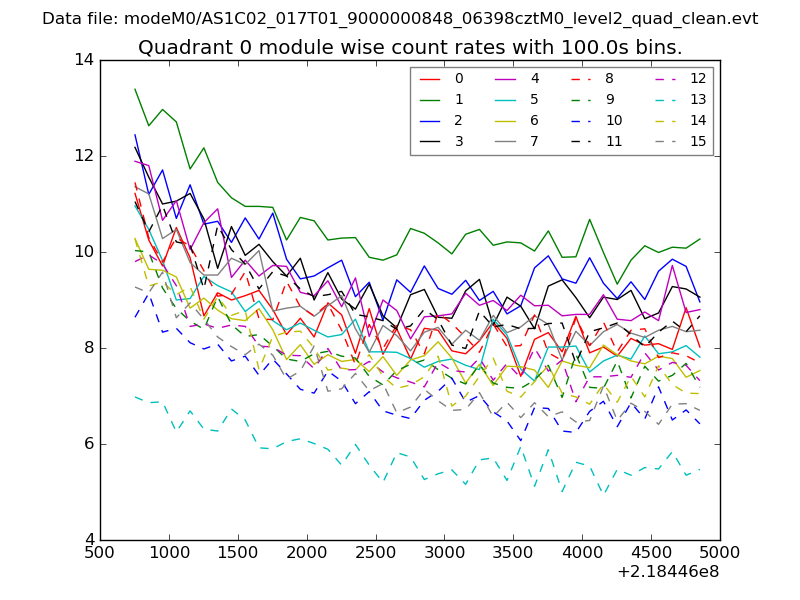 |
 |
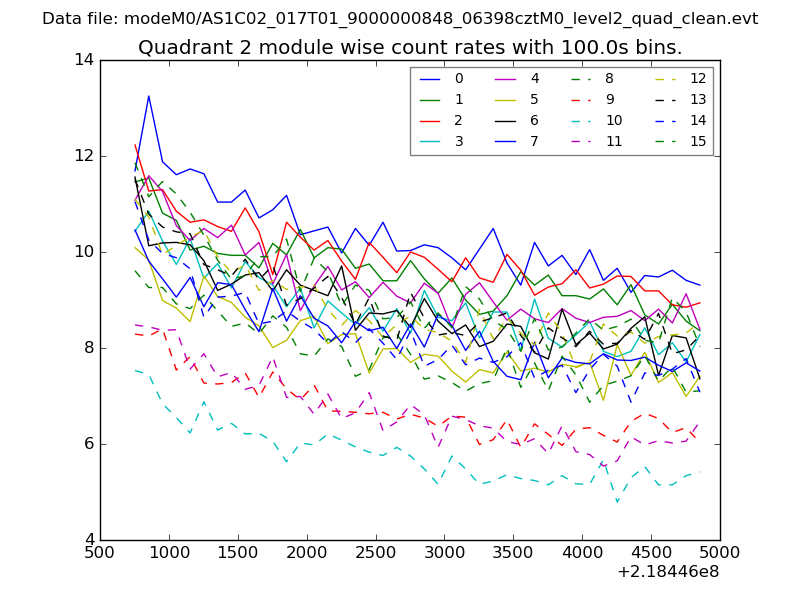
| Module-wise count rates for Quadrant B Data is divided into 100 sec bins |
 |
 |
| Module-wise count rates for Quadrant C Data is divided into 100 sec bins |
 |
 |
| Module-wise count rates for Quadrant D Data is divided into 100 sec bins |
 |
 |
| Parameter | Plot |
|---|---|
| CZT HV Monitor | 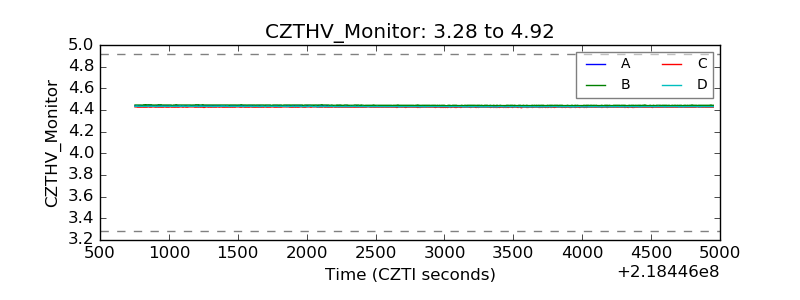 |
| D_VDD |  |
| Temperature 1 | 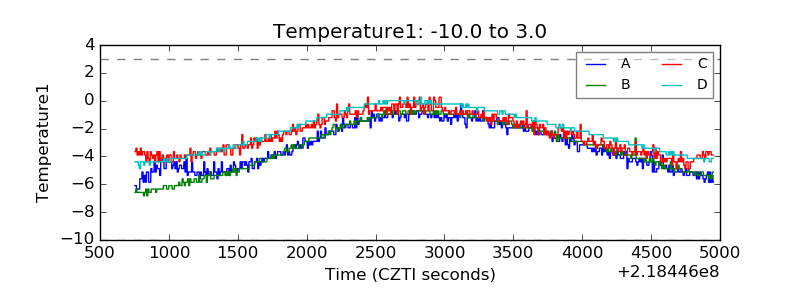 |
| Veto HV Monitor | 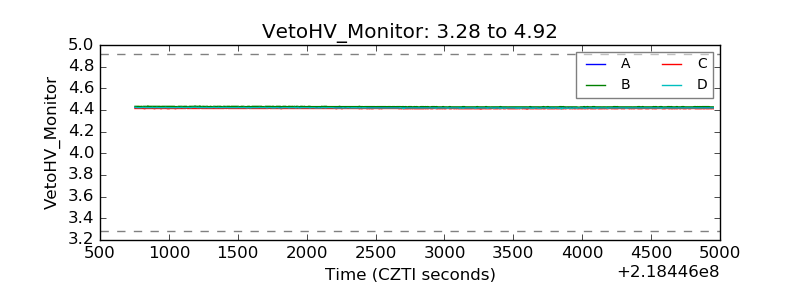 |
| Veto LLD | 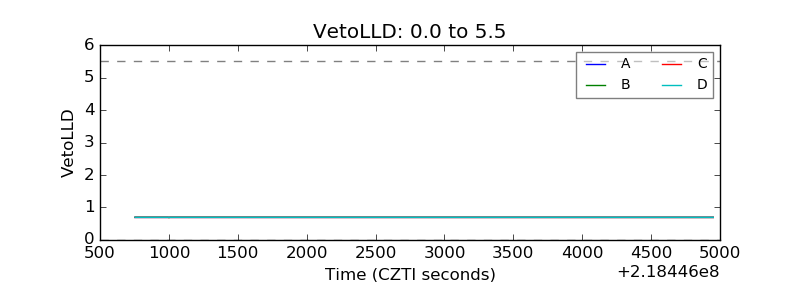 |
| Alpha Counter | 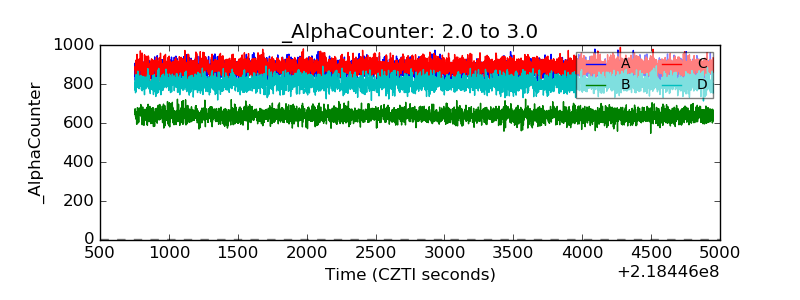 |
| _CPM_Rate | 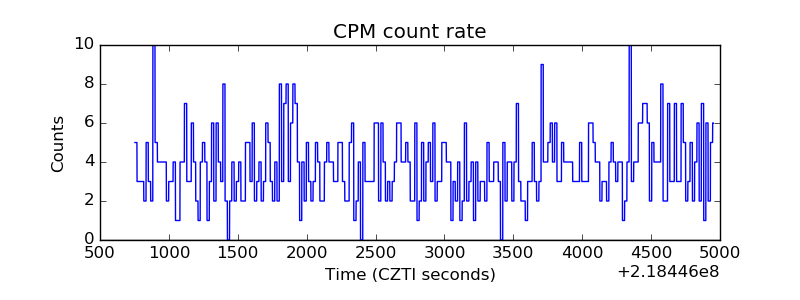 |
| CZT Counter | 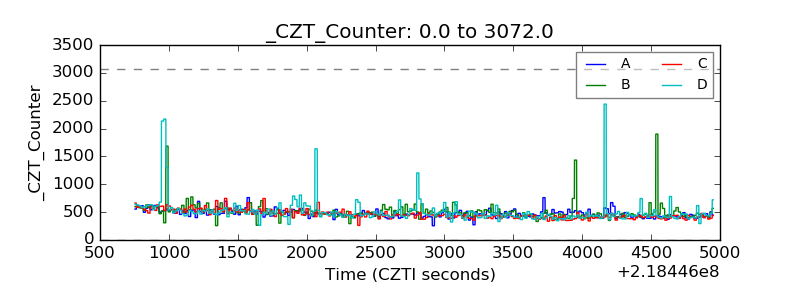 |
| +2.5 Volts monitor |  |
| +5 Volts monitor |  |
| _ROLL_ROT | 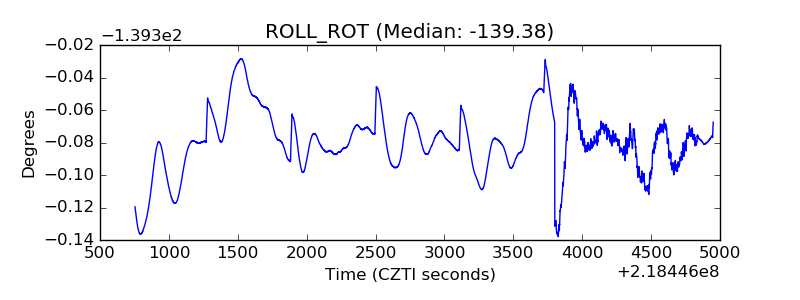 |
| _Roll_DEC | 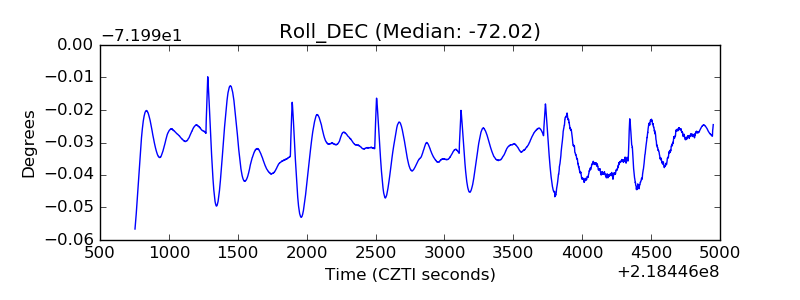 |
| _Roll_RA | 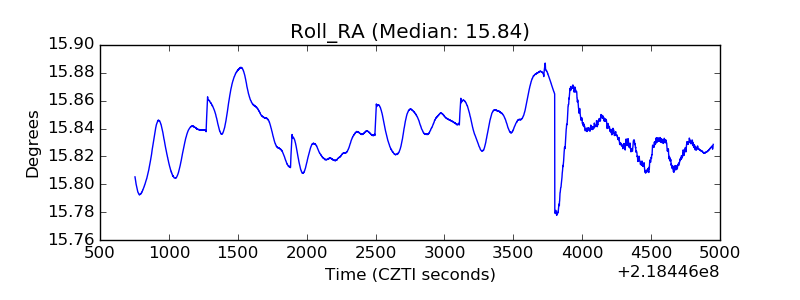 |
| Veto Counter | 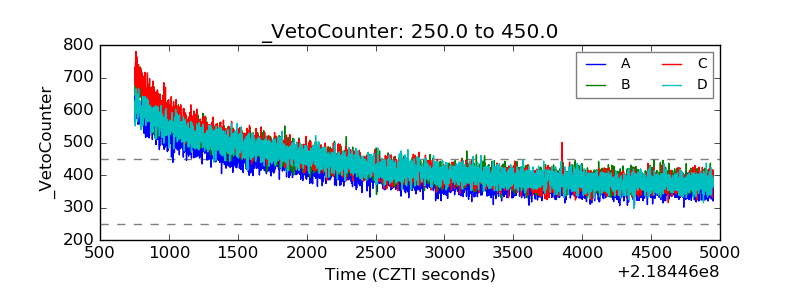 |