| Param | Original file | Final file |
|---|---|---|
| Filename | modeM0/AS1C02_017T01_9000000848_06402cztM0_level2.evt | modeM0/AS1C02_017T01_9000000848_06402cztM0_level2_quad_clean.evt |
| Size (bytes) | 219,265,920 | 66,499,200 |
| Size | 209.1 MB | 63.4 MB |
| Events in quadrant A | 1,588,068 | 443,498 |
| Events in quadrant B | 1,679,112 | 448,684 |
| Events in quadrant C | 1,483,178 | 449,135 |
| Events in quadrant D | 1,655,366 | 429,566 |
| Mode SS | |||
|---|---|---|---|
| Quadrant | BADHDUFLAG | Total packets | Discarded packets |
| A | 0 | 68 | 0 |
| B | 0 | 68 | 0 |
| C | 0 | 68 | 0 |
| D | 0 | 68 | 0 |
| Mode M0 | |||
|---|---|---|---|
| Quadrant | BADHDUFLAG | Total packets | Discarded packets |
| A | 0 | 6897 | 0 |
| B | 0 | 7169 | 0 |
| C | 0 | 6862 | 0 |
| D | 0 | 7232 | 0 |
| Quadrant | Total seconds | Saturated seconds | Saturation percentage |
|---|---|---|---|
| A | 3426 | 4 | 0.116754% |
| B | 3426 | 6 | 0.175131% |
| C | 3426 | 1 | 0.029189% |
| D | 3426 | 6 | 0.175131% |
Noise dominated data is calculated using 1-second bins in cleaned event files. If a bin has >2000 counts, and if more than 50% of those come from <1% of pixels, then it is considered to be noise-dominated and hence unusable.
| Quadrant | # 1 sec bins | Bins with >0 counts | Bins with >2000 counts | High rate bins dominated by noise | Noise dominated (total time) | Noise dominated (detector-on time) | Marked lightcurve |
|---|---|---|---|---|---|---|---|
| A | 3426 | 3426 | 0 | 0 | 0.00% | 0.00% | 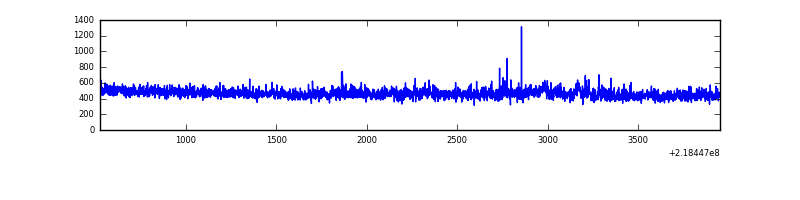 |
| B | 3426 | 3426 | 2 | 2 | 0.06% | 0.06% | 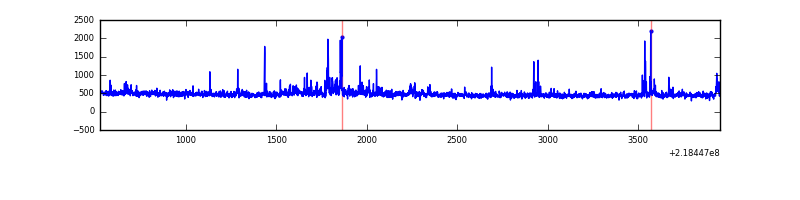 |
| C | 3426 | 3426 | 0 | 0 | 0.00% | 0.00% | 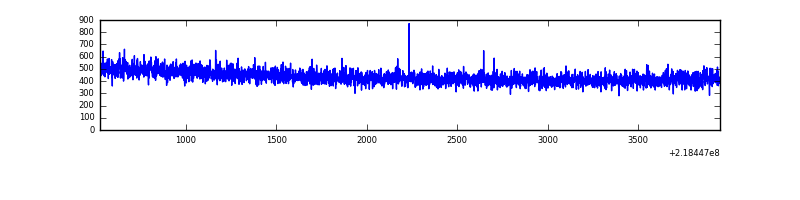 |
| D | 3426 | 3426 | 6 | 6 | 0.18% | 0.18% | 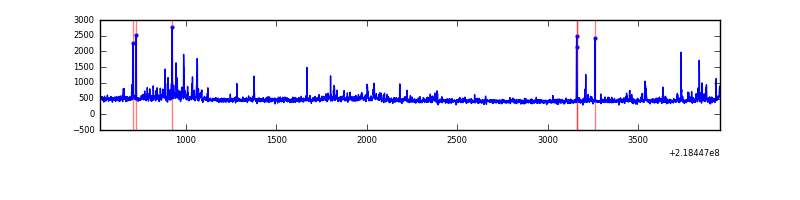 |
Top three noisy pixels from each quadrant. If the there are fewer than three noisy pixels in the level2.evt file, extra rows are filled as -1
| Pixel properties | Quadrant properties | ||||||
|---|---|---|---|---|---|---|---|
| Quadrant | DetID | PixID | Counts | Sigma | Mean | Median | Sigma |
| A | 8 | 15 | 44576 | 545.39 | 395 | 388 | 81.0 |
| A | 15 | 174 | 14993 | 180.26 | 395 | 388 | 81.0 |
| A | 15 | 234 | 6391 | 74.09 | 395 | 388 | 81.0 |
| B | 4 | 81 | 40226 | 523.29 | 395 | 386 | 76.1 |
| B | 15 | 204 | 32297 | 419.14 | 395 | 386 | 76.1 |
| B | 0 | 214 | 24573 | 317.69 | 395 | 386 | 76.1 |
| C | 13 | 61 | 3118 | 31.5 | 379 | 381 | 86.9 |
| C | 1 | 16 | 2510 | 24.5 | 379 | 381 | 86.9 |
| C | 3 | 202 | 999 | 7.11 | 379 | 381 | 86.9 |
| D | 2 | 152 | 63244 | 662.93 | 382 | 370 | 94.8 |
| D | 11 | 241 | 49867 | 521.89 | 382 | 370 | 94.8 |
| D | 5 | 97 | 17657 | 182.27 | 382 | 370 | 94.8 |
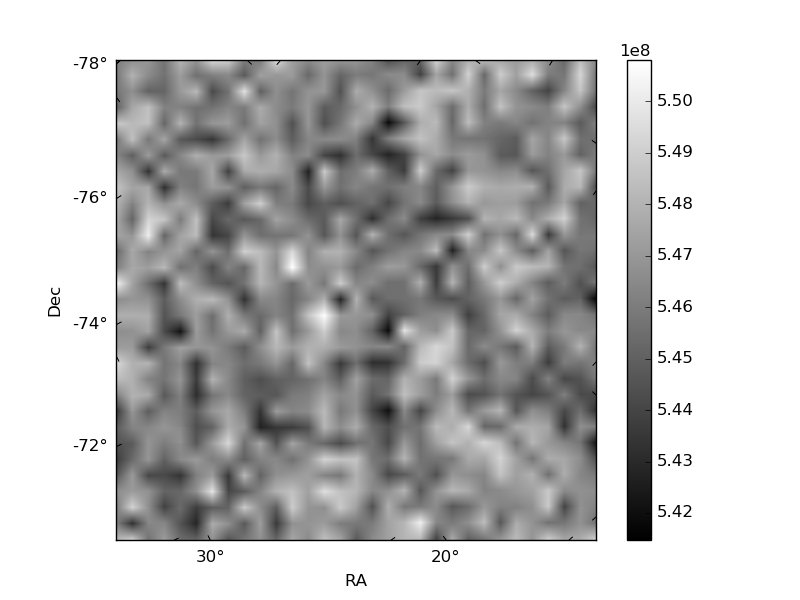
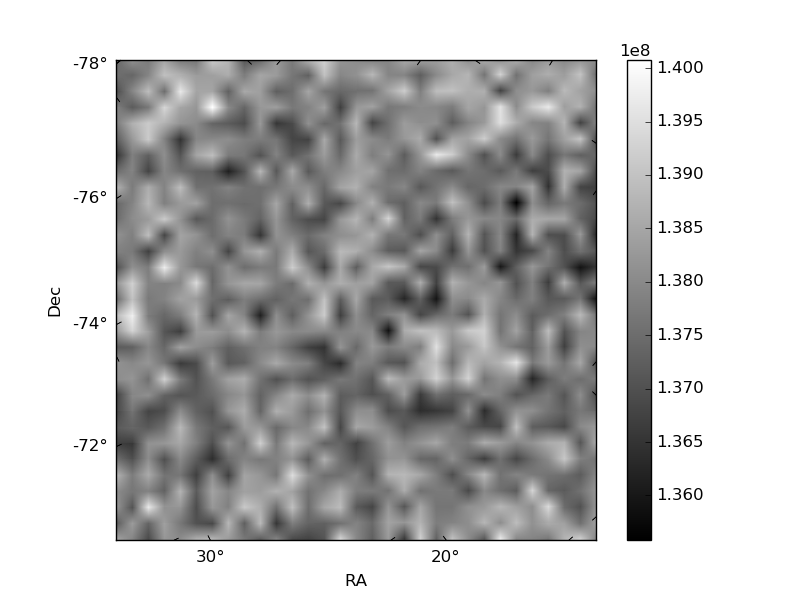
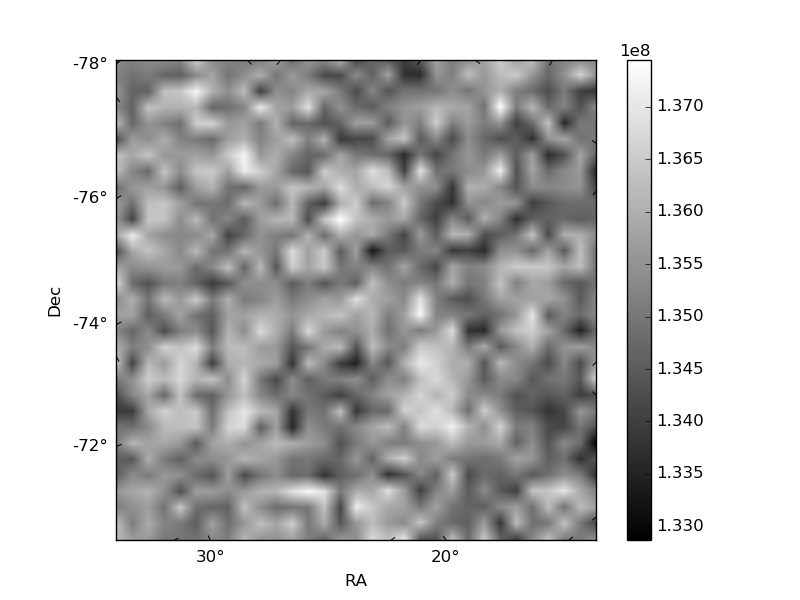
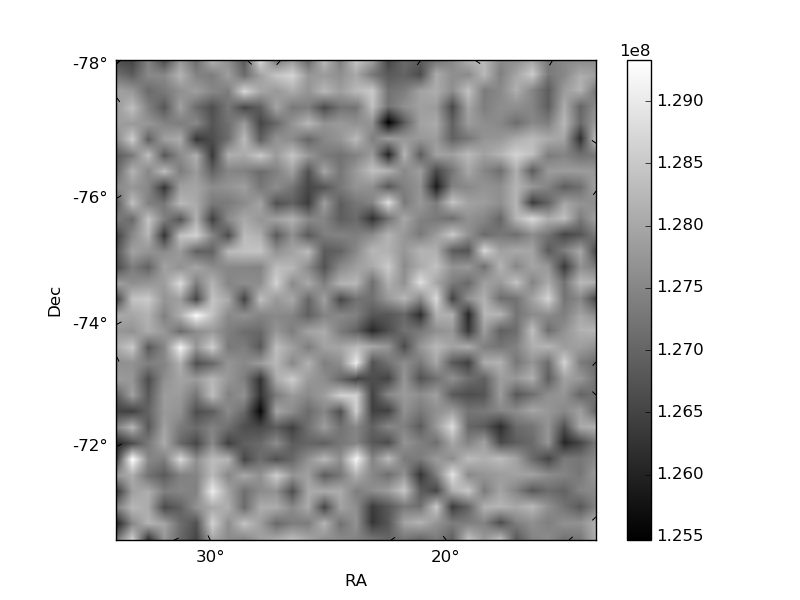
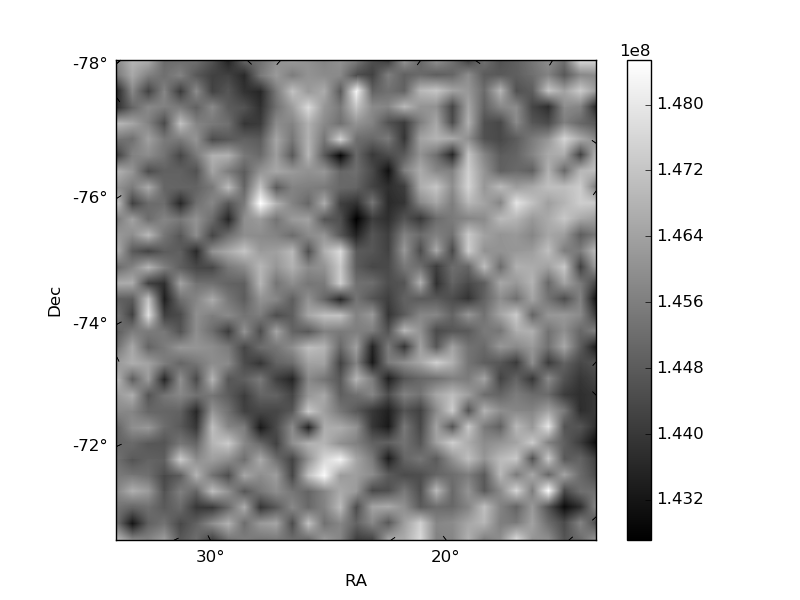
Histogram calculated using DETX and DETY for each event in the final _common_clean file
| Quadrant A | 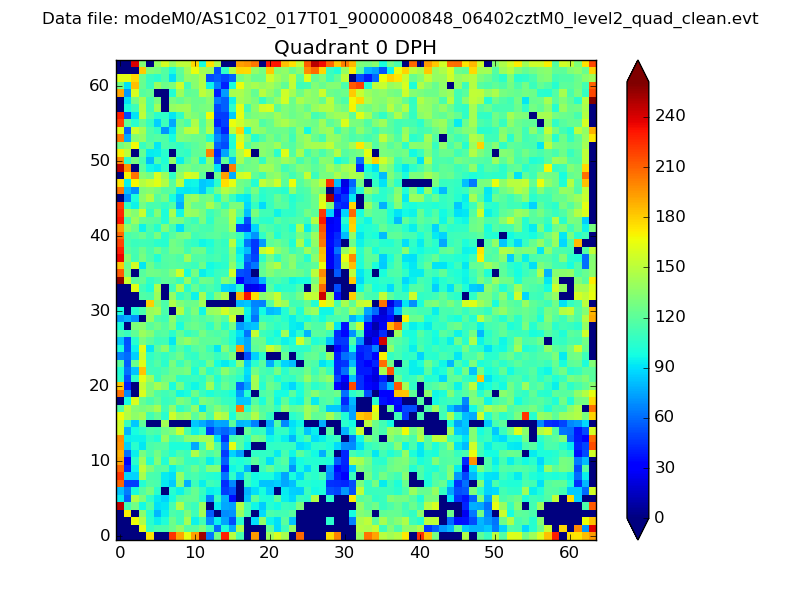 |
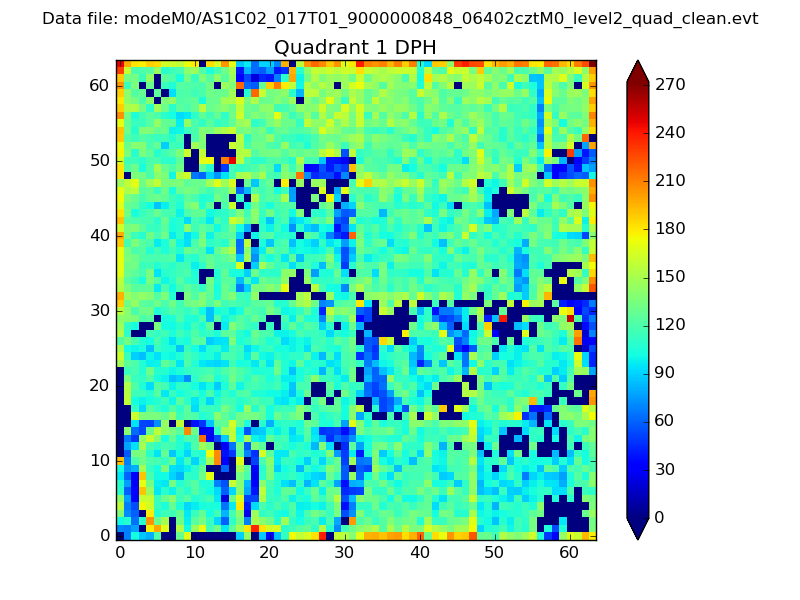 |
Quadrant B |
|---|---|---|---|
| Quadrant D | 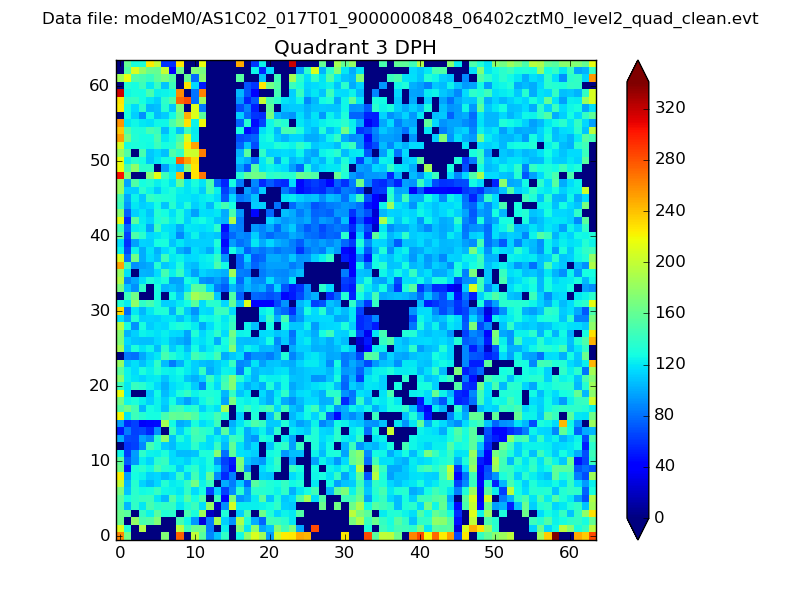 |
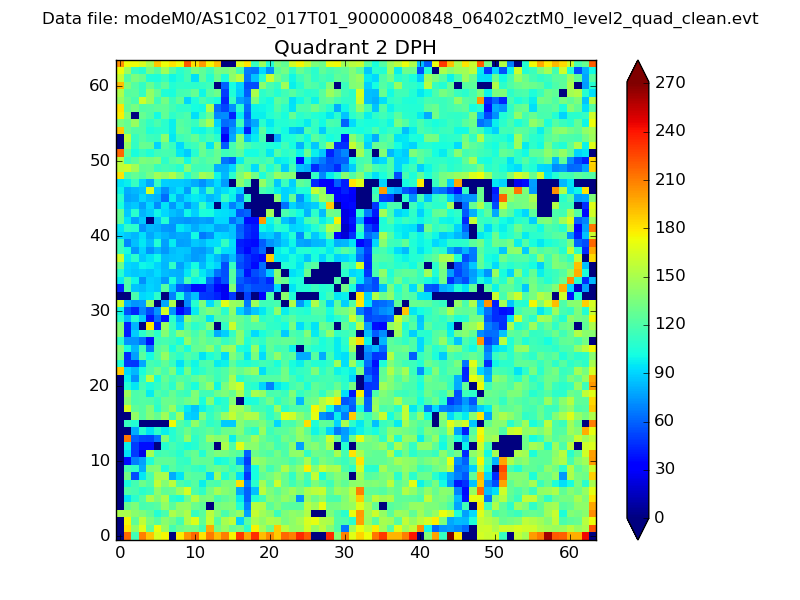 |
Quadrant C |
| Plot type | Count rate plots | Images |
|---|---|---|
| Comparison with Poisson distribution Blue bars denote a histogram of data divided into 1 sec bins. Red curve is a Poisson curve with rate = median count rate of data. |
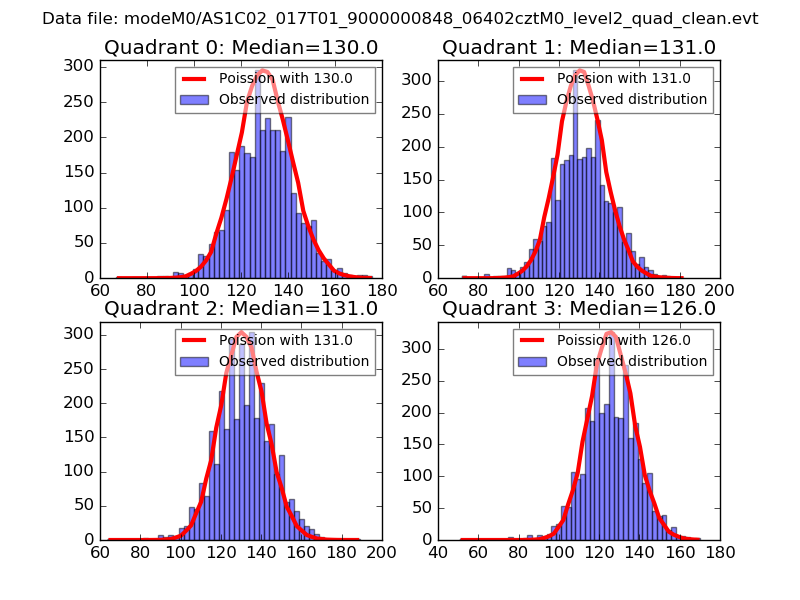 |
 |
| Quadrant-wise count rates Data is divided into 100 sec bins |
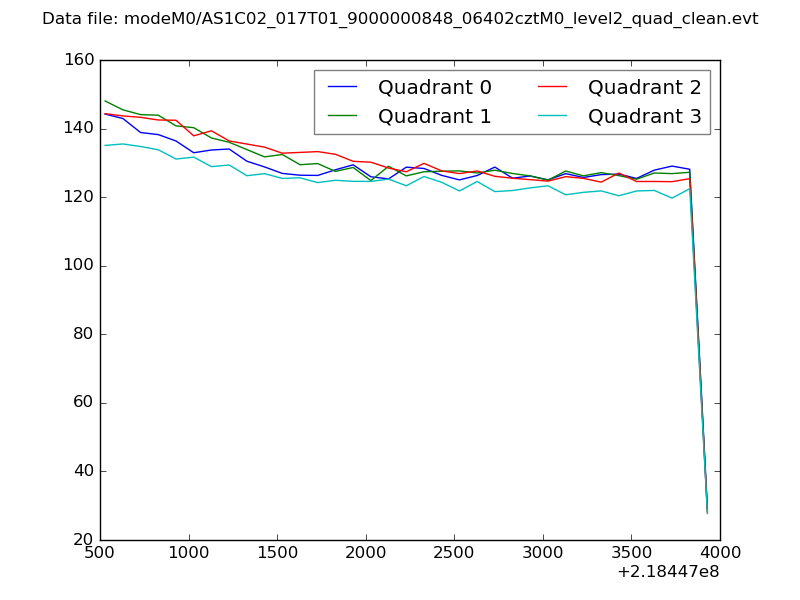 |
|
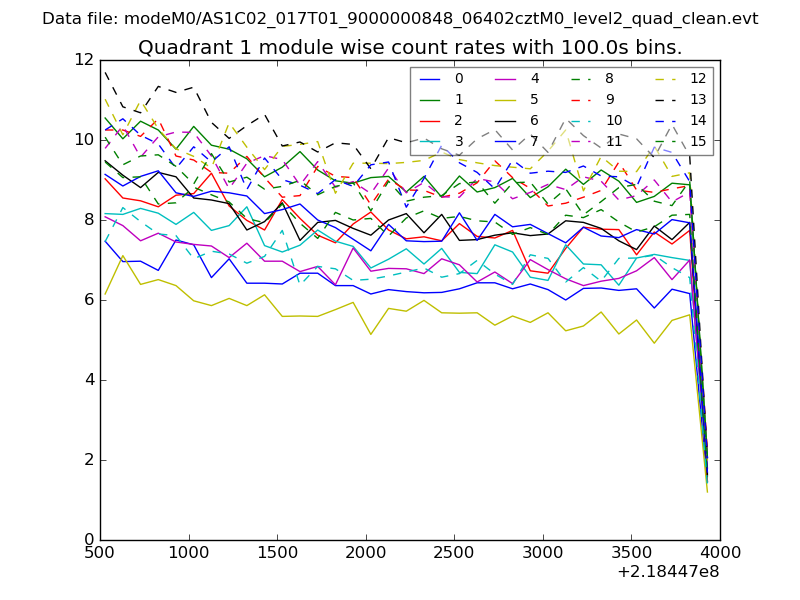
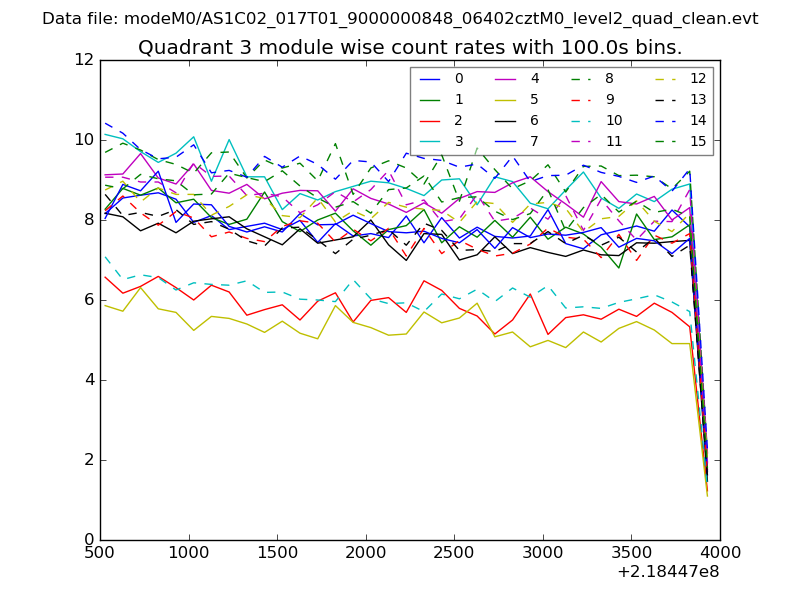
| Module-wise count rates for Quadrant A Data is divided into 100 sec bins |
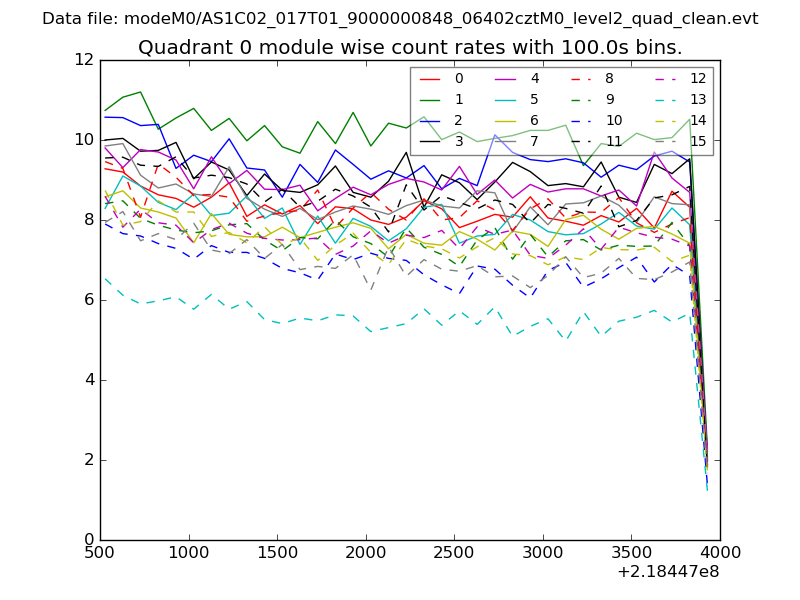 |
 |
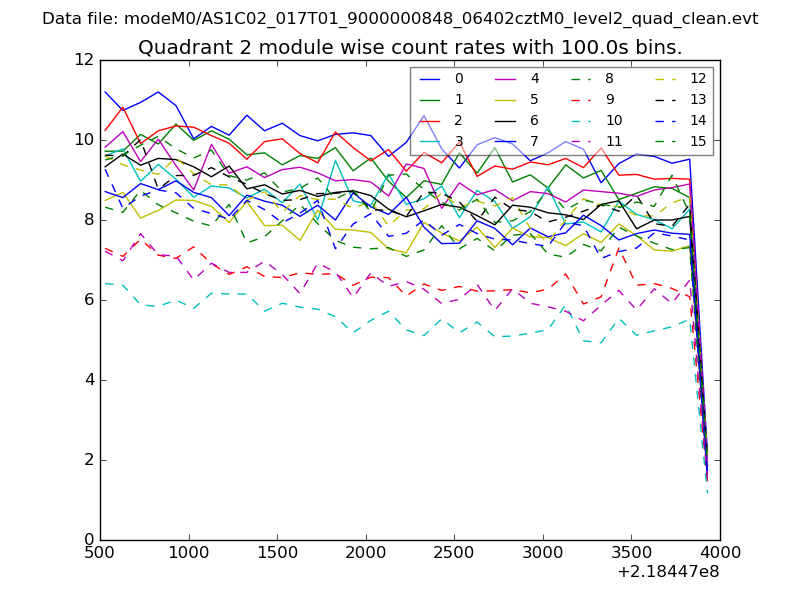
| Module-wise count rates for Quadrant B Data is divided into 100 sec bins |
 |
 |
| Module-wise count rates for Quadrant C Data is divided into 100 sec bins |
 |
 |
| Module-wise count rates for Quadrant D Data is divided into 100 sec bins |
 |
 |
| Parameter | Plot |
|---|---|
| CZT HV Monitor | 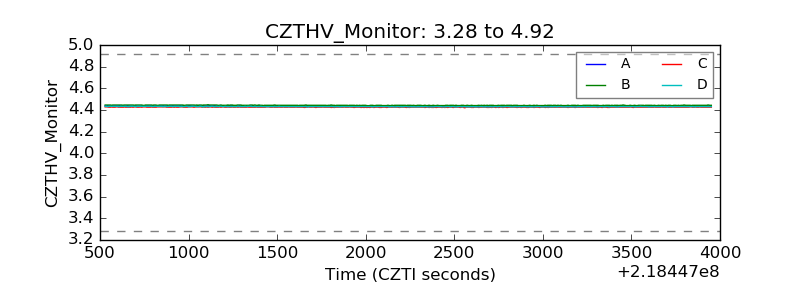 |
| D_VDD |  |
| Temperature 1 | 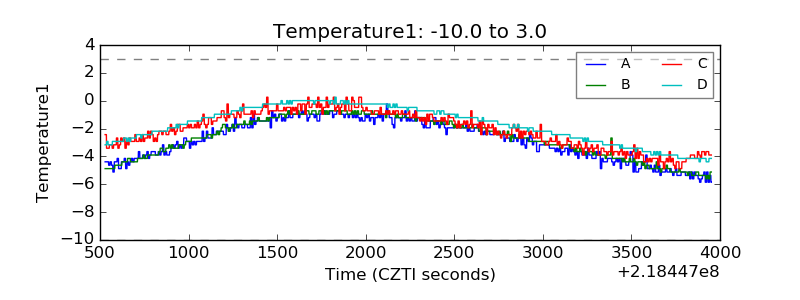 |
| Veto HV Monitor | 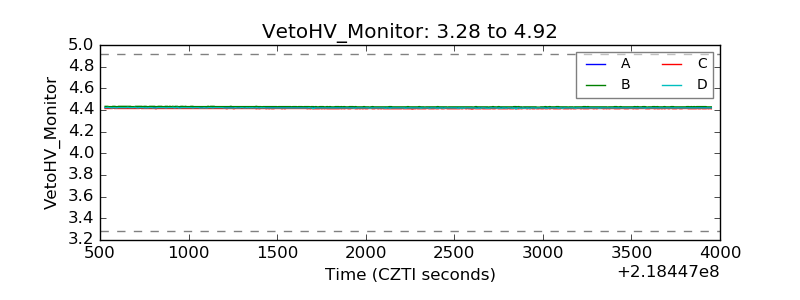 |
| Veto LLD | 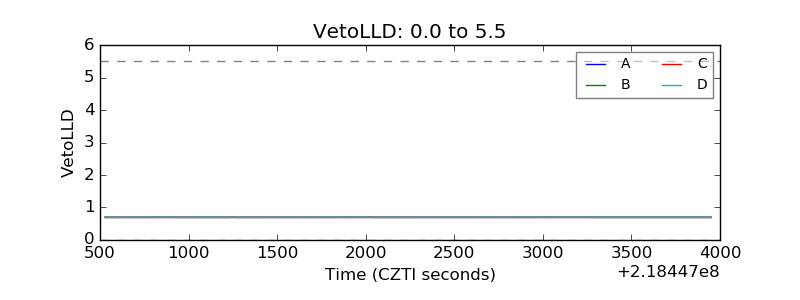 |
| Alpha Counter | 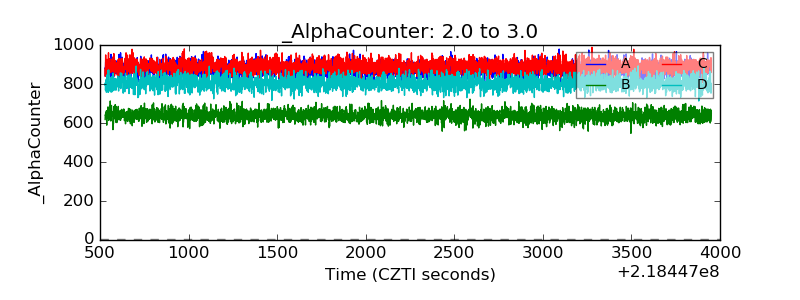 |
| _CPM_Rate | 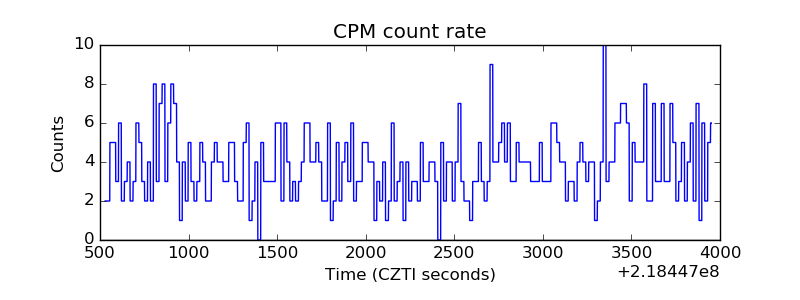 |
| CZT Counter | 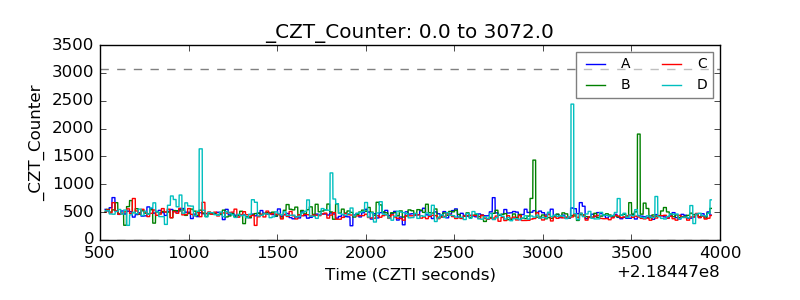 |
| +2.5 Volts monitor |  |
| +5 Volts monitor |  |
| _ROLL_ROT | 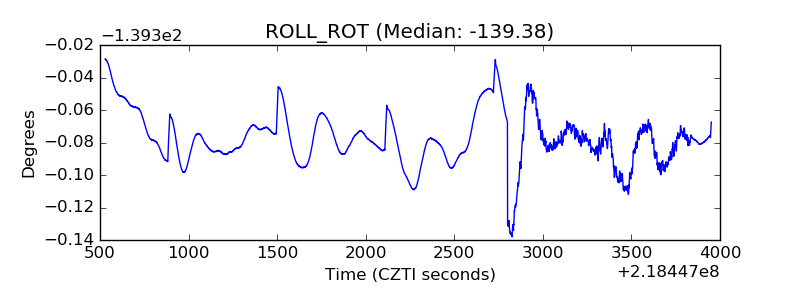 |
| _Roll_DEC | 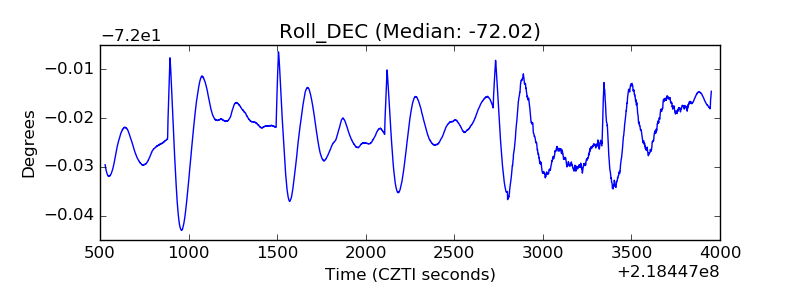 |
| _Roll_RA | 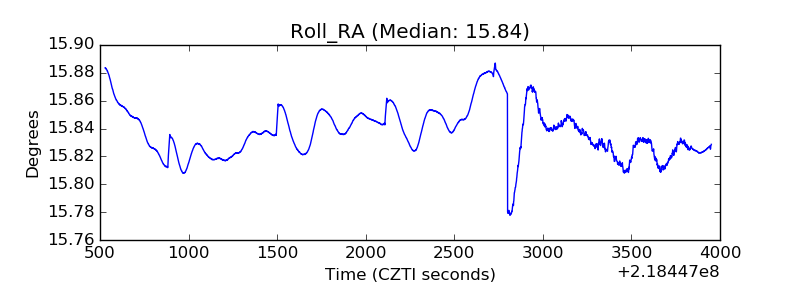 |
| Veto Counter | 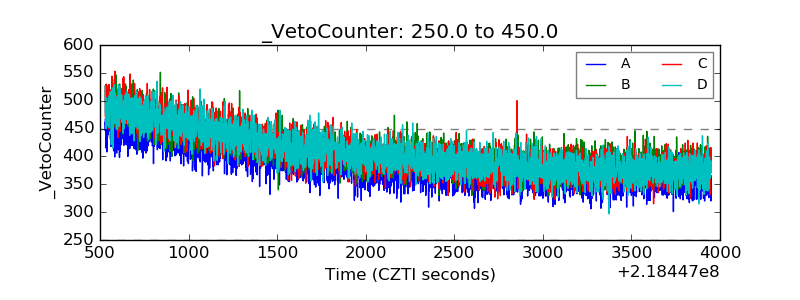 |