| Param | Original file | Final file |
|---|---|---|
| Filename | modeM0/AS1G06_164T01_9000000844cztM0_level2.fits | modeM0/AS1G06_164T01_9000000844cztM0_level2_quad_clean.evt |
| Size (bytes) | 376,364,160 | 378,339,840 |
| Size | 358.9 MB | 360.8 MB |
| Events in quadrant A | 2,269,216 | 2,277,985 |
| Events in quadrant B | 2,180,294 | 2,235,287 |
| Events in quadrant C | 2,223,188 | 2,149,116 |
| Events in quadrant D | 1,946,088 | 2,016,434 |
| Mode SS | |||
|---|---|---|---|
| Quadrant | BADHDUFLAG | Total packets | Discarded packets |
| A | 0 | 828 | 0 |
| B | 0 | 828 | 0 |
| C | 0 | 828 | 0 |
| D | 0 | 828 | 0 |
| Mode M0 | |||
|---|---|---|---|
| Quadrant | BADHDUFLAG | Total packets | Discarded packets |
| A | 0 | 96929 | 0 |
| B | 0 | 92055 | 0 |
| C | 0 | 82806 | 0 |
| D | 0 | 89225 | 0 |
| Mode M9 | |||
|---|---|---|---|
| Quadrant | BADHDUFLAG | Total packets | Discarded packets |
| A | 0 | 83 | 0 |
| B | 0 | 83 | 0 |
| C | 0 | 83 | 0 |
| D | 0 | 83 | 0 |
| Quadrant | Total seconds | Saturated seconds | Saturation percentage |
|---|---|---|---|
| A | 40458 | 1237 | 3.057492% |
| B | 40460 | 1124 | 2.778052% |
| C | 40459 | 403 | 0.996070% |
| D | 40467 | 627 | 1.549411% |
Noise dominated data is calculated using 1-second bins in cleaned event files. If a bin has >2000 counts, and if more than 50% of those come from <1% of pixels, then it is considered to be noise-dominated and hence unusable.
| Quadrant | # 1 sec bins | Bins with >0 counts | Bins with >2000 counts | High rate bins dominated by noise | Noise dominated (total time) | Noise dominated (detector-on time) | Marked lightcurve |
|---|---|---|---|---|---|---|---|
| A | 48862 | 40478 | 0 | 0 | 0.00% | 0.00% |  |
| B | 48862 | 40460 | 0 | 0 | 0.00% | 0.00% | 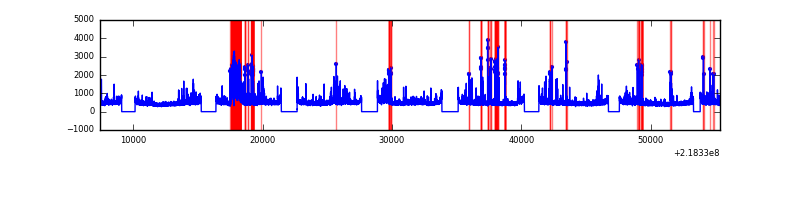 |
| C | 48862 | 40479 | 0 | 0 | 0.00% | 0.00% | 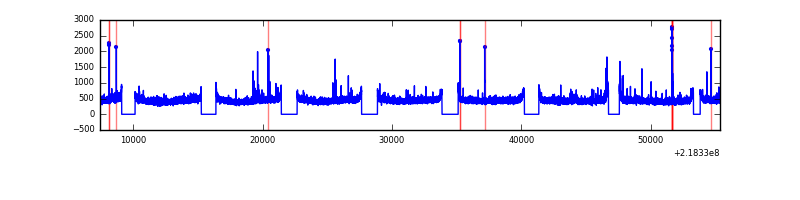 |
| D | 48862 | 40474 | 0 | 0 | 0.00% | 0.00% | 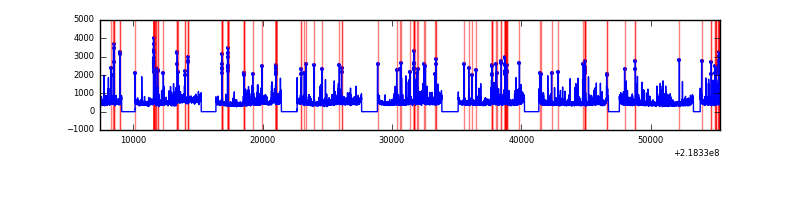 |
Top three noisy pixels from each quadrant. If the there are fewer than three noisy pixels in the level2.evt file, extra rows are filled as -1
| Pixel properties | Quadrant properties | ||||||
|---|---|---|---|---|---|---|---|
| Quadrant | DetID | PixID | Counts | Sigma | Mean | Median | Sigma |
| A | 0 | 29 | 2240 | 11.41 | 590 | 556 | 147.7 |
| A | 7 | 110 | 1941 | 9.38 | 590 | 556 | 147.7 |
| A | 0 | 30 | 1772 | 8.24 | 590 | 556 | 147.7 |
| B | 2 | 9 | 1868 | 11.43 | 576 | 552 | 115.2 |
| B | 14 | 254 | 1538 | 8.56 | 576 | 552 | 115.2 |
| B | 12 | 226 | 1487 | 8.12 | 576 | 552 | 115.2 |
| C | 1 | 81 | 1638 | 7.05 | 588 | 546 | 154.8 |
| C | 1 | 80 | 1622 | 6.95 | 588 | 546 | 154.8 |
| C | 2 | 191 | 1510 | 6.23 | 588 | 546 | 154.8 |
| D | 3 | 14 | 1422 | 6.17 | 555 | 506 | 148.5 |
| D | 11 | 82 | 1421 | 6.16 | 555 | 506 | 148.5 |
| D | 6 | 231 | 1408 | 6.07 | 555 | 506 | 148.5 |
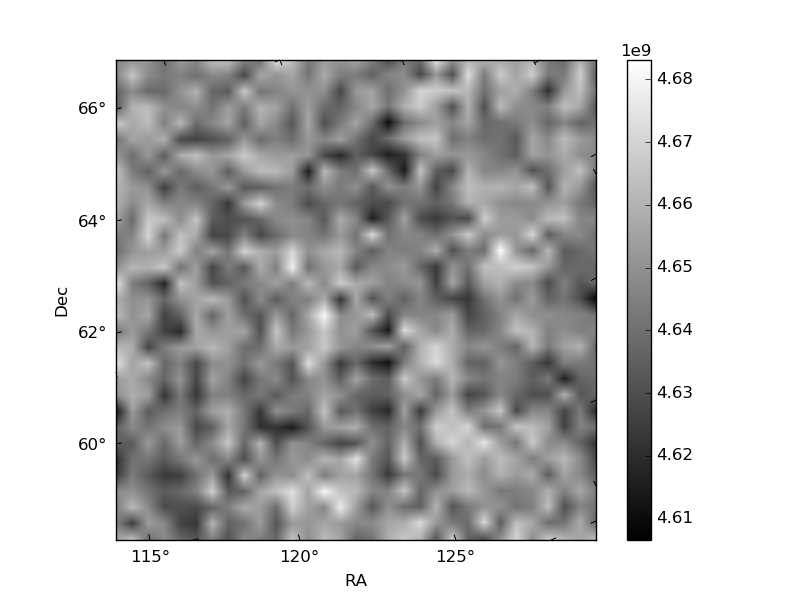
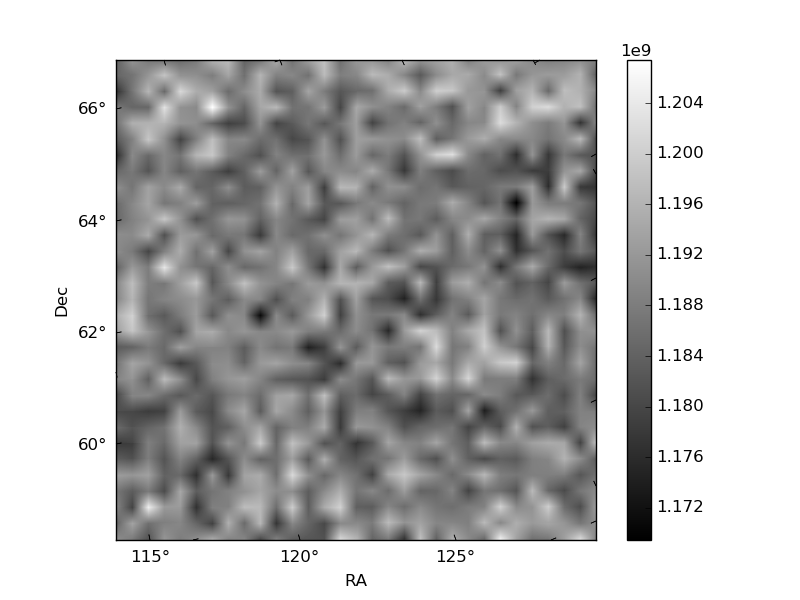
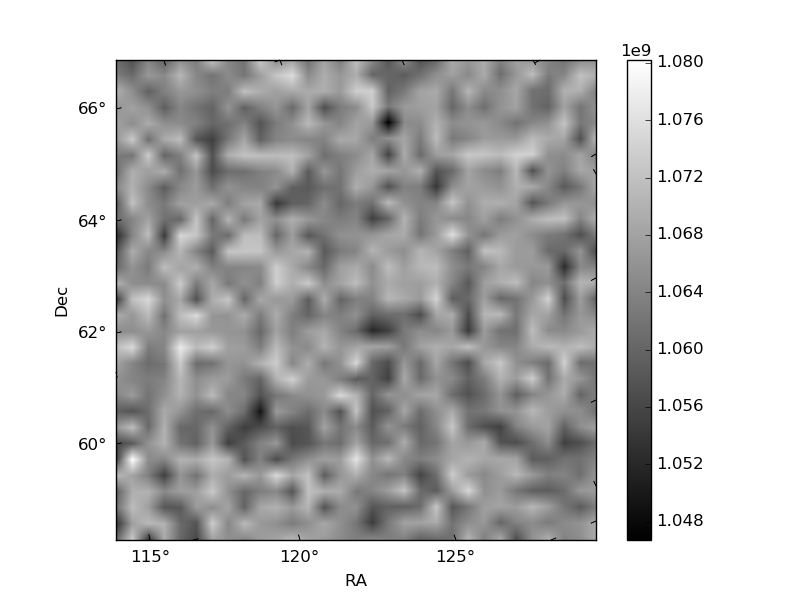
Histogram calculated using DETX and DETY for each event in the final _common_clean file
| Quadrant A | 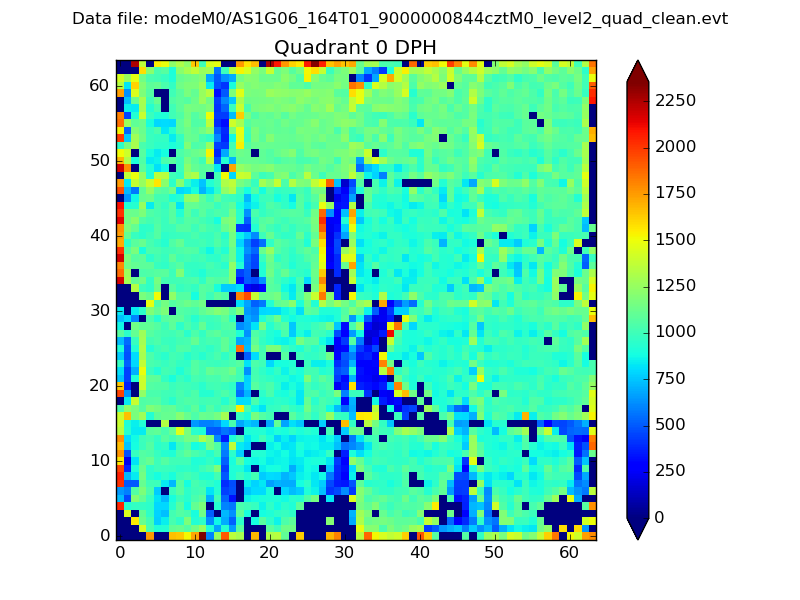 |
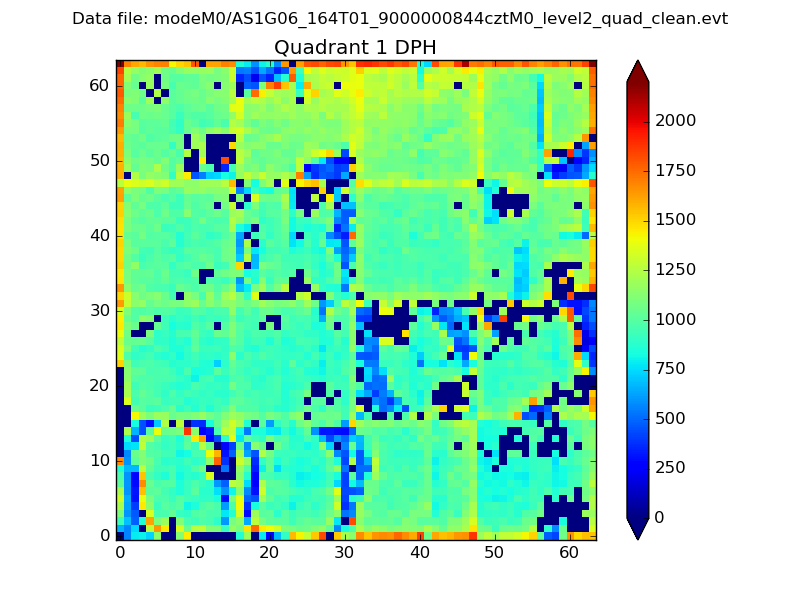 |
Quadrant B |
|---|---|---|---|
| Quadrant D | 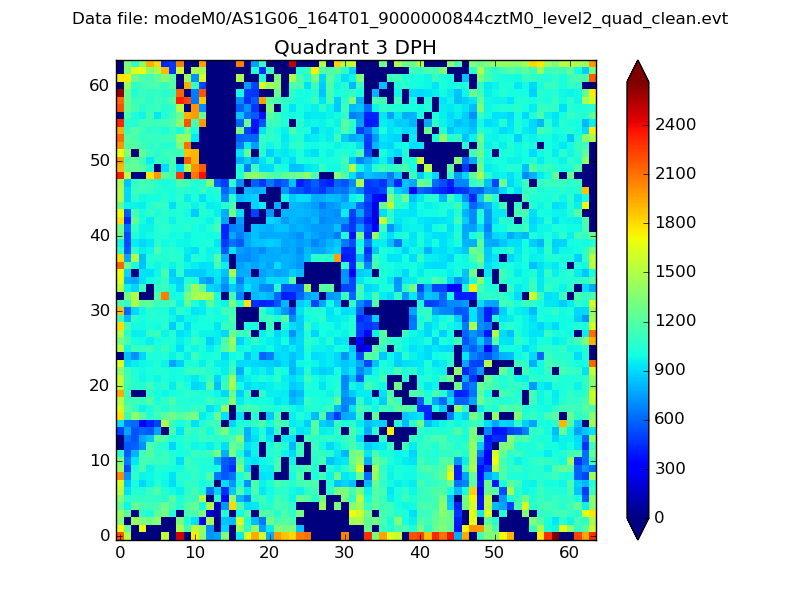 |
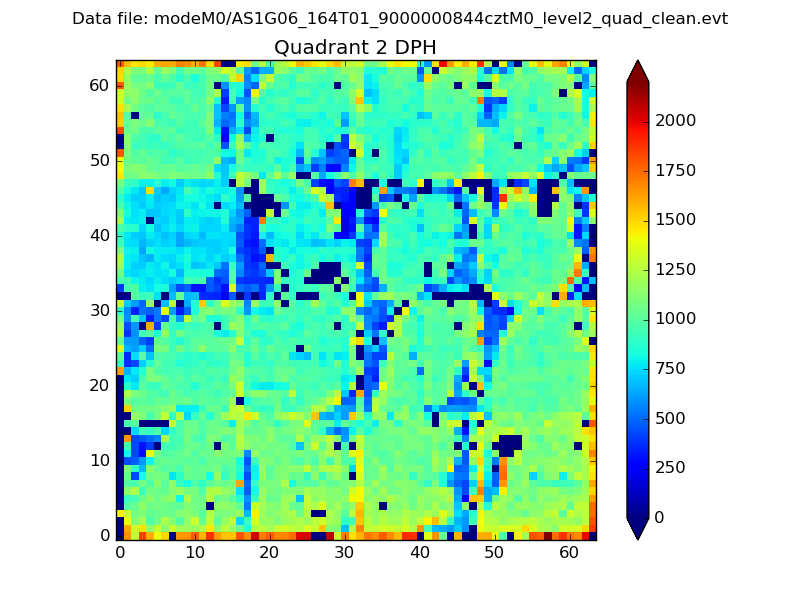 |
Quadrant C |
| Plot type | Count rate plots | Images |
|---|---|---|
| Comparison with Poisson distribution Blue bars denote a histogram of data divided into 1 sec bins. Red curve is a Poisson curve with rate = median count rate of data. |
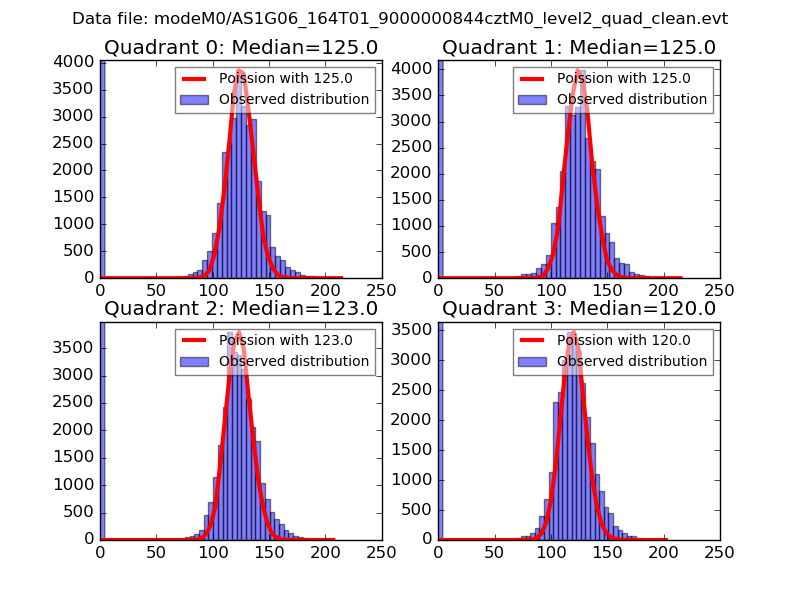 |
 |
| Quadrant-wise count rates Data is divided into 100 sec bins |
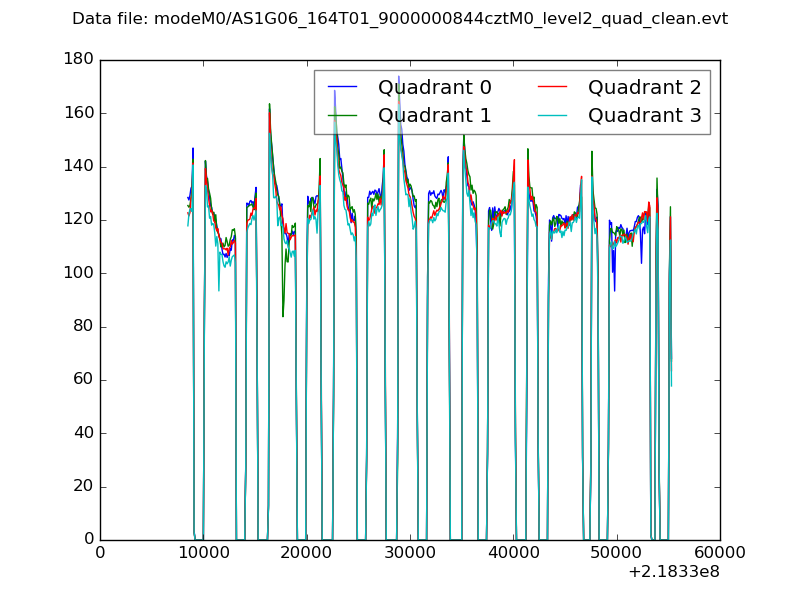 |
|
| Module-wise count rates for Quadrant A Data is divided into 100 sec bins |
 |
 |
| Module-wise count rates for Quadrant B Data is divided into 100 sec bins |
 |
 |
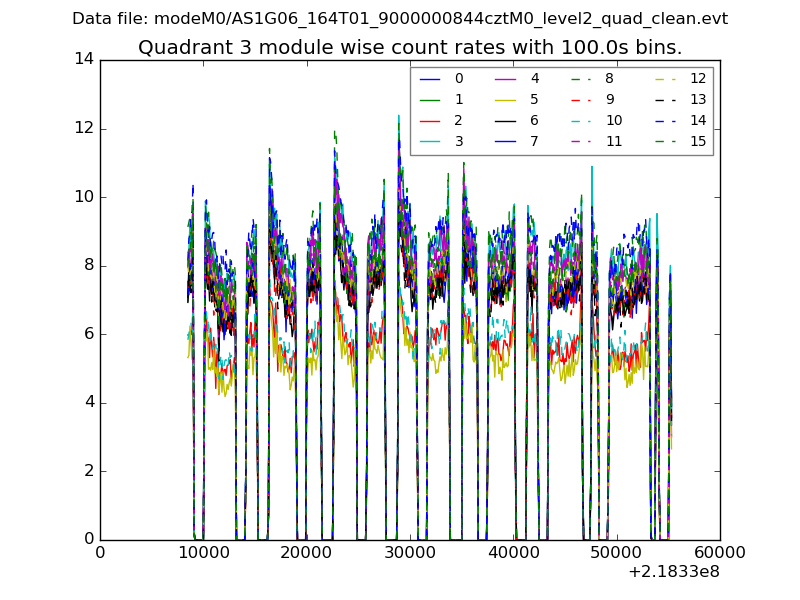
| Module-wise count rates for Quadrant C Data is divided into 100 sec bins |
 |
 |
| Module-wise count rates for Quadrant D Data is divided into 100 sec bins |
 |
 |
| Parameter | Plot |
|---|---|
| CZT HV Monitor |  |
| D_VDD | 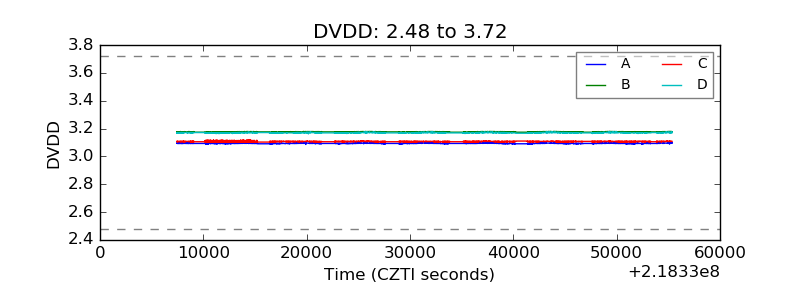 |
| Temperature 1 | 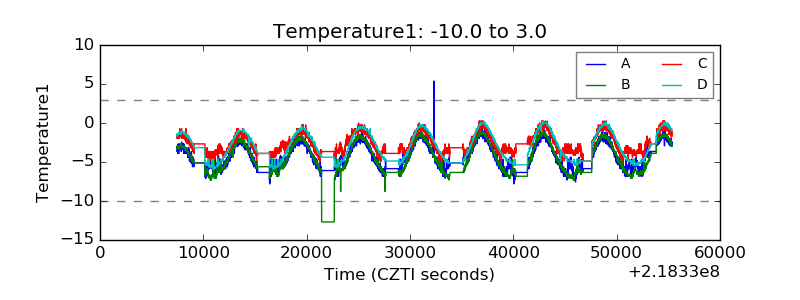 |
| Veto HV Monitor | 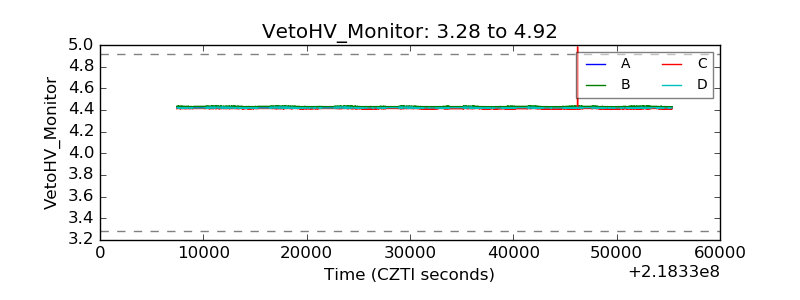 |
| Veto LLD | 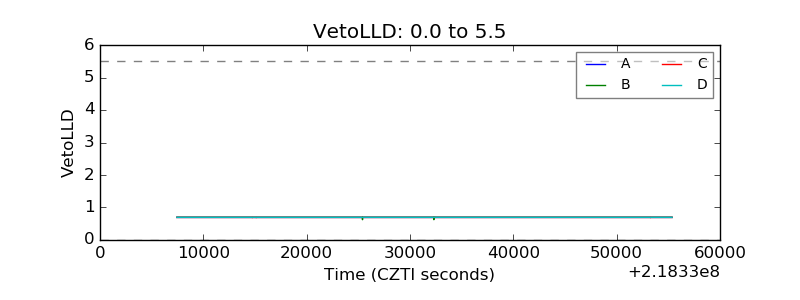 |
| Alpha Counter |  |
| _CPM_Rate | 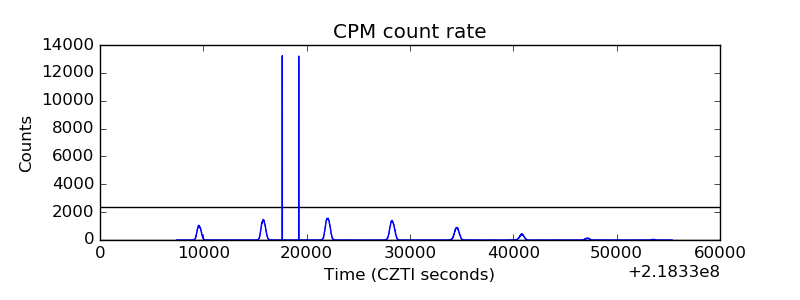 |
| CZT Counter |  |
| +2.5 Volts monitor | 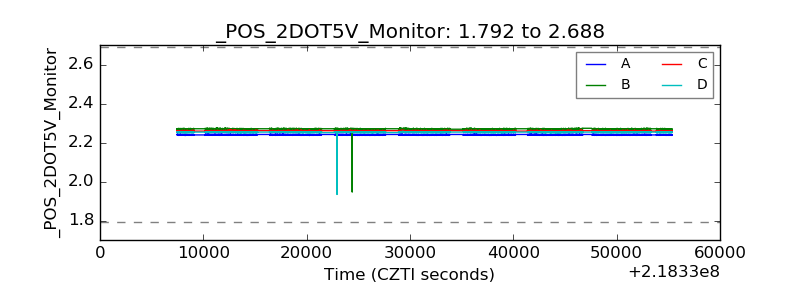 |
| +5 Volts monitor |  |
| _ROLL_ROT | 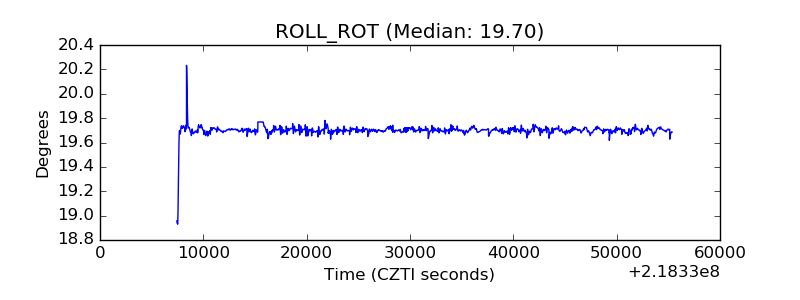 |
| _Roll_DEC |  |
| _Roll_RA | 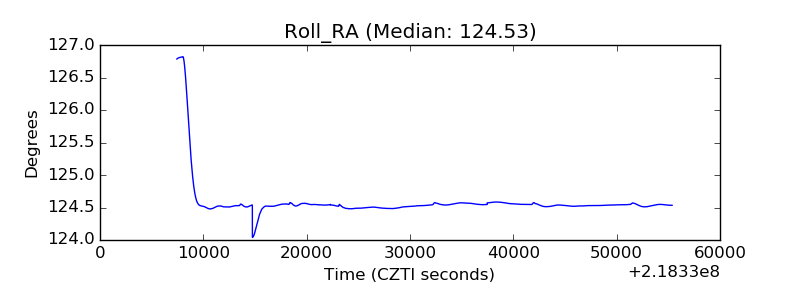 |
| Veto Counter |  |