| Param | Original file | Final file |
|---|---|---|
| Filename | modeM0/AS1G06_164T01_9000000844_06382cztM0_level2.evt | modeM0/AS1G06_164T01_9000000844_06382cztM0_level2_quad_clean.evt |
| Size (bytes) | 758,741,760 | 172,368,000 |
| Size | 723.6 MB | 164.4 MB |
| Events in quadrant A | 5,159,616 | 1,148,032 |
| Events in quadrant B | 6,973,139 | 1,130,618 |
| Events in quadrant C | 4,765,437 | 1,116,563 |
| Events in quadrant D | 5,355,362 | 1,084,365 |
| Mode SS | |||
|---|---|---|---|
| Quadrant | BADHDUFLAG | Total packets | Discarded packets |
| A | 0 | 220 | 0 |
| B | 0 | 220 | 0 |
| C | 0 | 220 | 0 |
| D | 0 | 220 | 0 |
| Mode M0 | |||
|---|---|---|---|
| Quadrant | BADHDUFLAG | Total packets | Discarded packets |
| A | 0 | 22414 | 3 |
| B | 0 | 27643 | 2 |
| C | 0 | 21789 | 2 |
| D | 0 | 23197 | 2 |
| Mode M9 | |||
|---|---|---|---|
| Quadrant | BADHDUFLAG | Total packets | Discarded packets |
| A | 0 | 24 | 0 |
| B | 0 | 24 | 0 |
| C | 0 | 24 | 0 |
| D | 0 | 24 | 0 |
| Quadrant | Total seconds | Saturated seconds | Saturation percentage |
|---|---|---|---|
| A | 10696 | 138 | 1.290202% |
| B | 10696 | 450 | 4.207180% |
| C | 10696 | 60 | 0.560957% |
| D | 10696 | 103 | 0.962977% |
Noise dominated data is calculated using 1-second bins in cleaned event files. If a bin has >2000 counts, and if more than 50% of those come from <1% of pixels, then it is considered to be noise-dominated and hence unusable.
| Quadrant | # 1 sec bins | Bins with >0 counts | Bins with >2000 counts | High rate bins dominated by noise | Noise dominated (total time) | Noise dominated (detector-on time) | Marked lightcurve |
|---|---|---|---|---|---|---|---|
| A | 13151 | 10698 | 31 | 31 | 0.24% | 0.29% |  |
| B | 13151 | 10698 | 316 | 316 | 2.40% | 2.95% | 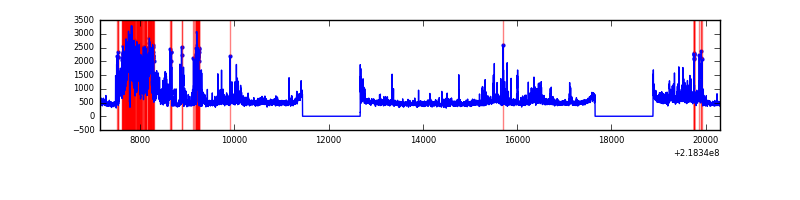 |
| C | 13151 | 10698 | 1 | 1 | 0.01% | 0.01% | 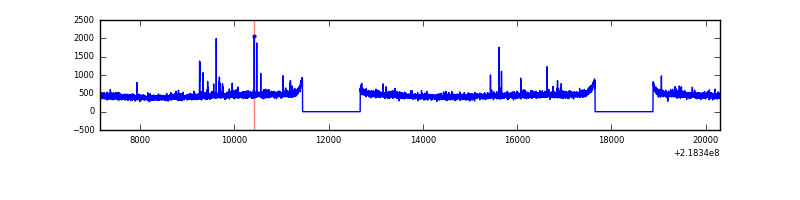 |
| D | 13151 | 10698 | 32 | 32 | 0.24% | 0.30% | 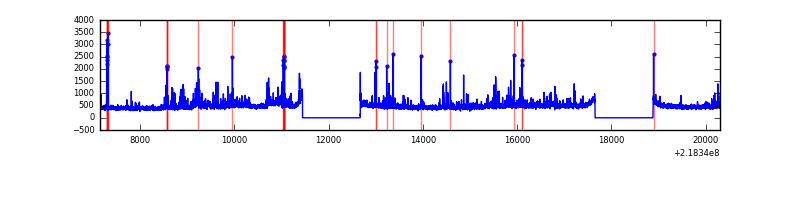 |
Top three noisy pixels from each quadrant. If the there are fewer than three noisy pixels in the level2.evt file, extra rows are filled as -1
| Pixel properties | Quadrant properties | ||||||
|---|---|---|---|---|---|---|---|
| Quadrant | DetID | PixID | Counts | Sigma | Mean | Median | Sigma |
| A | 15 | 174 | 213114 | 836.01 | 1270 | 1243 | 253.4 |
| A | 15 | 236 | 30183 | 114.19 | 1270 | 1243 | 253.4 |
| A | 8 | 15 | 22216 | 82.75 | 1270 | 1243 | 253.4 |
| B | 0 | 228 | 1477232 | 6334.05 | 1252 | 1225 | 233.0 |
| B | 0 | 229 | 213951 | 912.88 | 1252 | 1225 | 233.0 |
| B | 0 | 219 | 166489 | 709.2 | 1252 | 1225 | 233.0 |
| C | 4 | 254 | 31299 | 110.36 | 1203 | 1209 | 272.7 |
| C | 1 | 241 | 20194 | 69.63 | 1203 | 1209 | 272.7 |
| C | 13 | 61 | 9885 | 31.82 | 1203 | 1209 | 272.7 |
| D | 2 | 152 | 252996 | 856.8 | 1217 | 1178 | 293.9 |
| D | 12 | 221 | 125370 | 422.56 | 1217 | 1178 | 293.9 |
| D | 11 | 241 | 125302 | 422.33 | 1217 | 1178 | 293.9 |
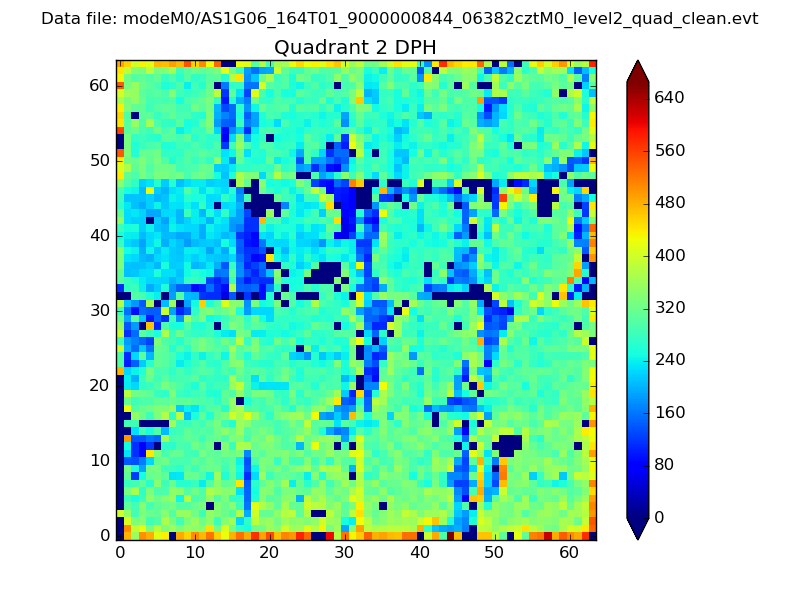
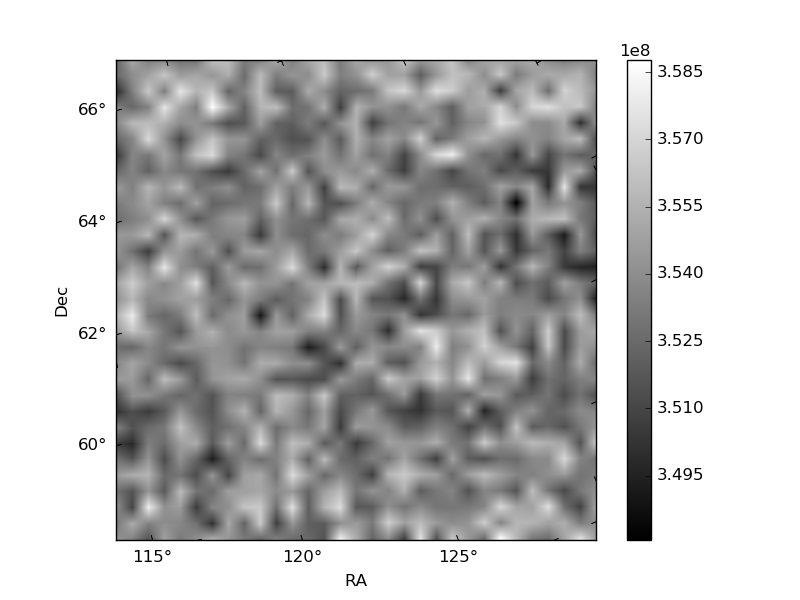
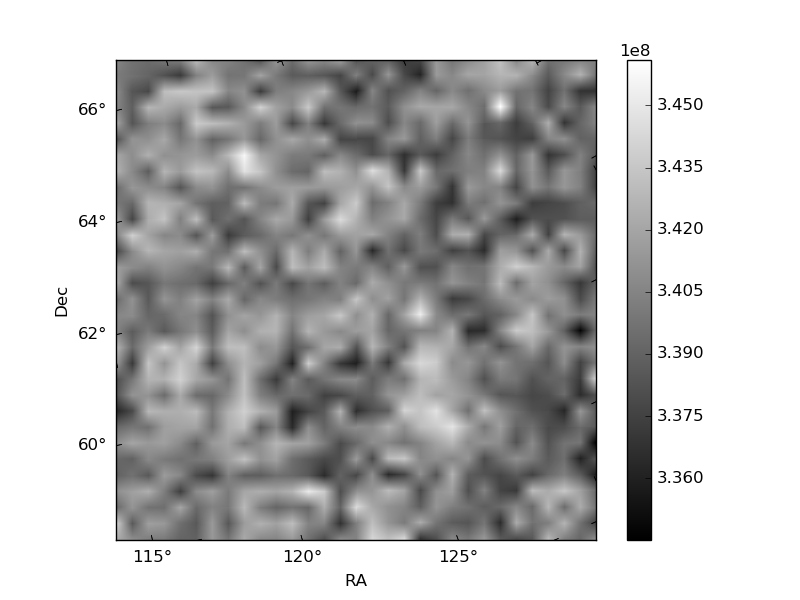
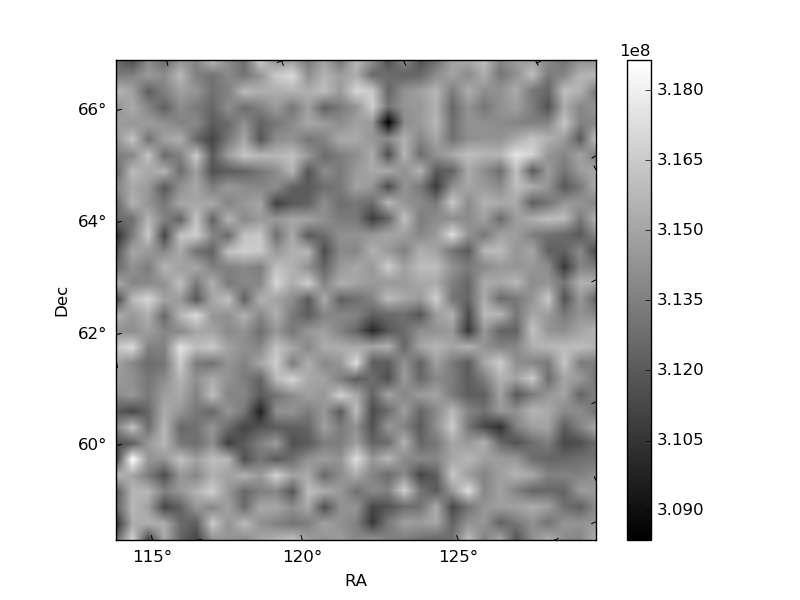
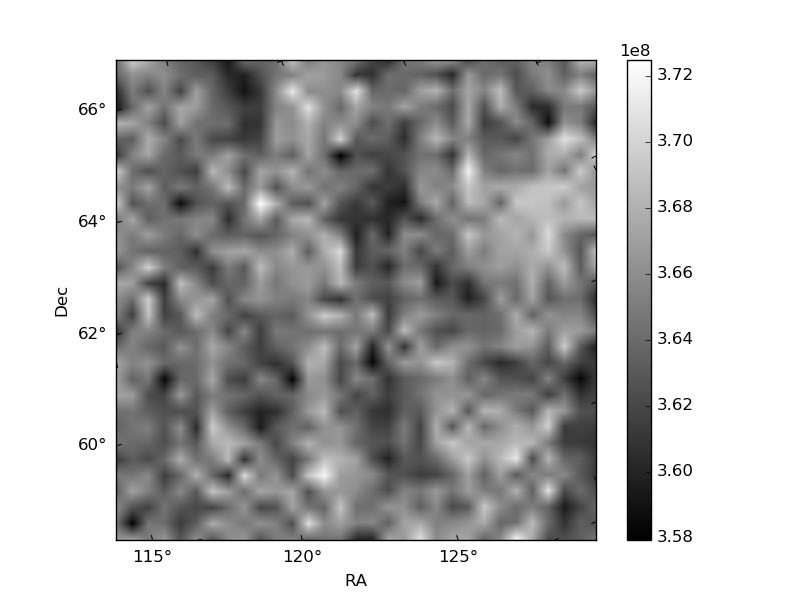
Histogram calculated using DETX and DETY for each event in the final _common_clean file
| Quadrant A | 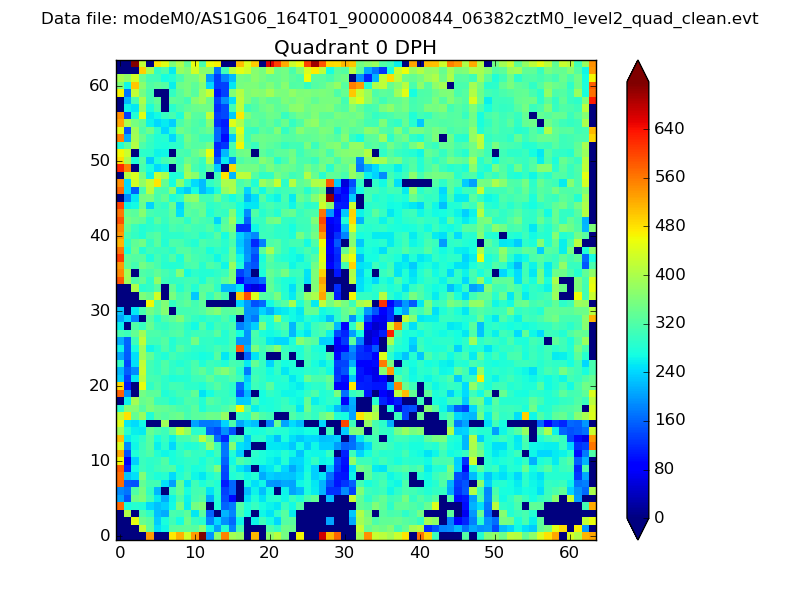 |
 |
Quadrant B |
|---|---|---|---|
| Quadrant D | 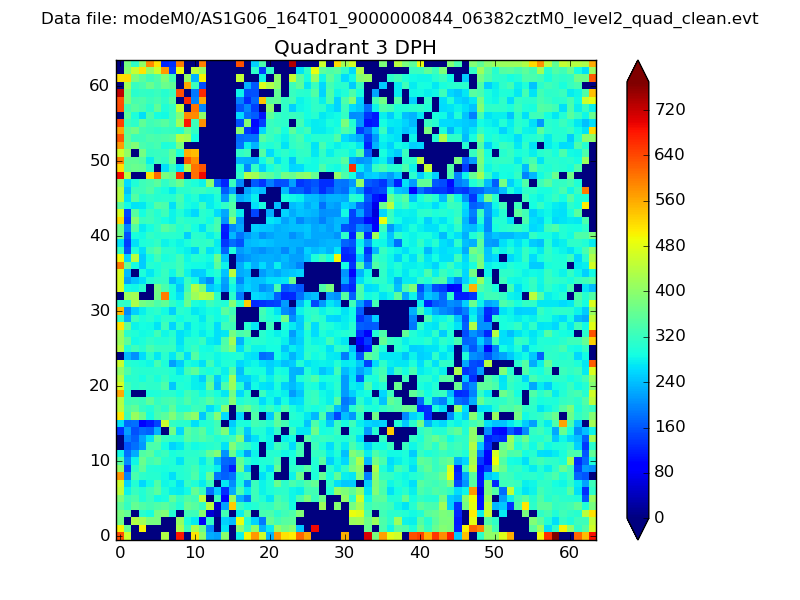 |
 |
Quadrant C |
| Plot type | Count rate plots | Images |
|---|---|---|
| Comparison with Poisson distribution Blue bars denote a histogram of data divided into 1 sec bins. Red curve is a Poisson curve with rate = median count rate of data. |
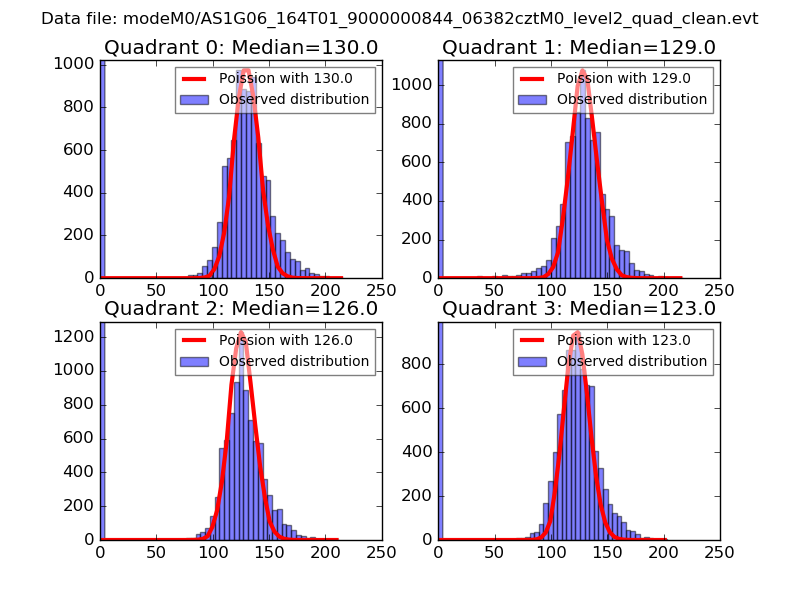 |
 |
| Quadrant-wise count rates Data is divided into 100 sec bins |
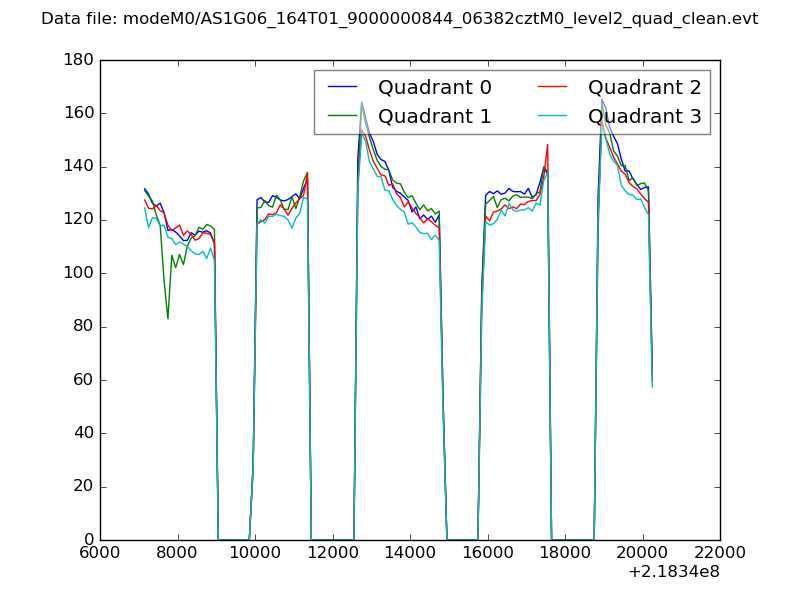 |
|
| Module-wise count rates for Quadrant A Data is divided into 100 sec bins |
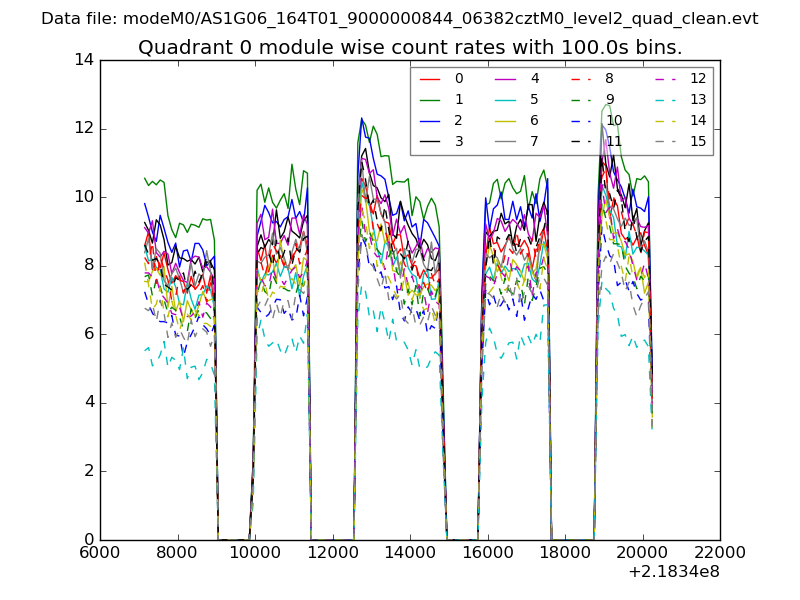 |
 |
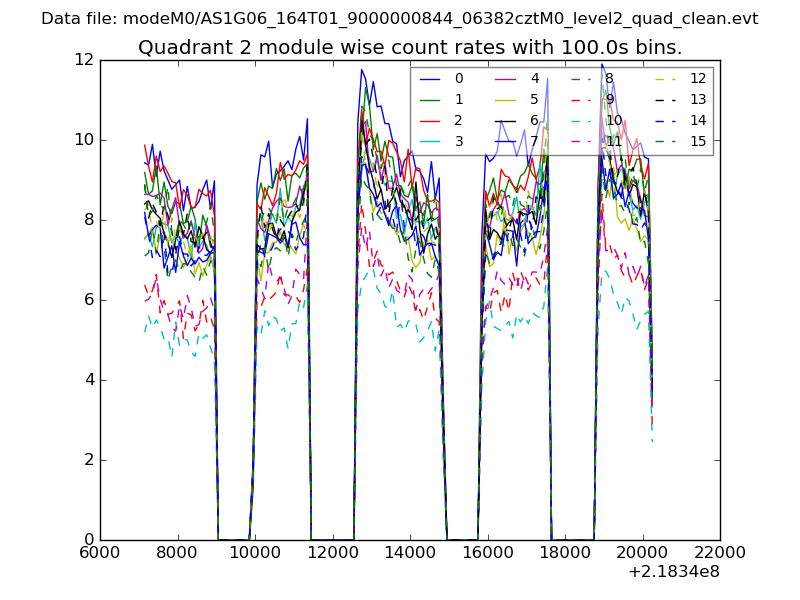
| Module-wise count rates for Quadrant B Data is divided into 100 sec bins |
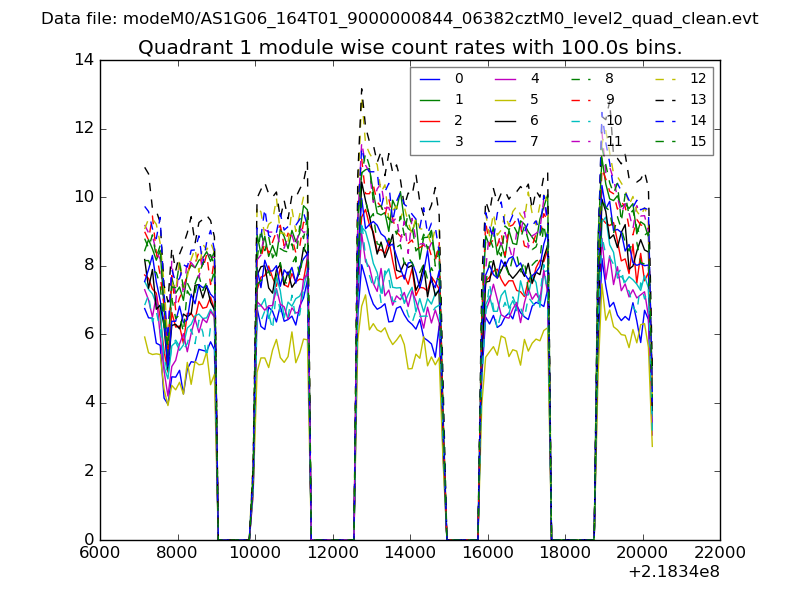 |
 |
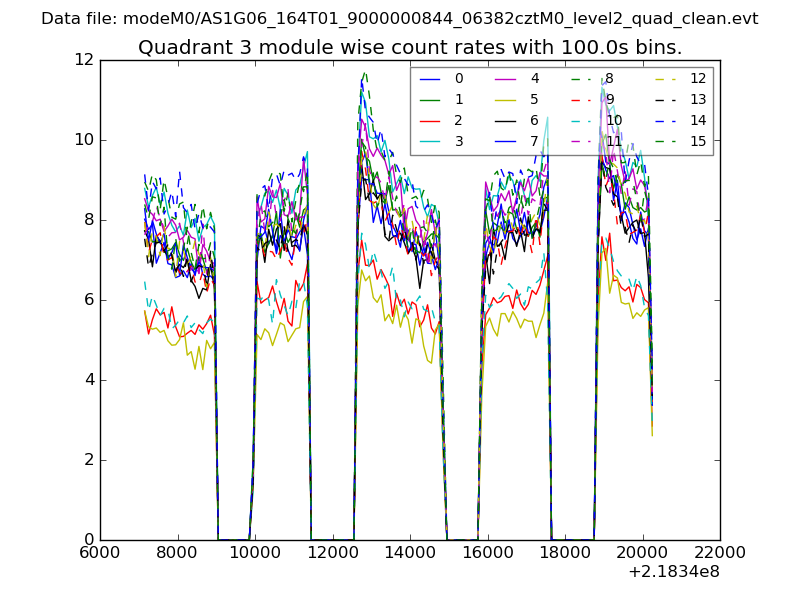
| Module-wise count rates for Quadrant C Data is divided into 100 sec bins |
 |
 |
| Module-wise count rates for Quadrant D Data is divided into 100 sec bins |
 |
 |
| Parameter | Plot |
|---|---|
| CZT HV Monitor | 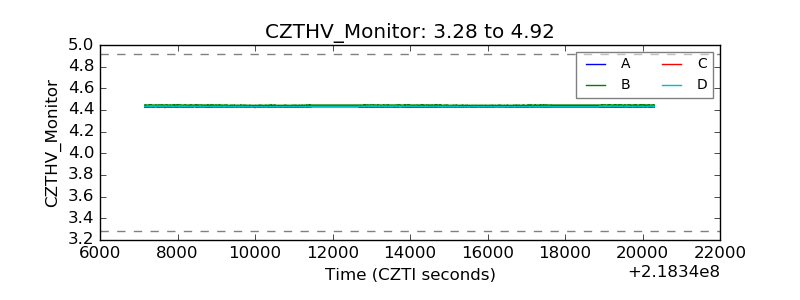 |
| D_VDD | 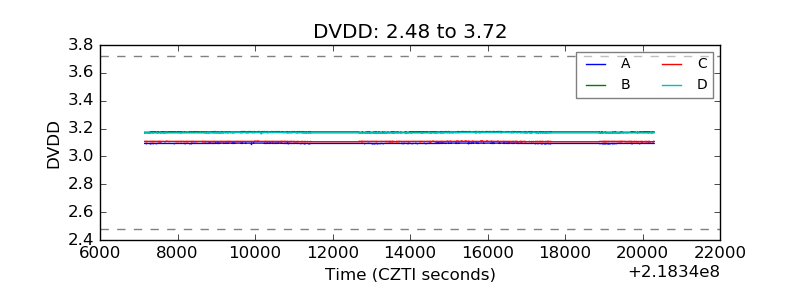 |
| Temperature 1 | 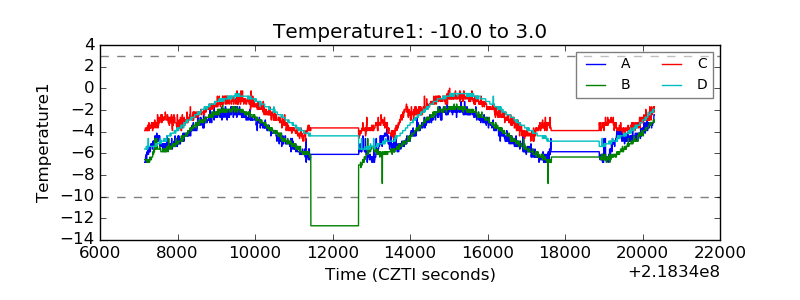 |
| Veto HV Monitor | 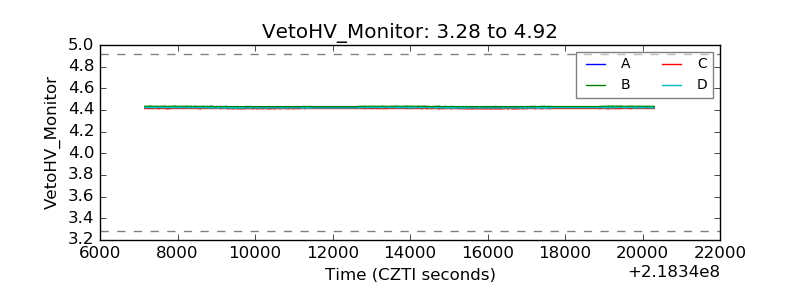 |
| Veto LLD | 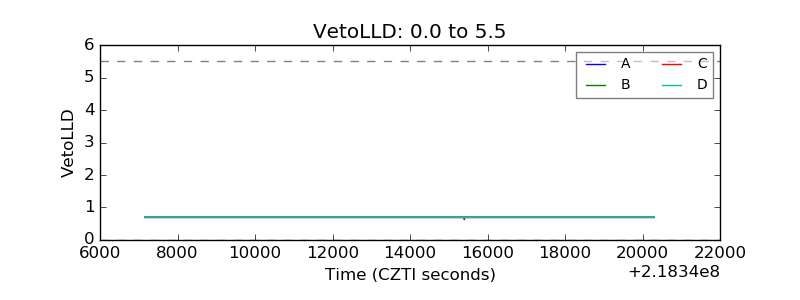 |
| Alpha Counter | 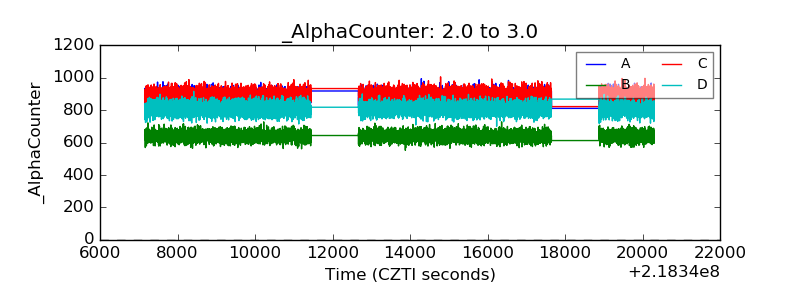 |
| _CPM_Rate | 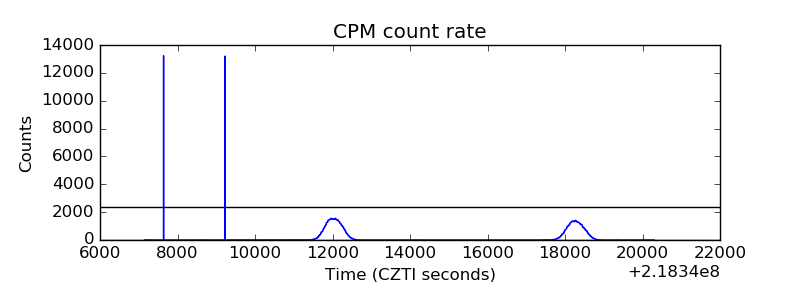 |
| CZT Counter |  |
| +2.5 Volts monitor |  |
| +5 Volts monitor |  |
| _ROLL_ROT | 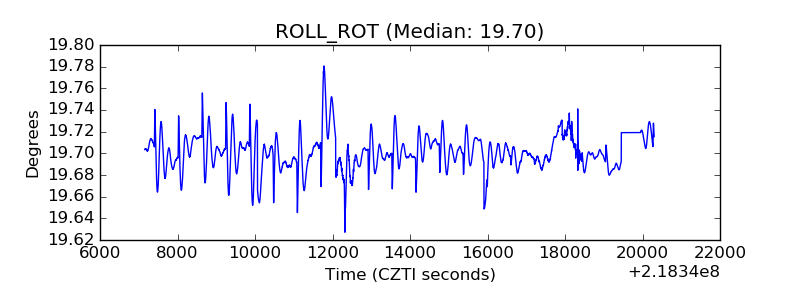 |
| _Roll_DEC | 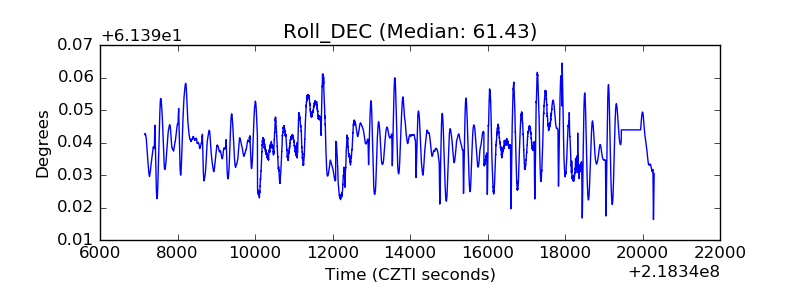 |
| _Roll_RA | 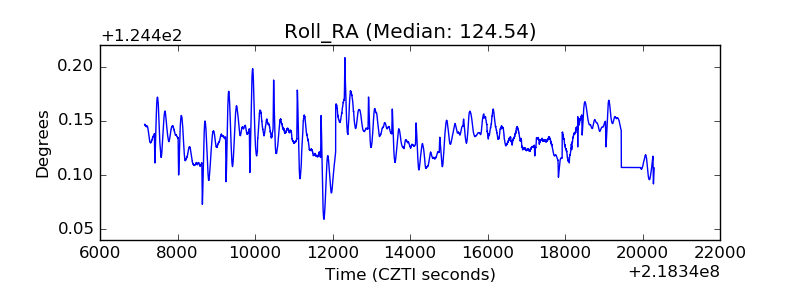 |
| Veto Counter | 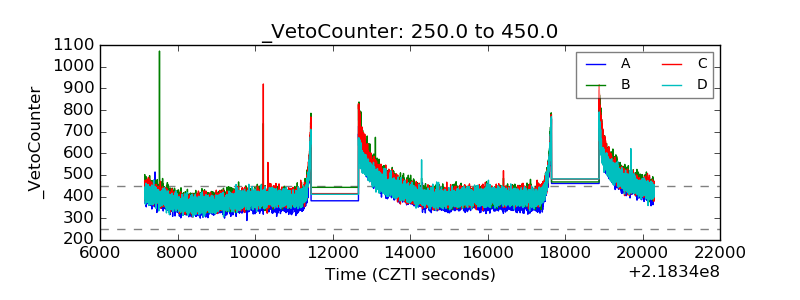 |