| Param | Original file | Final file |
|---|---|---|
| Filename | modeM0/AS1G06_164T01_9000000844_06383cztM0_level2.evt | modeM0/AS1G06_164T01_9000000844_06383cztM0_level2_quad_clean.evt |
| Size (bytes) | 434,439,360 | 103,343,040 |
| Size | 414.3 MB | 98.6 MB |
| Events in quadrant A | 3,447,921 | 688,318 |
| Events in quadrant B | 3,300,219 | 689,771 |
| Events in quadrant C | 2,785,341 | 671,259 |
| Events in quadrant D | 3,205,563 | 651,286 |
| Mode SS | |||
|---|---|---|---|
| Quadrant | BADHDUFLAG | Total packets | Discarded packets |
| A | 0 | 124 | 0 |
| B | 0 | 124 | 0 |
| C | 0 | 124 | 0 |
| D | 0 | 124 | 0 |
| Mode M0 | |||
|---|---|---|---|
| Quadrant | BADHDUFLAG | Total packets | Discarded packets |
| A | 0 | 14231 | 2 |
| B | 0 | 13729 | 1 |
| C | 0 | 12541 | 1 |
| D | 0 | 13491 | 1 |
| Mode M9 | |||
|---|---|---|---|
| Quadrant | BADHDUFLAG | Total packets | Discarded packets |
| A | 0 | 13 | 0 |
| B | 0 | 13 | 0 |
| C | 0 | 13 | 0 |
| D | 0 | 13 | 0 |
| Quadrant | Total seconds | Saturated seconds | Saturation percentage |
|---|---|---|---|
| A | 6153 | 107 | 1.738989% |
| B | 6153 | 97 | 1.576467% |
| C | 6153 | 30 | 0.487567% |
| D | 6153 | 61 | 0.991386% |
Noise dominated data is calculated using 1-second bins in cleaned event files. If a bin has >2000 counts, and if more than 50% of those come from <1% of pixels, then it is considered to be noise-dominated and hence unusable.
| Quadrant | # 1 sec bins | Bins with >0 counts | Bins with >2000 counts | High rate bins dominated by noise | Noise dominated (total time) | Noise dominated (detector-on time) | Marked lightcurve |
|---|---|---|---|---|---|---|---|
| A | 7413 | 6154 | 21 | 21 | 0.28% | 0.34% | 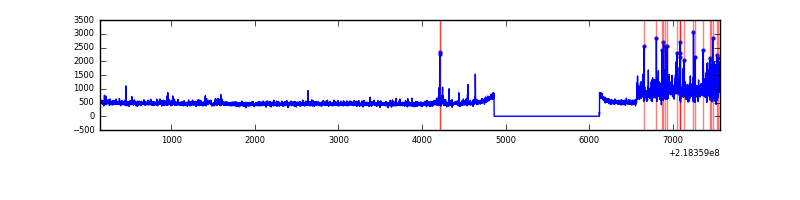 |
| B | 7413 | 6154 | 12 | 12 | 0.16% | 0.19% | 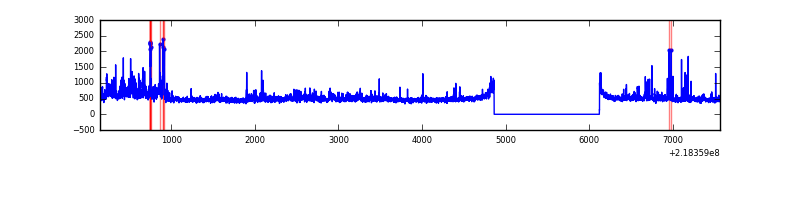 |
| C | 7413 | 6154 | 2 | 2 | 0.03% | 0.03% | 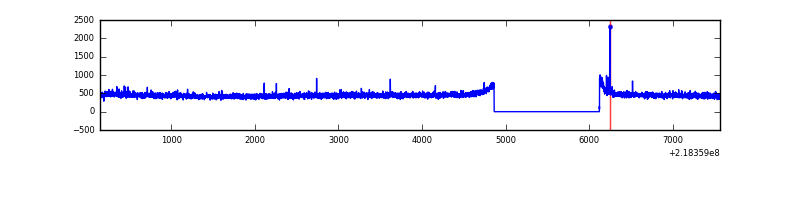 |
| D | 7413 | 6154 | 21 | 21 | 0.28% | 0.34% | 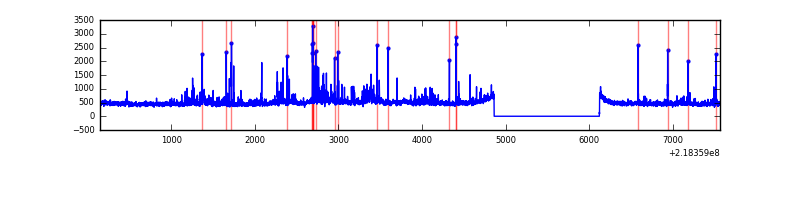 |
Top three noisy pixels from each quadrant. If the there are fewer than three noisy pixels in the level2.evt file, extra rows are filled as -1
| Pixel properties | Quadrant properties | ||||||
|---|---|---|---|---|---|---|---|
| Quadrant | DetID | PixID | Counts | Sigma | Mean | Median | Sigma |
| A | 8 | 15 | 511530 | 3436.93 | 740 | 725 | 148.6 |
| A | 15 | 174 | 66234 | 440.77 | 740 | 725 | 148.6 |
| A | 3 | 1 | 7999 | 48.94 | 740 | 725 | 148.6 |
| B | 0 | 229 | 234701 | 1697.57 | 734 | 718 | 137.8 |
| B | 0 | 219 | 94855 | 682.97 | 734 | 718 | 137.8 |
| B | 15 | 204 | 94029 | 676.98 | 734 | 718 | 137.8 |
| C | 9 | 54 | 20072 | 120.63 | 701 | 704 | 160.6 |
| C | 4 | 254 | 13479 | 79.57 | 701 | 704 | 160.6 |
| C | 1 | 241 | 12993 | 76.54 | 701 | 704 | 160.6 |
| D | 5 | 97 | 146946 | 845.66 | 713 | 690 | 172.9 |
| D | 11 | 241 | 131945 | 758.93 | 713 | 690 | 172.9 |
| D | 2 | 152 | 115928 | 666.32 | 713 | 690 | 172.9 |
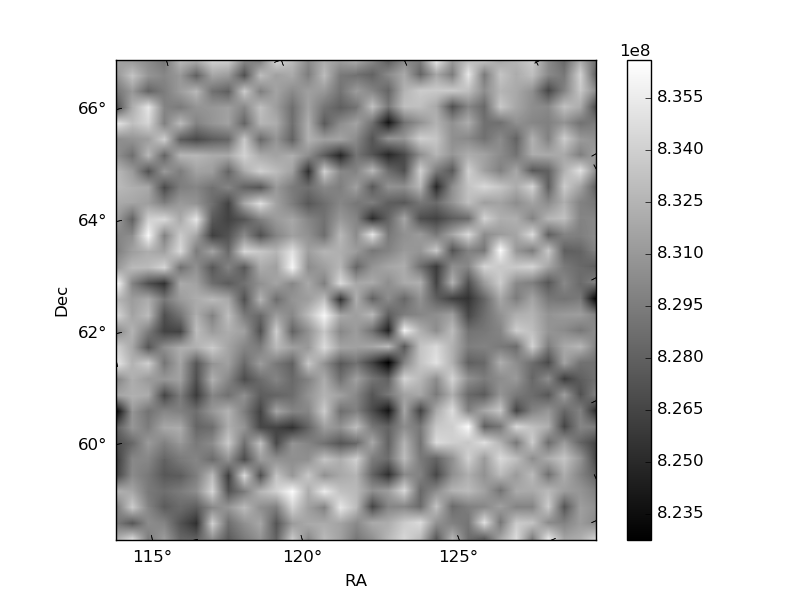
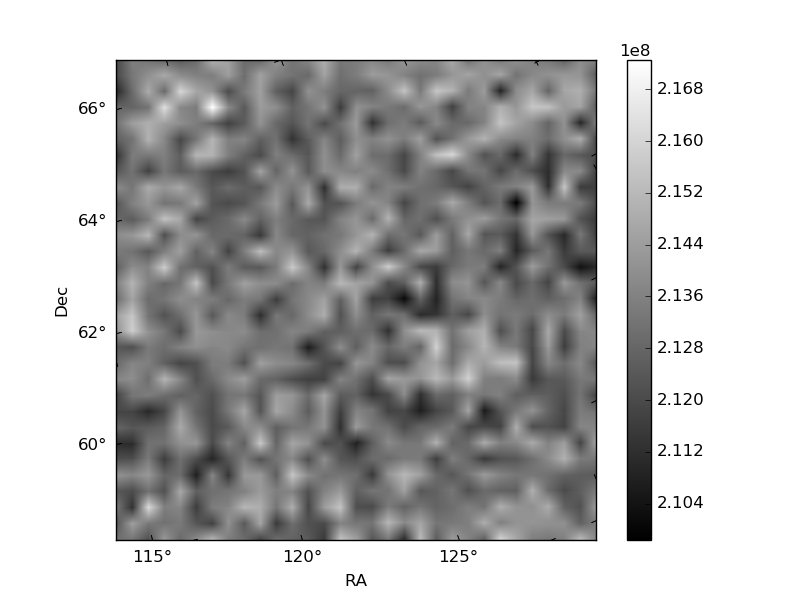
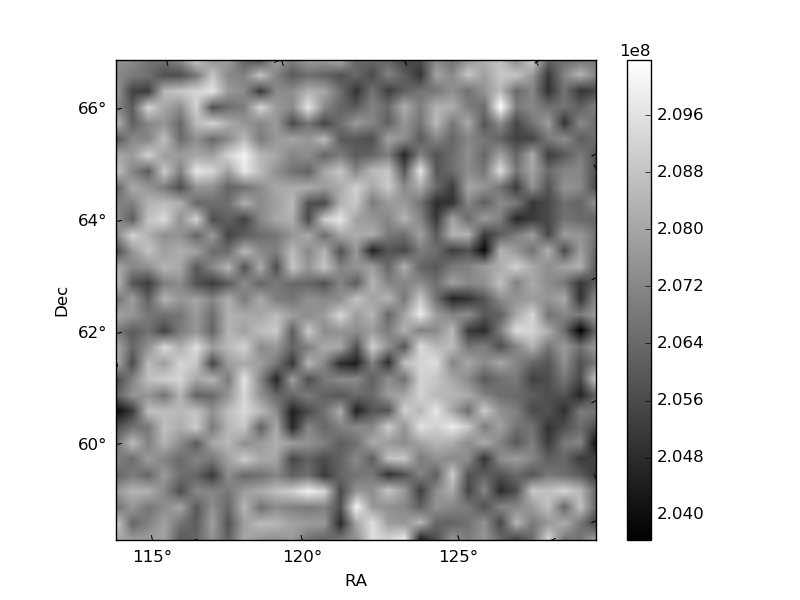
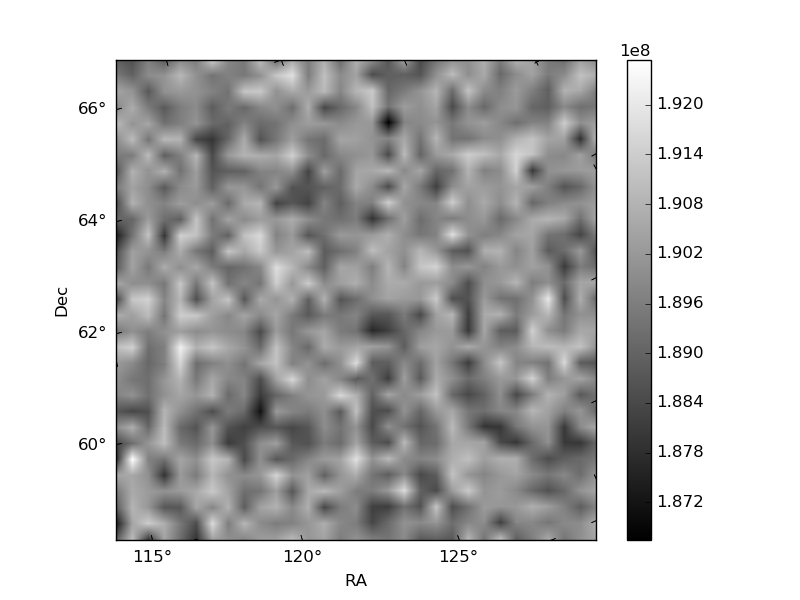
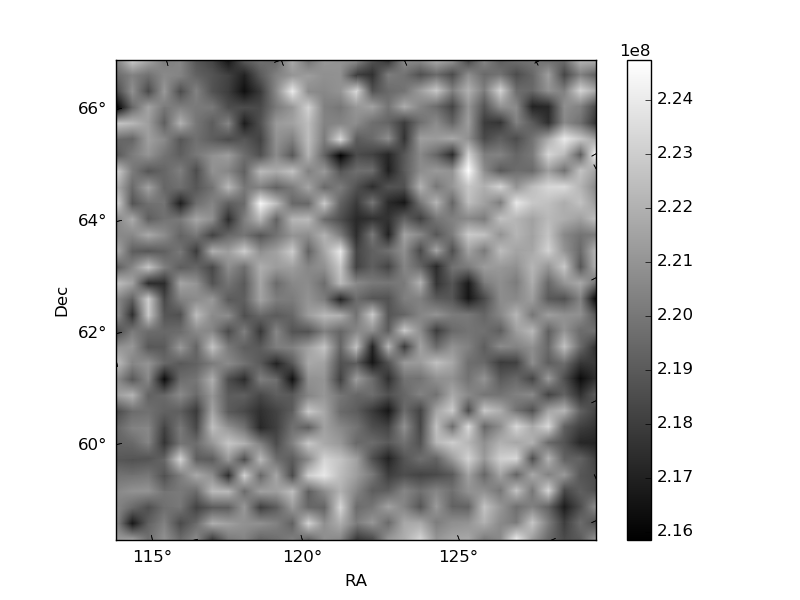
Histogram calculated using DETX and DETY for each event in the final _common_clean file
| Quadrant A | 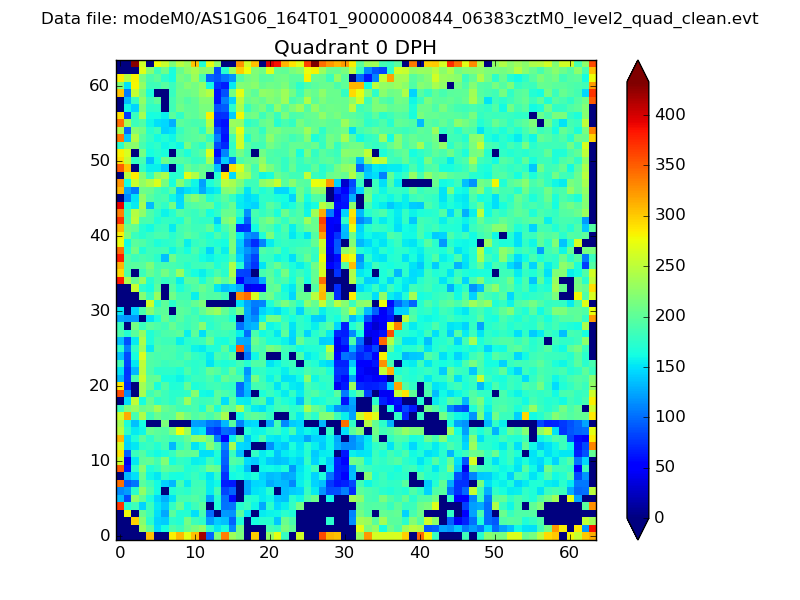 |
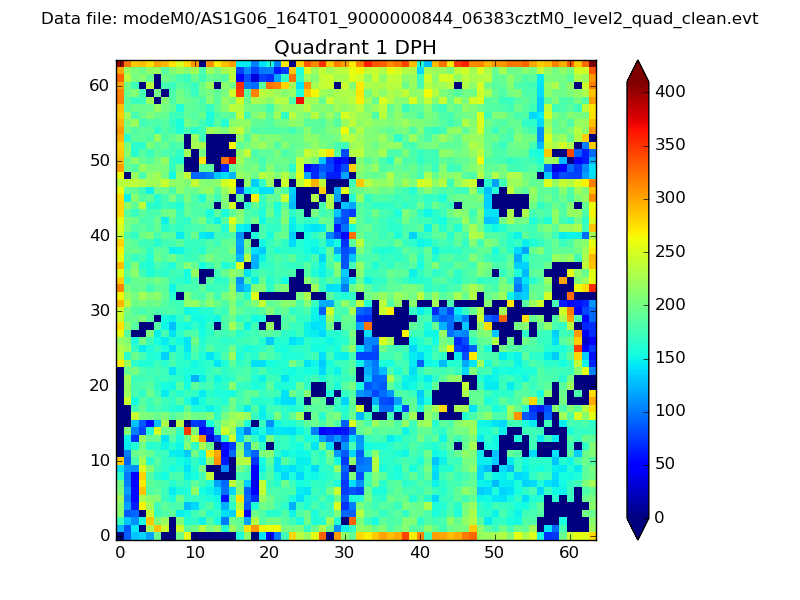 |
Quadrant B |
|---|---|---|---|
| Quadrant D | 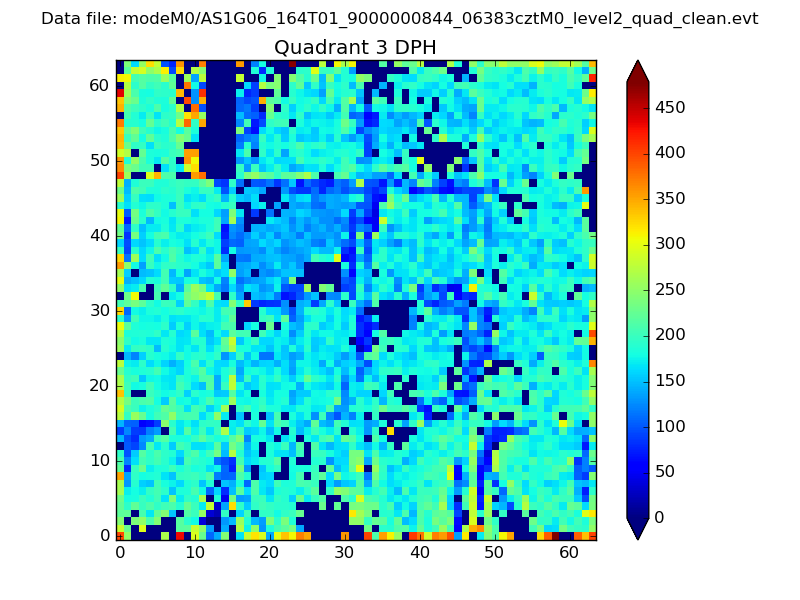 |
 |
Quadrant C |
| Plot type | Count rate plots | Images |
|---|---|---|
| Comparison with Poisson distribution Blue bars denote a histogram of data divided into 1 sec bins. Red curve is a Poisson curve with rate = median count rate of data. |
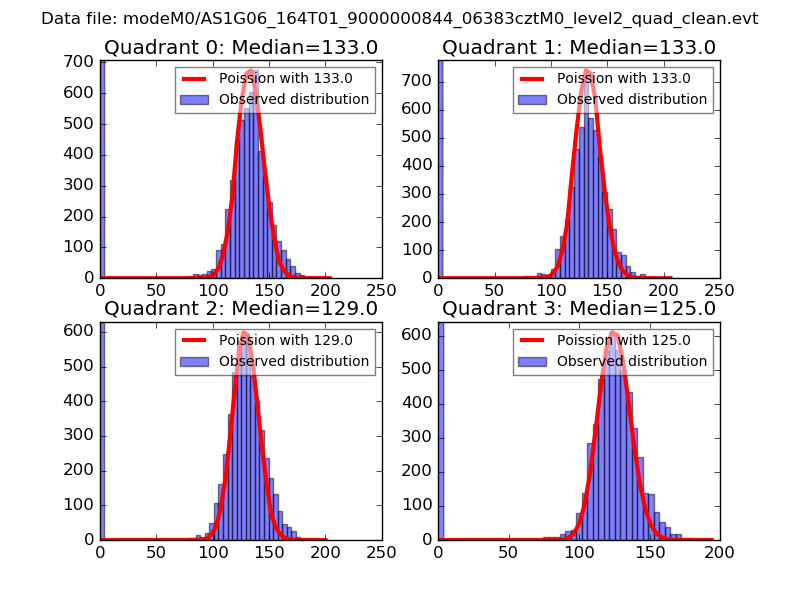 |
 |
| Quadrant-wise count rates Data is divided into 100 sec bins |
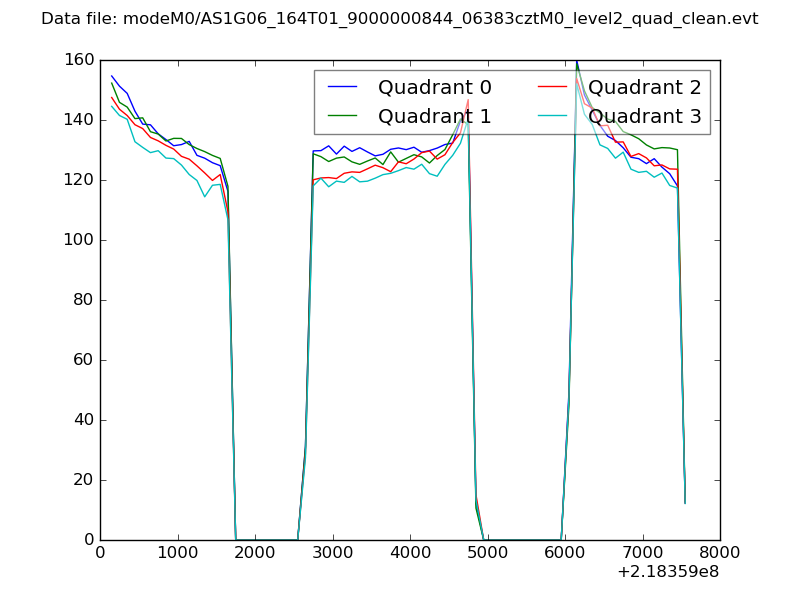 |
|
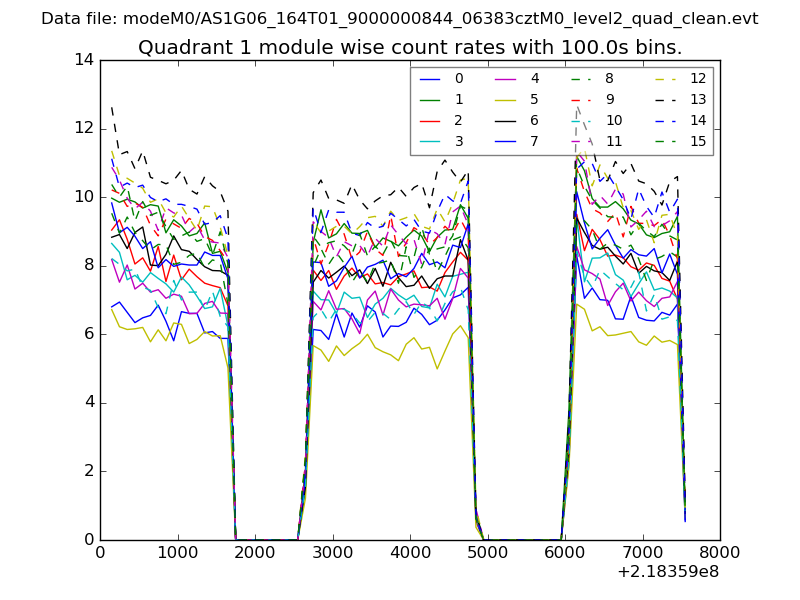
| Module-wise count rates for Quadrant A Data is divided into 100 sec bins |
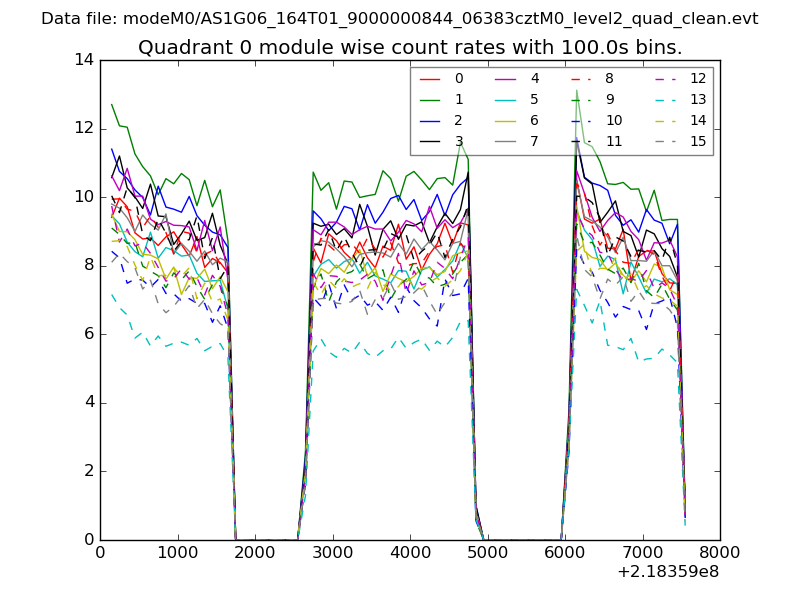 |
 |
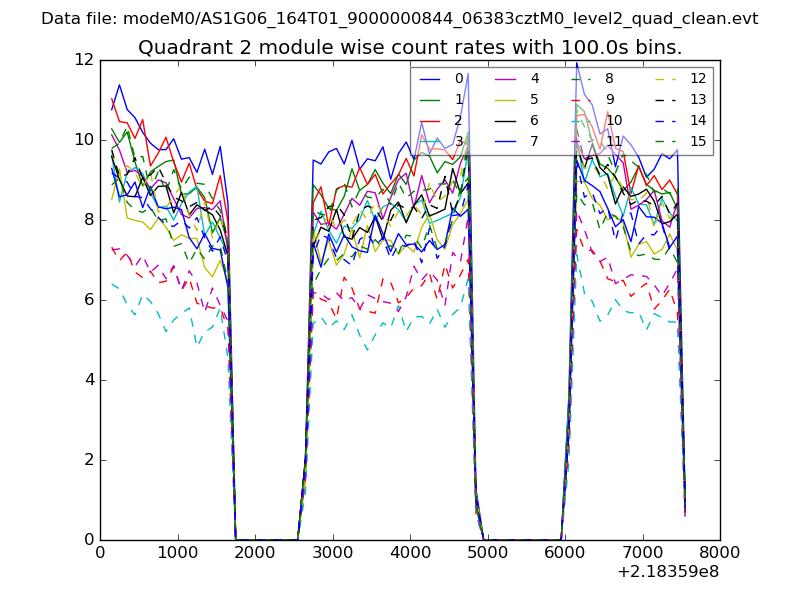
| Module-wise count rates for Quadrant B Data is divided into 100 sec bins |
 |
 |
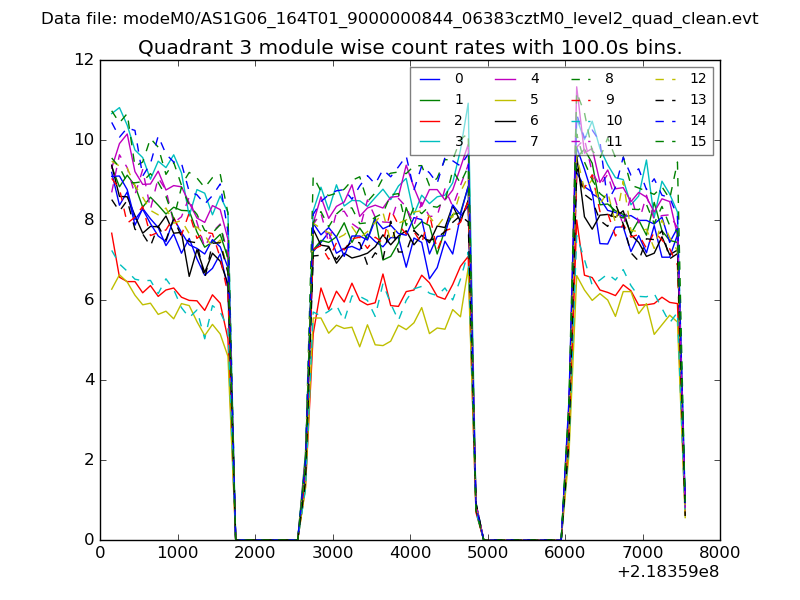
| Module-wise count rates for Quadrant C Data is divided into 100 sec bins |
 |
 |
| Module-wise count rates for Quadrant D Data is divided into 100 sec bins |
 |
 |
| Parameter | Plot |
|---|---|
| CZT HV Monitor | 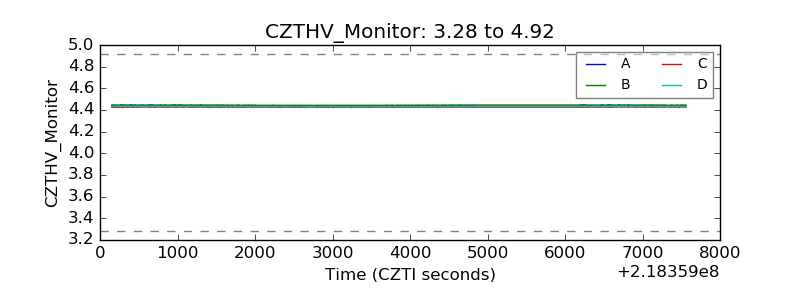 |
| D_VDD | 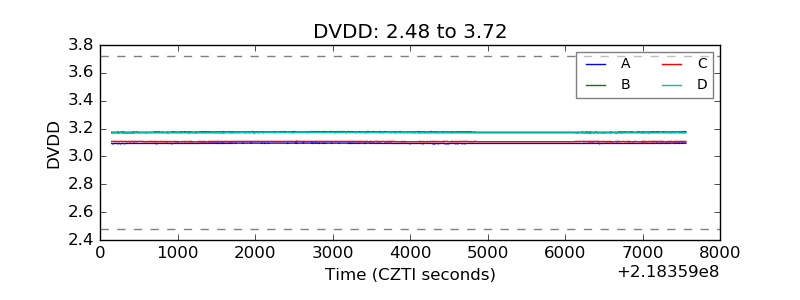 |
| Temperature 1 | 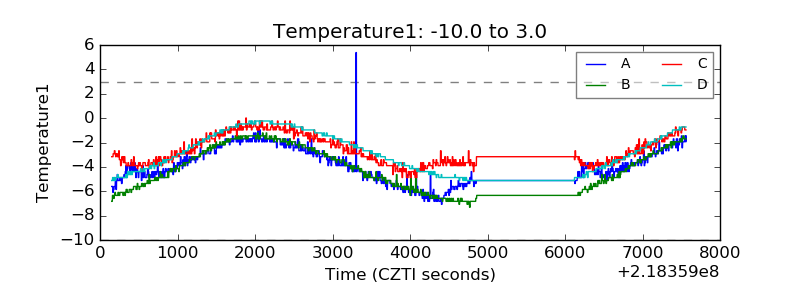 |
| Veto HV Monitor | 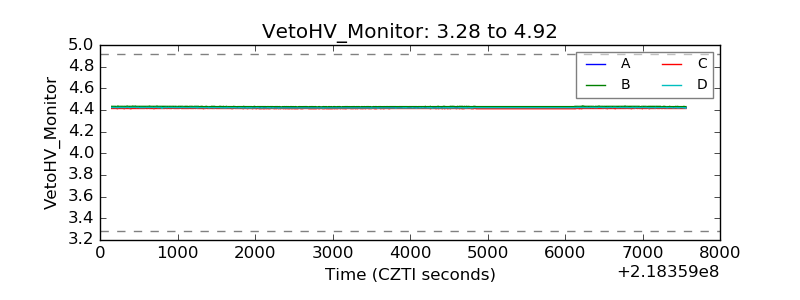 |
| Veto LLD | 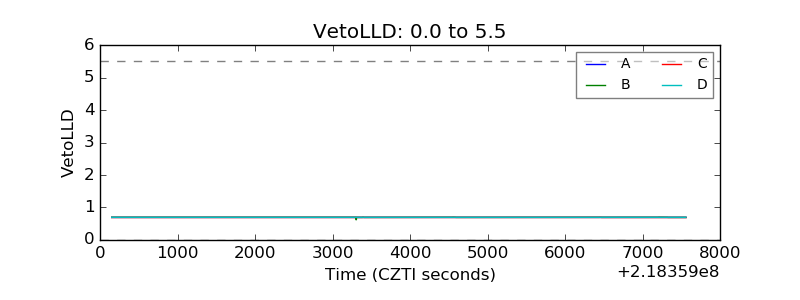 |
| Alpha Counter | 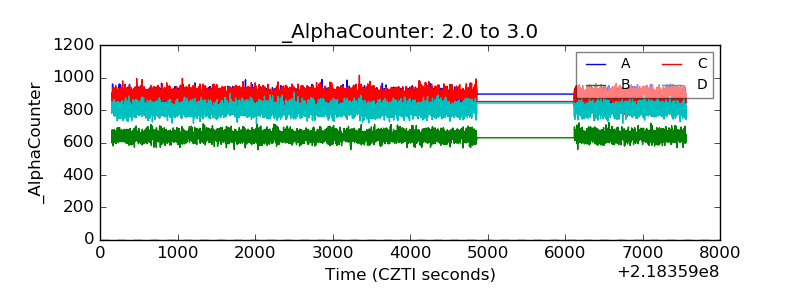 |
| _CPM_Rate | 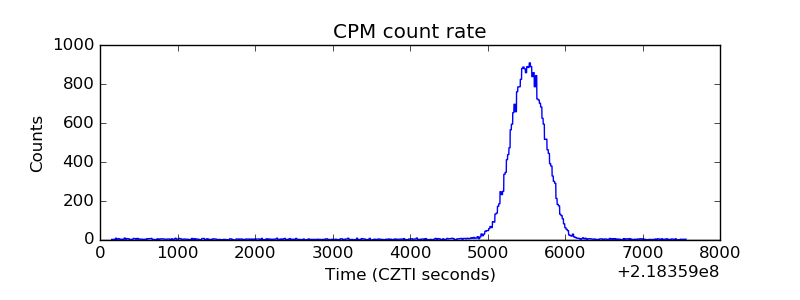 |
| CZT Counter |  |
| +2.5 Volts monitor |  |
| +5 Volts monitor |  |
| _ROLL_ROT | 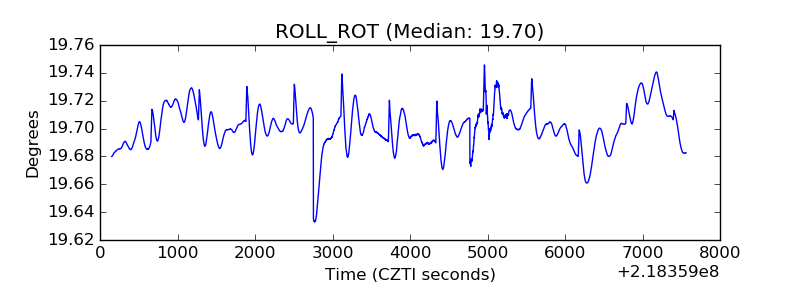 |
| _Roll_DEC | 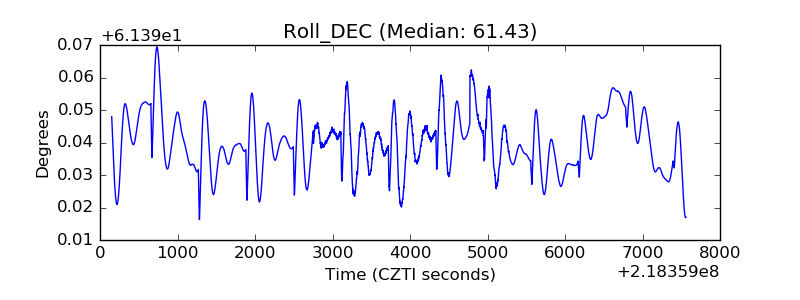 |
| _Roll_RA | 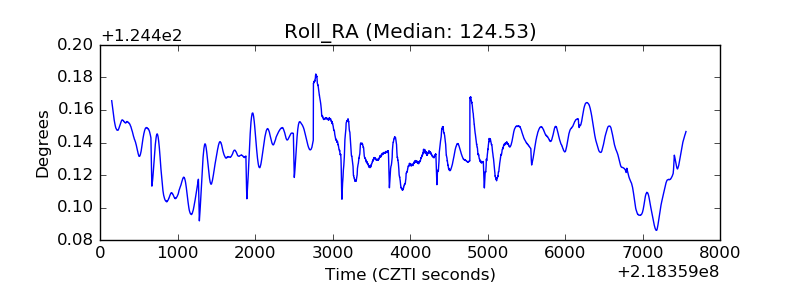 |
| Veto Counter | 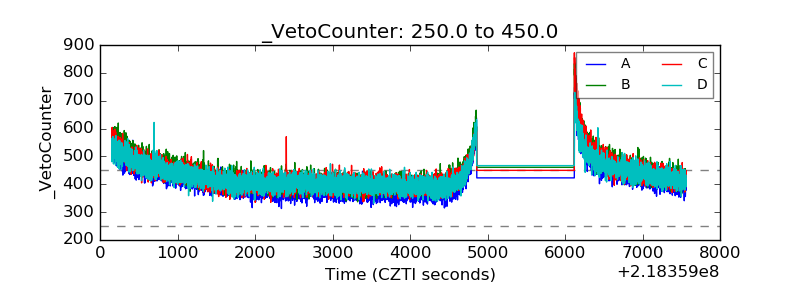 |