| Param | Original file | Final file |
|---|---|---|
| Filename | modeM0/AS1G06_164T01_9000000844_06384cztM0_level2.evt | modeM0/AS1G06_164T01_9000000844_06384cztM0_level2_quad_clean.evt |
| Size (bytes) | 535,605,120 | 96,108,480 |
| Size | 510.8 MB | 91.7 MB |
| Events in quadrant A | 5,966,721 | 610,901 |
| Events in quadrant B | 3,522,771 | 627,499 |
| Events in quadrant C | 2,924,715 | 617,544 |
| Events in quadrant D | 3,363,180 | 598,355 |
| Mode SS | |||
|---|---|---|---|
| Quadrant | BADHDUFLAG | Total packets | Discarded packets |
| A | 0 | 132 | 0 |
| B | 0 | 132 | 0 |
| C | 0 | 132 | 0 |
| D | 0 | 132 | 0 |
| Mode M0 | |||
|---|---|---|---|
| Quadrant | BADHDUFLAG | Total packets | Discarded packets |
| A | 0 | 22301 | 2 |
| B | 0 | 14717 | 1 |
| C | 0 | 13357 | 1 |
| D | 0 | 14248 | 1 |
| Mode M9 | |||
|---|---|---|---|
| Quadrant | BADHDUFLAG | Total packets | Discarded packets |
| A | 0 | 11 | 0 |
| B | 0 | 11 | 0 |
| C | 0 | 11 | 0 |
| D | 0 | 11 | 0 |
| Quadrant | Total seconds | Saturated seconds | Saturation percentage |
|---|---|---|---|
| A | 6539 | 549 | 8.395779% |
| B | 6539 | 215 | 3.287965% |
| C | 6539 | 92 | 1.406943% |
| D | 6539 | 145 | 2.217464% |
Noise dominated data is calculated using 1-second bins in cleaned event files. If a bin has >2000 counts, and if more than 50% of those come from <1% of pixels, then it is considered to be noise-dominated and hence unusable.
| Quadrant | # 1 sec bins | Bins with >0 counts | Bins with >2000 counts | High rate bins dominated by noise | Noise dominated (total time) | Noise dominated (detector-on time) | Marked lightcurve |
|---|---|---|---|---|---|---|---|
| A | 7654 | 6540 | 203 | 203 | 2.65% | 3.10% | 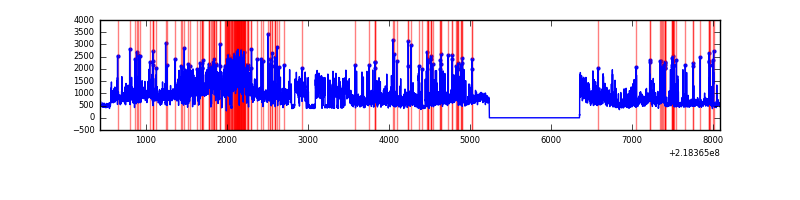 |
| B | 7654 | 6540 | 45 | 45 | 0.59% | 0.69% |  |
| C | 7654 | 6540 | 1 | 1 | 0.01% | 0.02% | 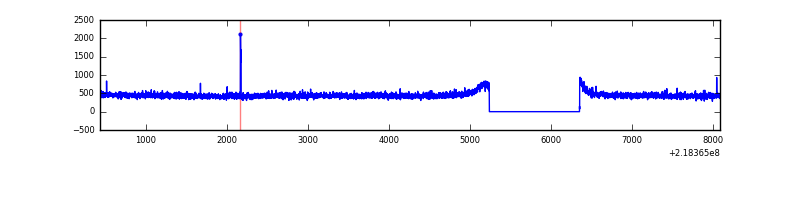 |
| D | 7654 | 6540 | 31 | 31 | 0.41% | 0.47% | 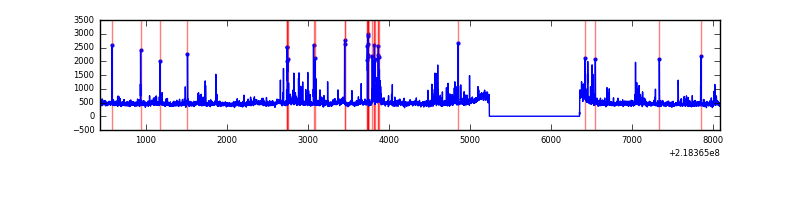 |
Top three noisy pixels from each quadrant. If the there are fewer than three noisy pixels in the level2.evt file, extra rows are filled as -1
| Pixel properties | Quadrant properties | ||||||
|---|---|---|---|---|---|---|---|
| Quadrant | DetID | PixID | Counts | Sigma | Mean | Median | Sigma |
| A | 8 | 15 | 2954881 | 19242.79 | 760 | 743 | 153.5 |
| A | 15 | 174 | 31554 | 200.7 | 760 | 743 | 153.5 |
| A | 13 | 251 | 30825 | 195.95 | 760 | 743 | 153.5 |
| B | 0 | 219 | 152162 | 1039.73 | 772 | 753 | 145.6 |
| B | 4 | 170 | 106210 | 724.18 | 772 | 753 | 145.6 |
| B | 4 | 172 | 81059 | 551.46 | 772 | 753 | 145.6 |
| C | 4 | 254 | 16012 | 89.79 | 744 | 745 | 170.0 |
| C | 13 | 61 | 5897 | 30.3 | 744 | 745 | 170.0 |
| C | 1 | 241 | 3608 | 16.84 | 744 | 745 | 170.0 |
| D | 2 | 152 | 135953 | 752.09 | 750 | 727 | 179.8 |
| D | 11 | 241 | 122478 | 677.15 | 750 | 727 | 179.8 |
| D | 5 | 97 | 92397 | 509.85 | 750 | 727 | 179.8 |
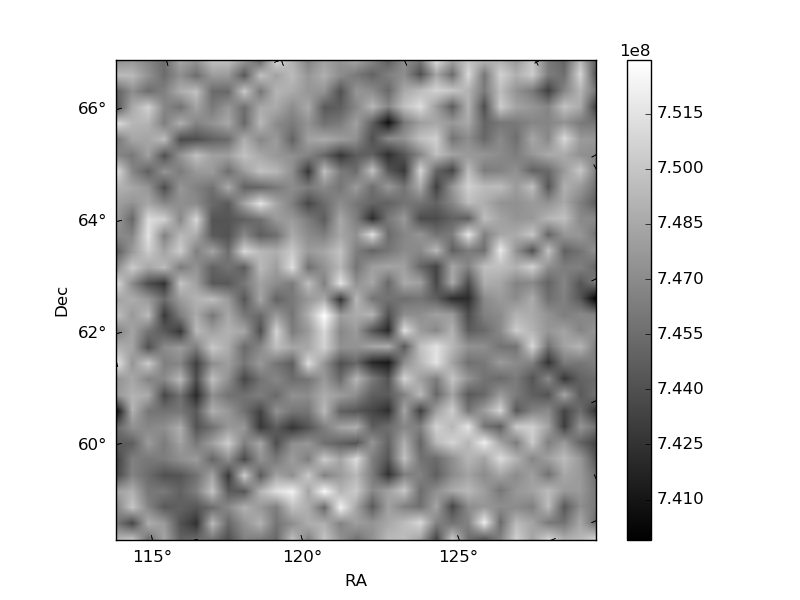
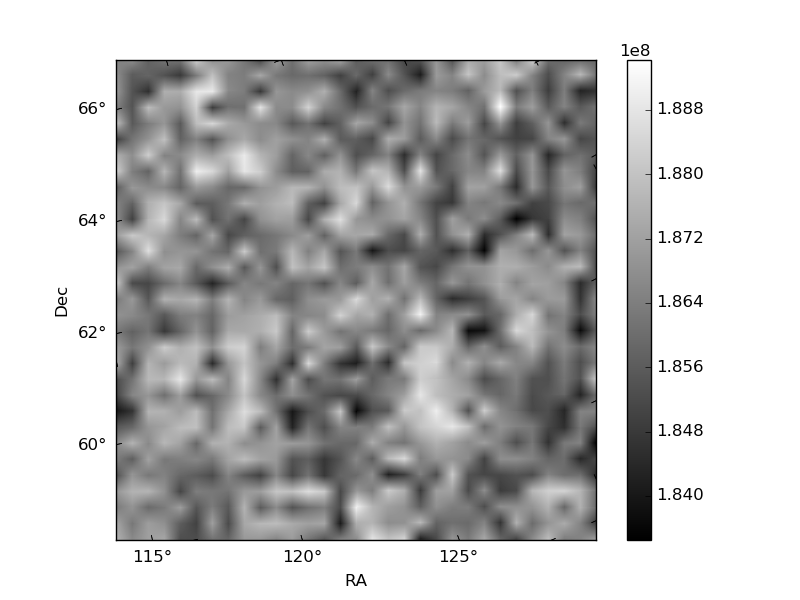
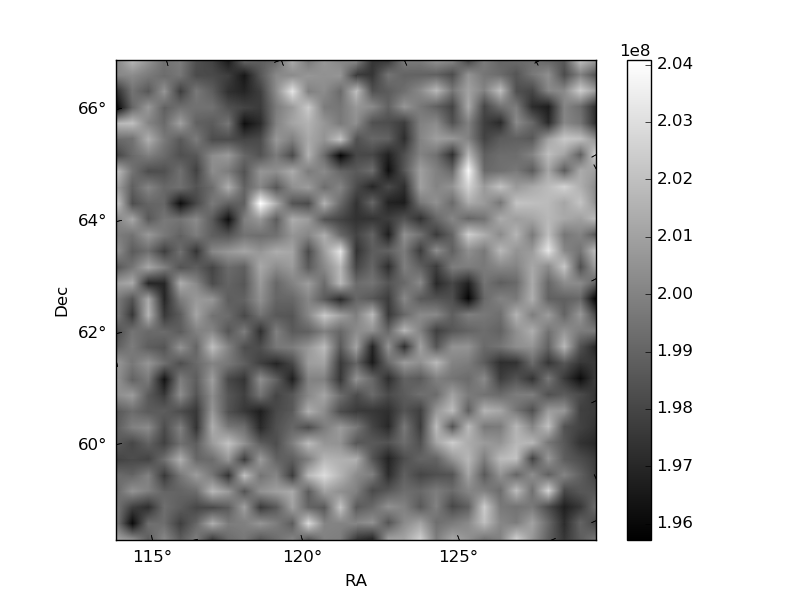
Histogram calculated using DETX and DETY for each event in the final _common_clean file
| Quadrant A | 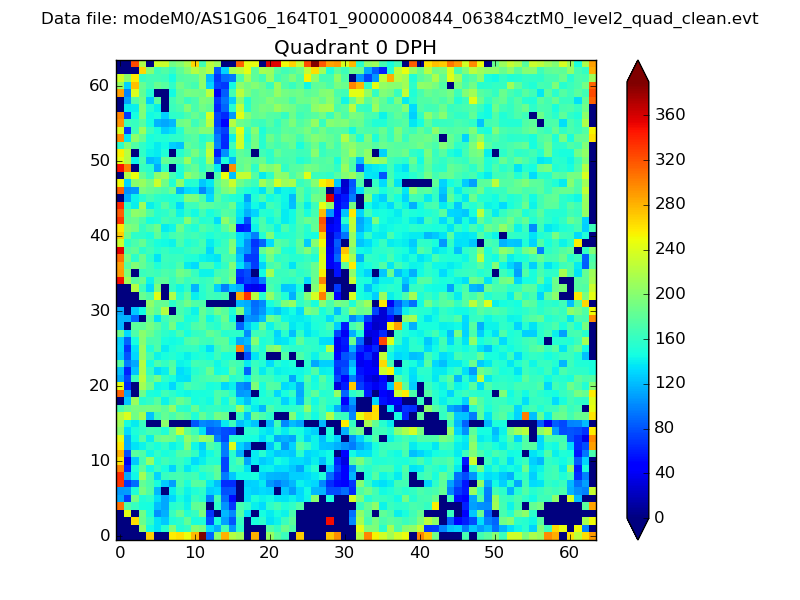 |
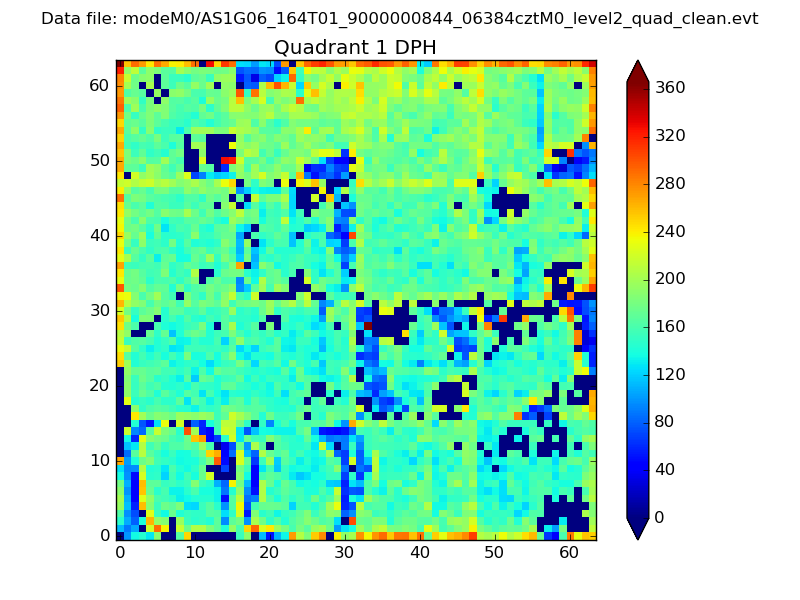 |
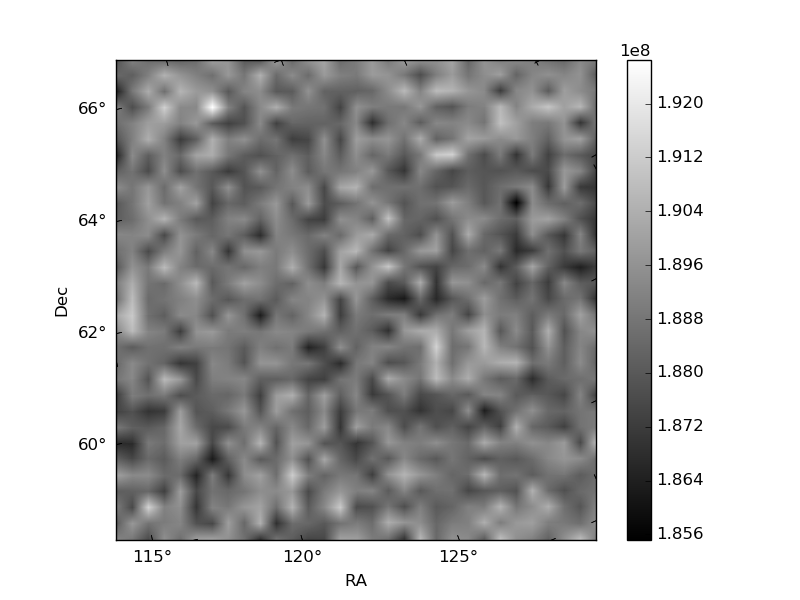
Quadrant B |
|---|---|---|---|
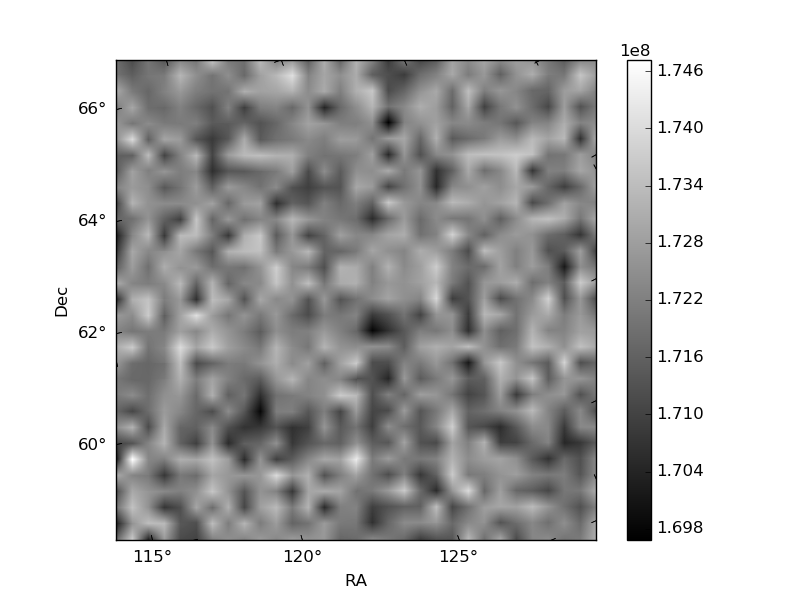
| Quadrant D | 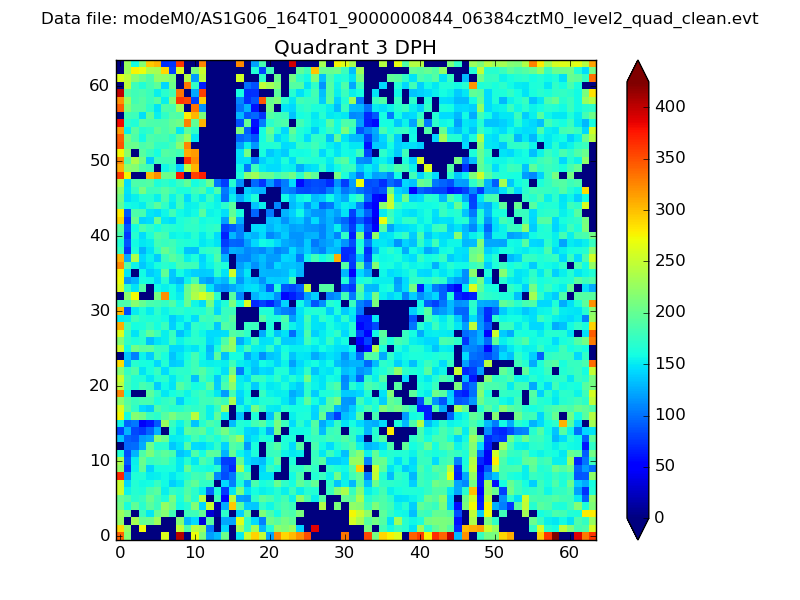 |
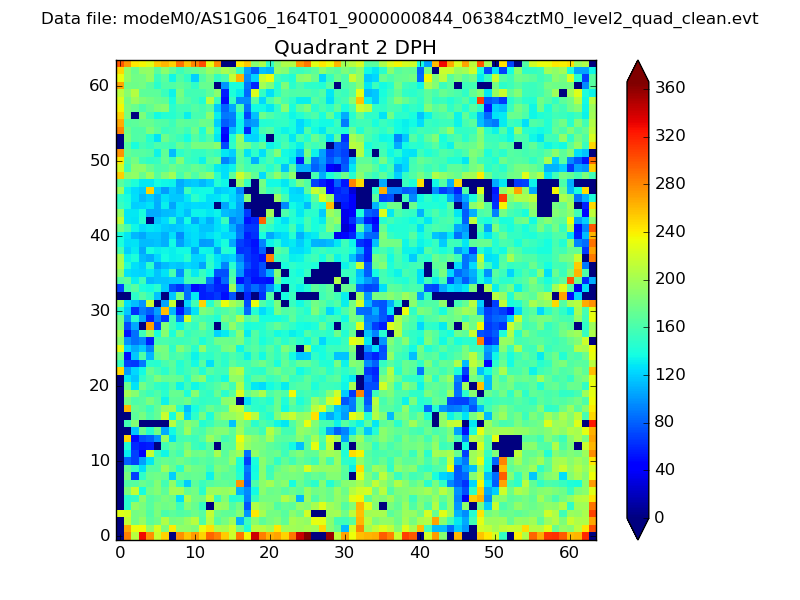 |
Quadrant C |
| Plot type | Count rate plots | Images |
|---|---|---|
| Comparison with Poisson distribution Blue bars denote a histogram of data divided into 1 sec bins. Red curve is a Poisson curve with rate = median count rate of data. |
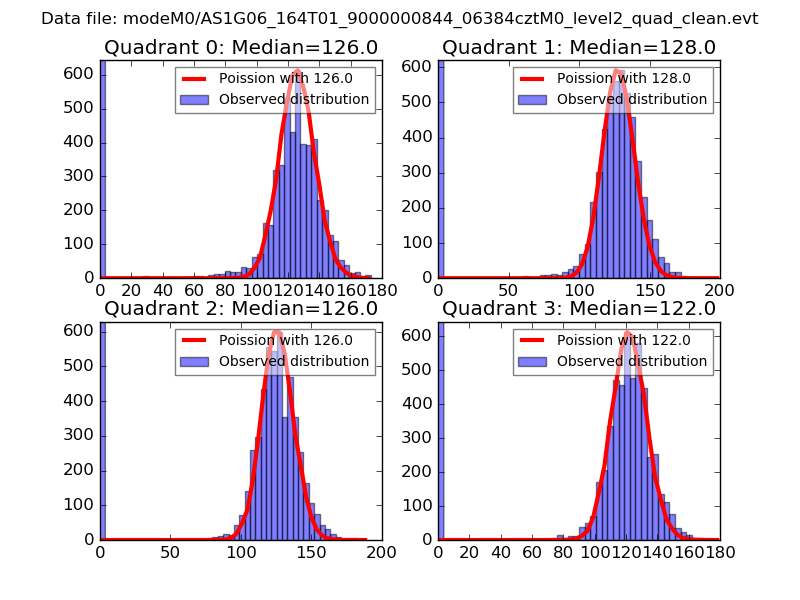 |
 |
| Quadrant-wise count rates Data is divided into 100 sec bins |
 |
|
| Module-wise count rates for Quadrant A Data is divided into 100 sec bins |
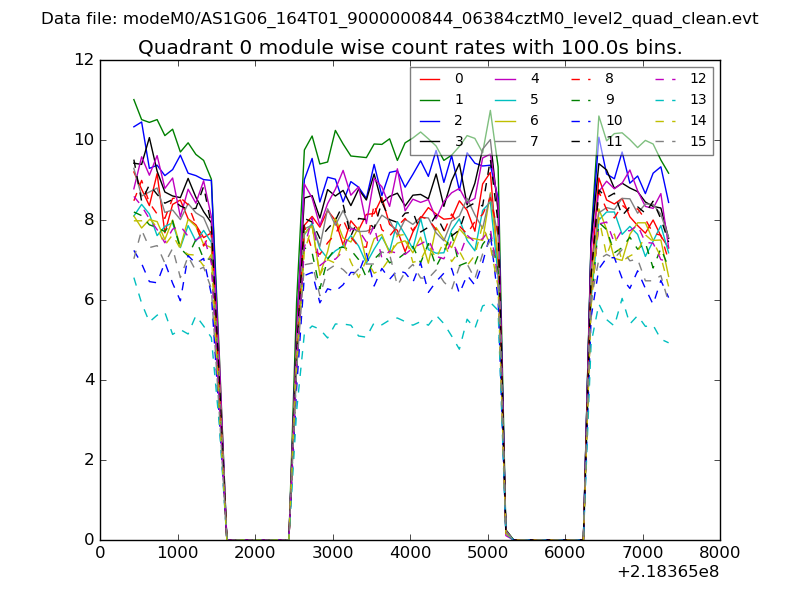 |
 |
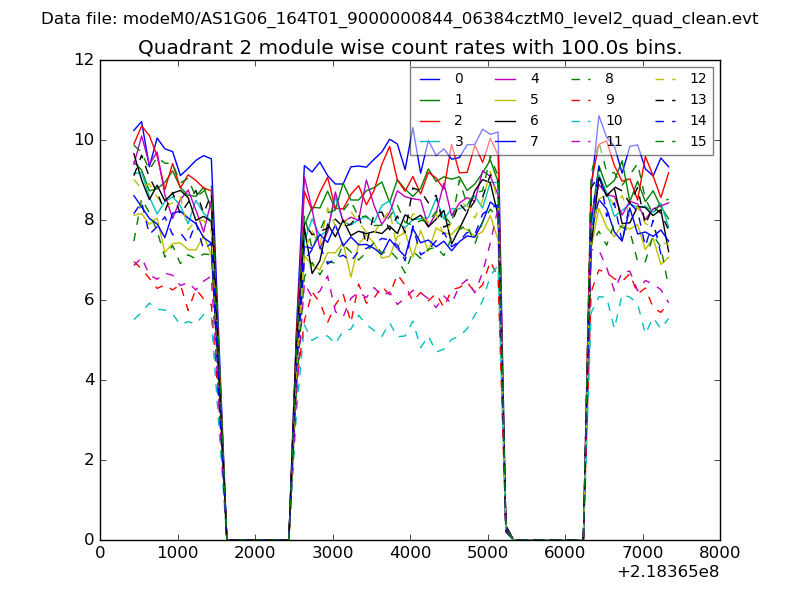
| Module-wise count rates for Quadrant B Data is divided into 100 sec bins |
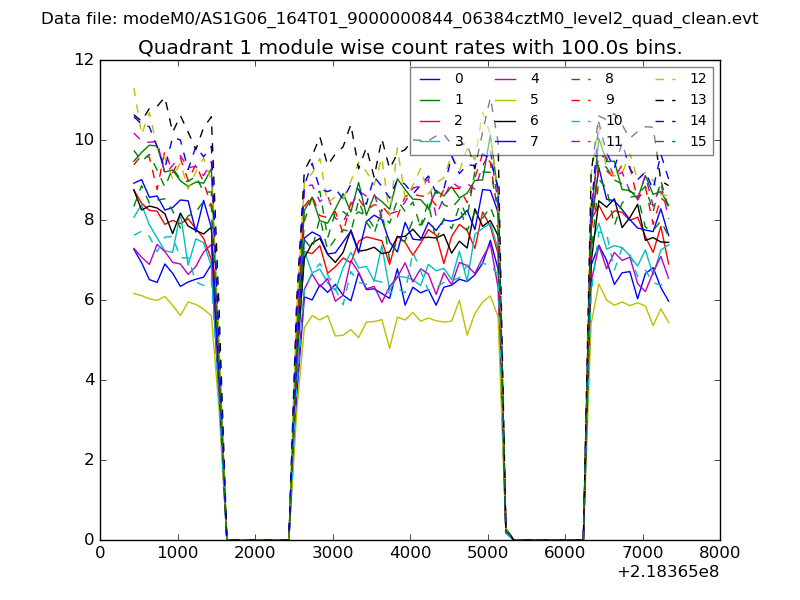 |
 |
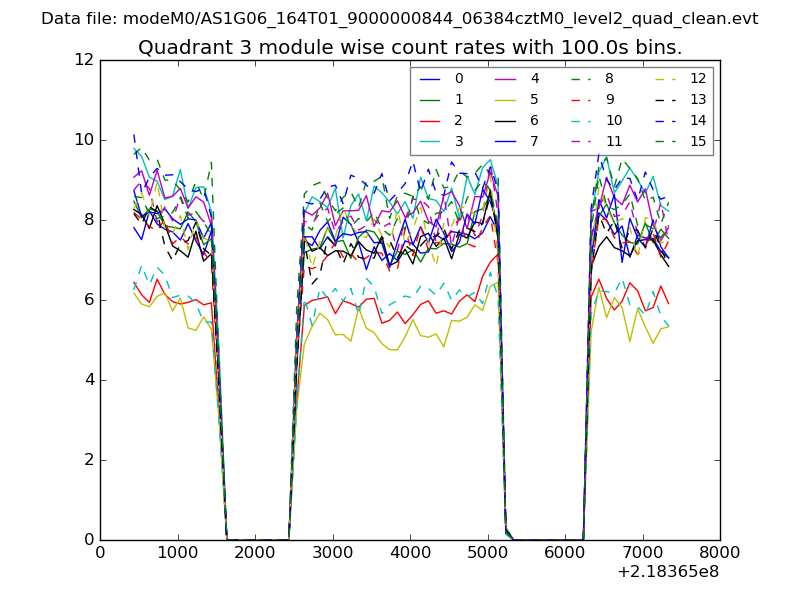
| Module-wise count rates for Quadrant C Data is divided into 100 sec bins |
 |
 |
| Module-wise count rates for Quadrant D Data is divided into 100 sec bins |
 |
 |
| Parameter | Plot |
|---|---|
| CZT HV Monitor | 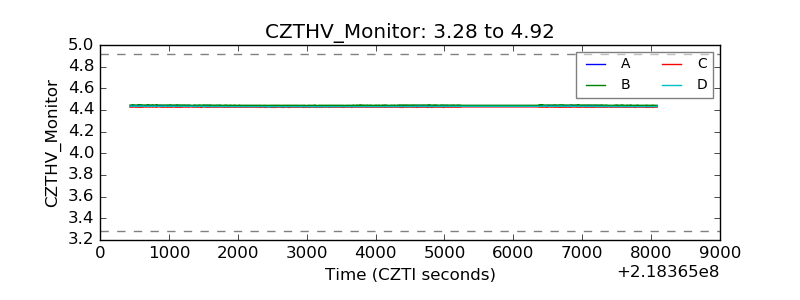 |
| D_VDD | 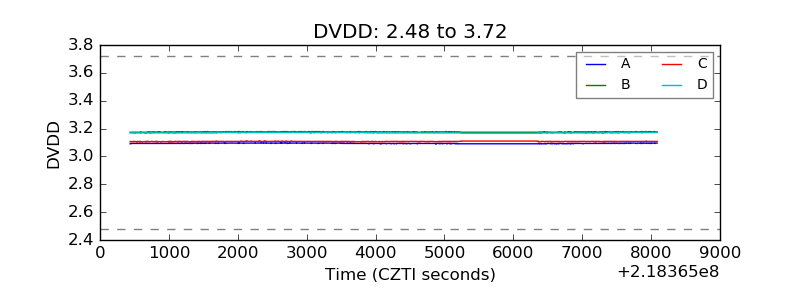 |
| Temperature 1 | 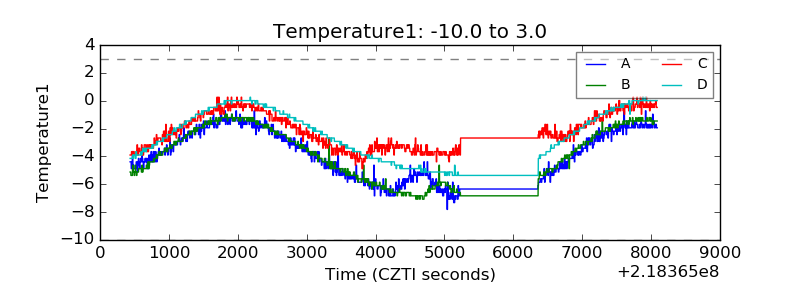 |
| Veto HV Monitor | 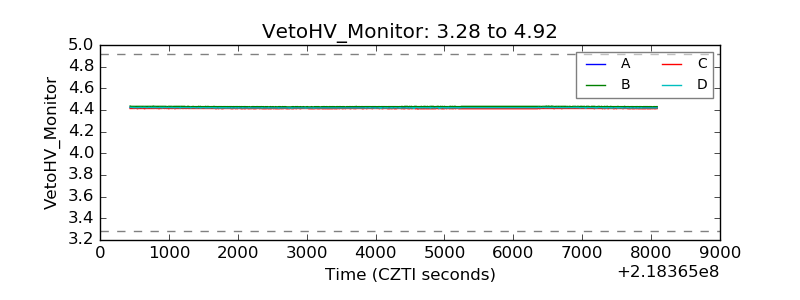 |
| Veto LLD | 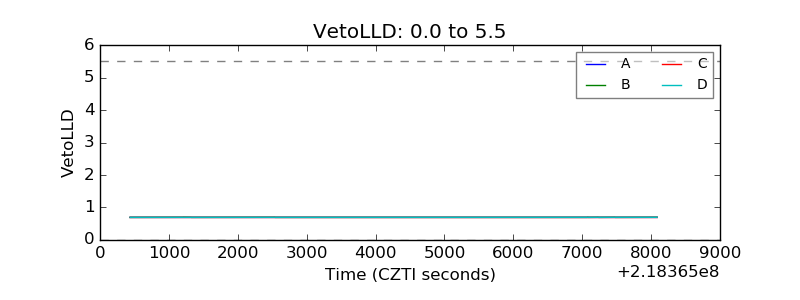 |
| Alpha Counter | 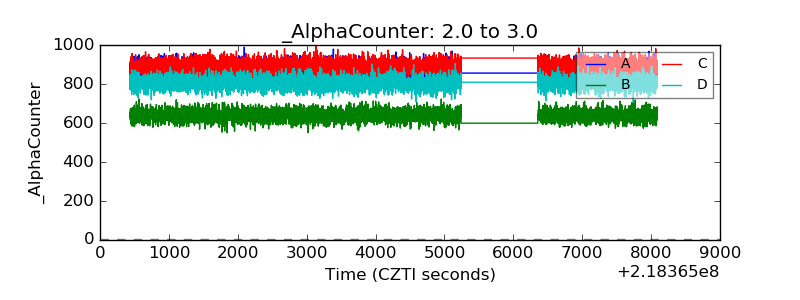 |
| _CPM_Rate | 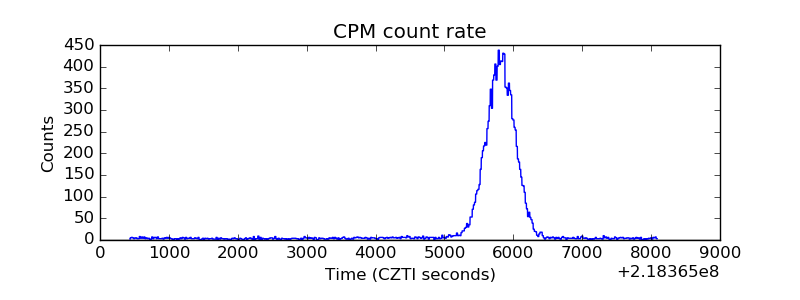 |
| CZT Counter | 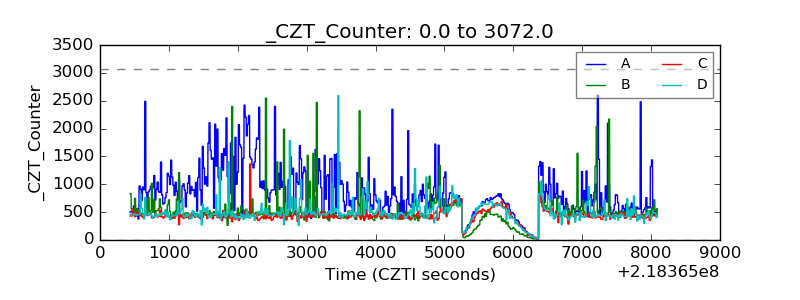 |
| +2.5 Volts monitor |  |
| +5 Volts monitor |  |
| _ROLL_ROT | 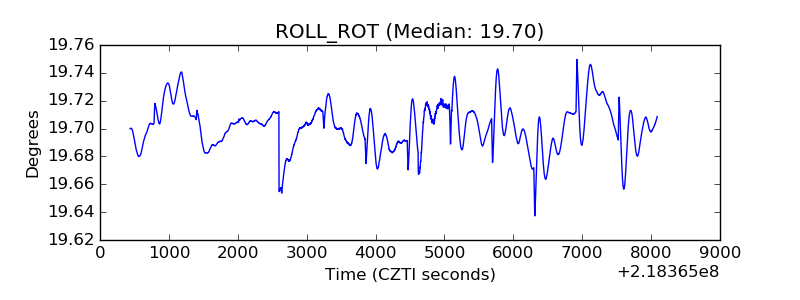 |
| _Roll_DEC | 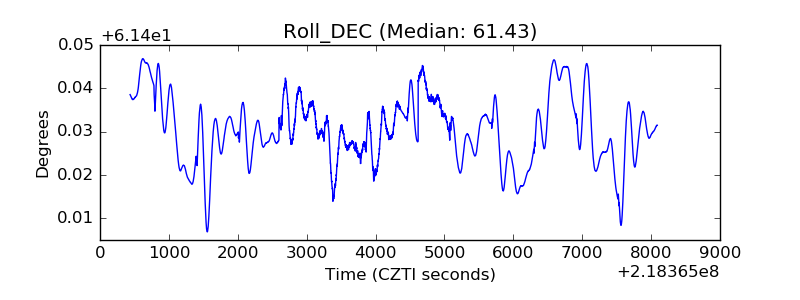 |
| _Roll_RA | 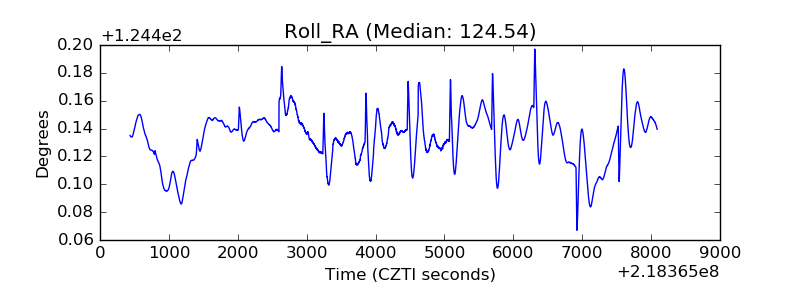 |
| Veto Counter | 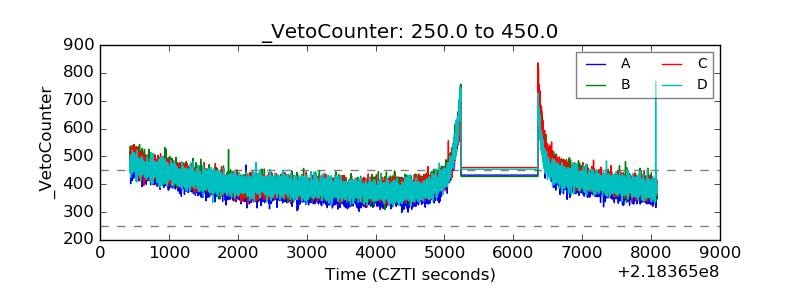 |