| Param | Original file | Final file |
|---|---|---|
| Filename | modeM0/AS1G06_164T01_9000000844_06386cztM0_level2.evt | modeM0/AS1G06_164T01_9000000844_06386cztM0_level2_quad_clean.evt |
| Size (bytes) | 473,584,320 | 90,910,080 |
| Size | 451.6 MB | 86.7 MB |
| Events in quadrant A | 4,169,102 | 570,899 |
| Events in quadrant B | 3,385,246 | 577,625 |
| Events in quadrant C | 3,017,196 | 569,828 |
| Events in quadrant D | 3,305,118 | 557,123 |
| Mode SS | |||
|---|---|---|---|
| Quadrant | BADHDUFLAG | Total packets | Discarded packets |
| A | 0 | 140 | 0 |
| B | 0 | 140 | 0 |
| C | 0 | 140 | 0 |
| D | 0 | 140 | 0 |
| Mode M0 | |||
|---|---|---|---|
| Quadrant | BADHDUFLAG | Total packets | Discarded packets |
| A | 0 | 16683 | 2 |
| B | 0 | 14747 | 1 |
| C | 0 | 14030 | 1 |
| D | 0 | 14782 | 1 |
| Mode M9 | |||
|---|---|---|---|
| Quadrant | BADHDUFLAG | Total packets | Discarded packets |
| A | 0 | 5 | 0 |
| B | 0 | 5 | 0 |
| C | 0 | 5 | 0 |
| D | 0 | 5 | 0 |
| Quadrant | Total seconds | Saturated seconds | Saturation percentage |
|---|---|---|---|
| A | 6850 | 262 | 3.824818% |
| B | 6850 | 135 | 1.970803% |
| C | 6850 | 74 | 1.080292% |
| D | 6850 | 122 | 1.781022% |
Noise dominated data is calculated using 1-second bins in cleaned event files. If a bin has >2000 counts, and if more than 50% of those come from <1% of pixels, then it is considered to be noise-dominated and hence unusable.
| Quadrant | # 1 sec bins | Bins with >0 counts | Bins with >2000 counts | High rate bins dominated by noise | Noise dominated (total time) | Noise dominated (detector-on time) | Marked lightcurve |
|---|---|---|---|---|---|---|---|
| A | 7375 | 6850 | 93 | 93 | 1.26% | 1.36% |  |
| B | 7375 | 6851 | 26 | 26 | 0.35% | 0.38% | 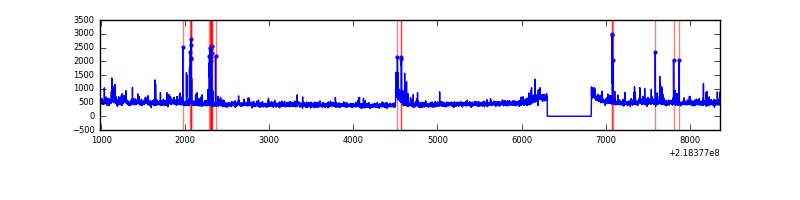 |
| C | 7375 | 6851 | 6 | 6 | 0.08% | 0.09% |  |
| D | 7375 | 6851 | 34 | 34 | 0.46% | 0.50% | 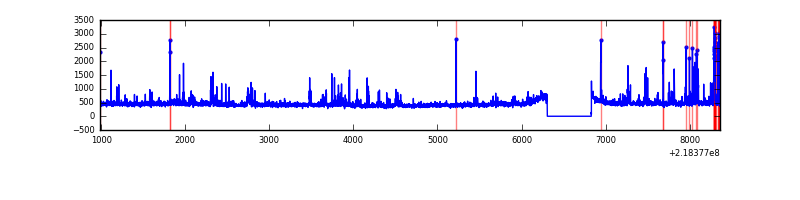 |
Top three noisy pixels from each quadrant. If the there are fewer than three noisy pixels in the level2.evt file, extra rows are filled as -1
| Pixel properties | Quadrant properties | ||||||
|---|---|---|---|---|---|---|---|
| Quadrant | DetID | PixID | Counts | Sigma | Mean | Median | Sigma |
| A | 8 | 15 | 1102571 | 6983.18 | 776 | 760 | 157.8 |
| A | 15 | 174 | 49707 | 310.22 | 776 | 760 | 157.8 |
| A | 13 | 251 | 10457 | 61.46 | 776 | 760 | 157.8 |
| B | 0 | 219 | 96087 | 640.55 | 783 | 764 | 148.8 |
| B | 4 | 81 | 68122 | 452.63 | 783 | 764 | 148.8 |
| B | 0 | 214 | 43304 | 285.86 | 783 | 764 | 148.8 |
| C | 9 | 54 | 35651 | 200.48 | 754 | 755 | 174.1 |
| C | 4 | 254 | 33599 | 188.69 | 754 | 755 | 174.1 |
| C | 13 | 61 | 6084 | 30.61 | 754 | 755 | 174.1 |
| D | 5 | 97 | 157186 | 840.27 | 760 | 735 | 186.2 |
| D | 2 | 152 | 155070 | 828.91 | 760 | 735 | 186.2 |
| D | 11 | 241 | 39396 | 207.64 | 760 | 735 | 186.2 |
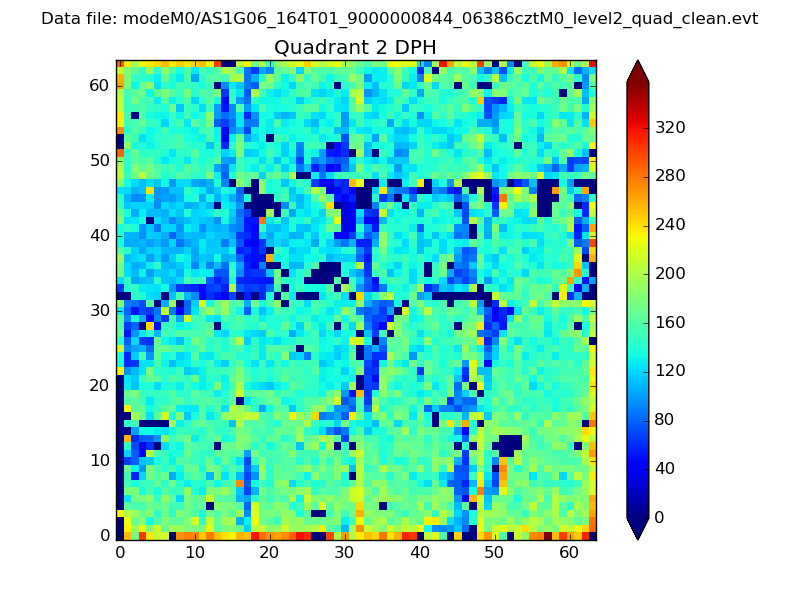
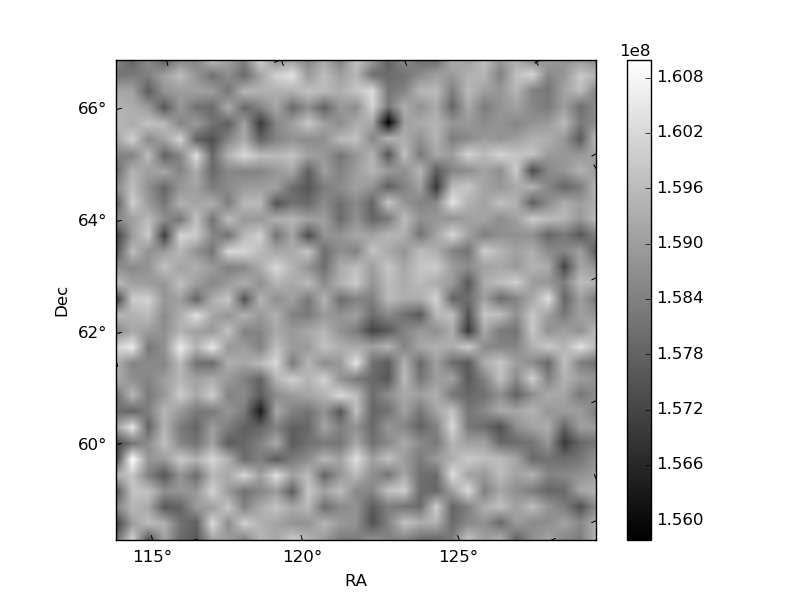
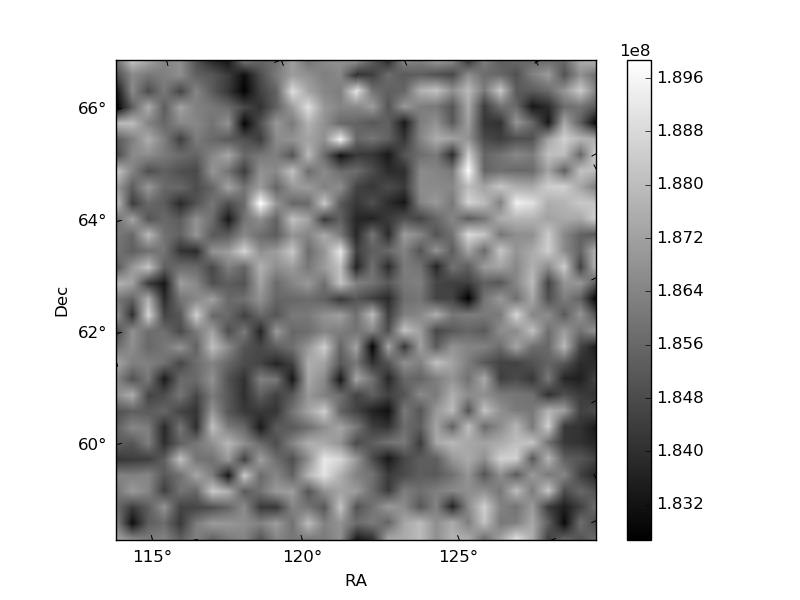
Histogram calculated using DETX and DETY for each event in the final _common_clean file
| Quadrant A | 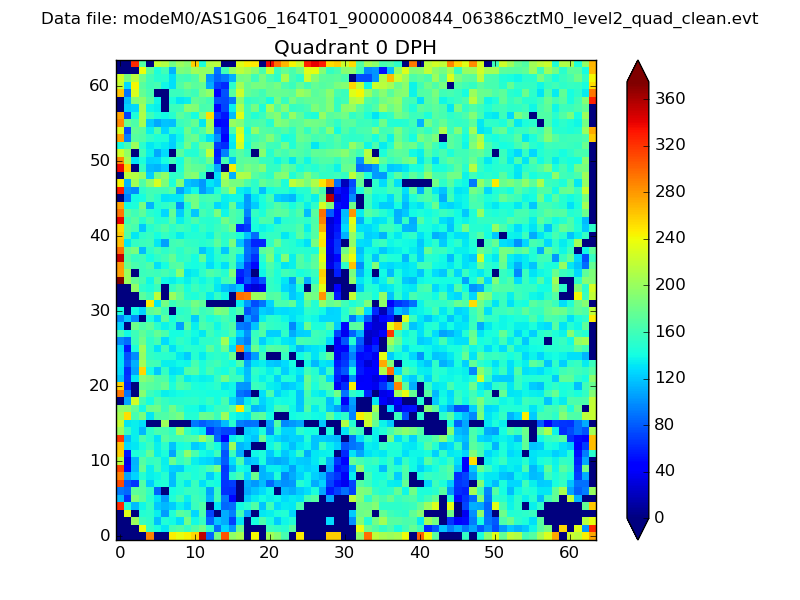 |
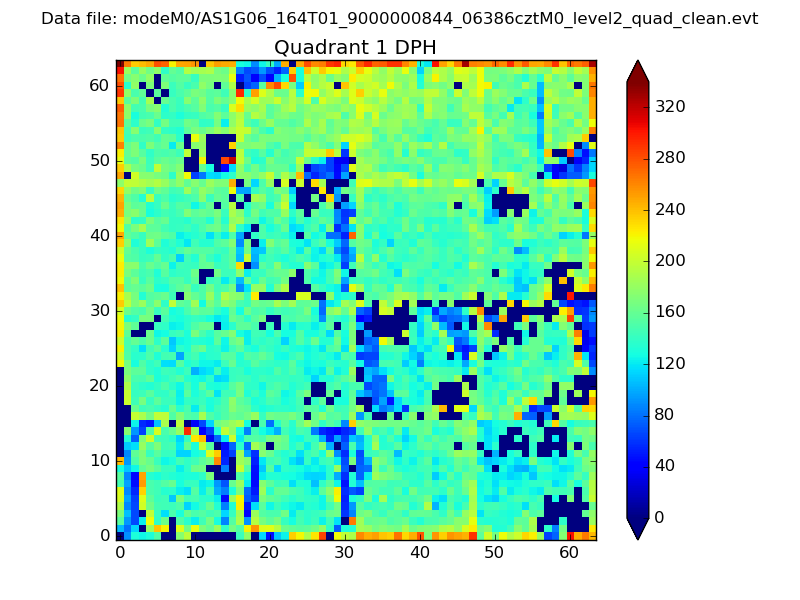 |
Quadrant B |
|---|---|---|---|
| Quadrant D | 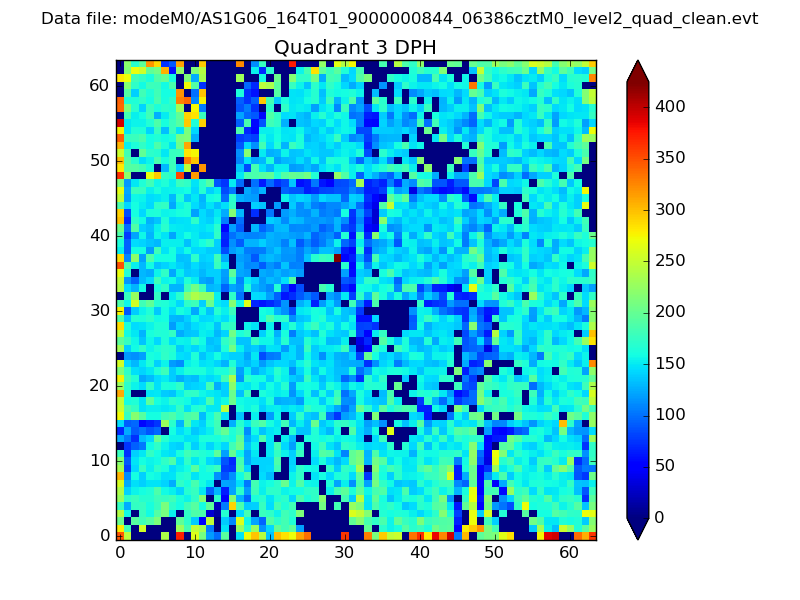 |
 |
Quadrant C |
| Plot type | Count rate plots | Images |
|---|---|---|
| Comparison with Poisson distribution Blue bars denote a histogram of data divided into 1 sec bins. Red curve is a Poisson curve with rate = median count rate of data. |
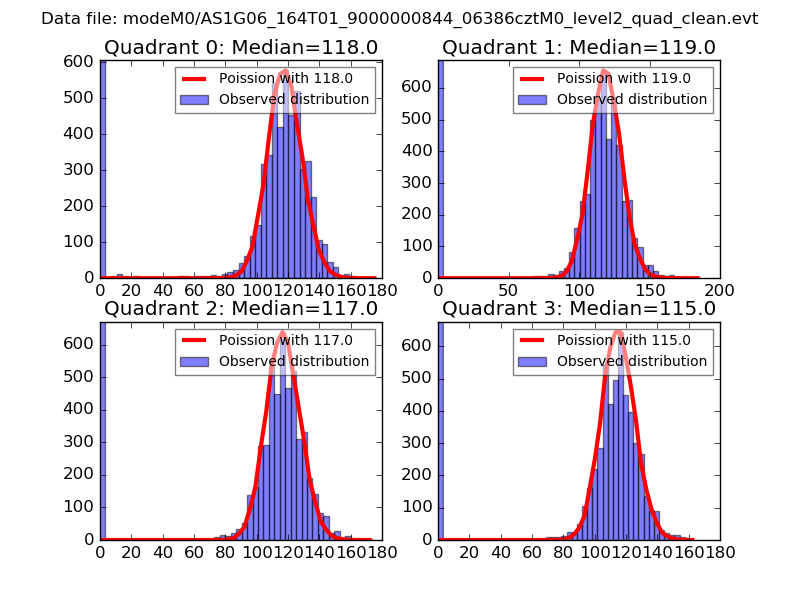 |
 |
| Quadrant-wise count rates Data is divided into 100 sec bins |
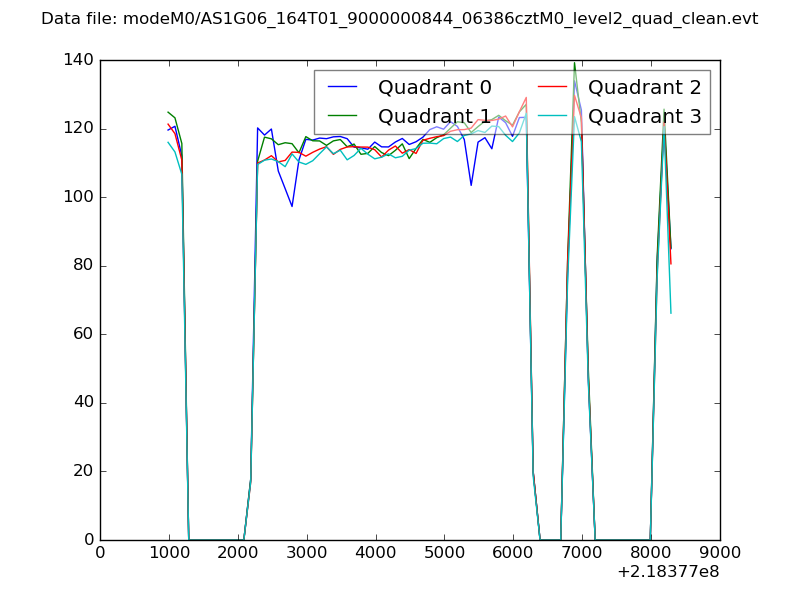 |
|
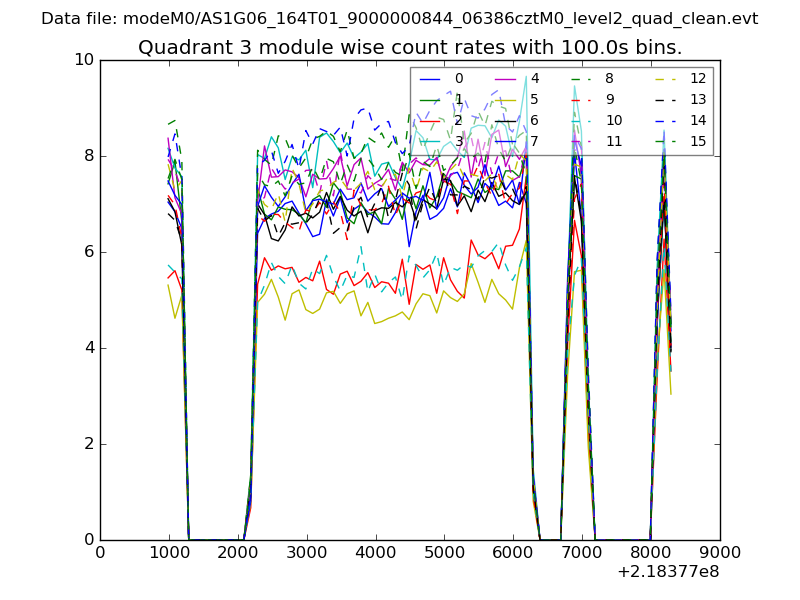
| Module-wise count rates for Quadrant A Data is divided into 100 sec bins |
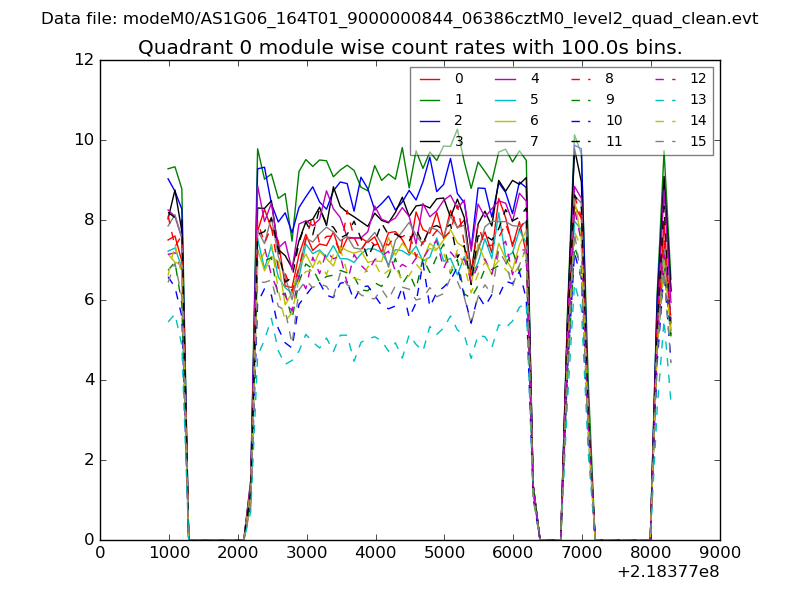 |
 |
| Module-wise count rates for Quadrant B Data is divided into 100 sec bins |
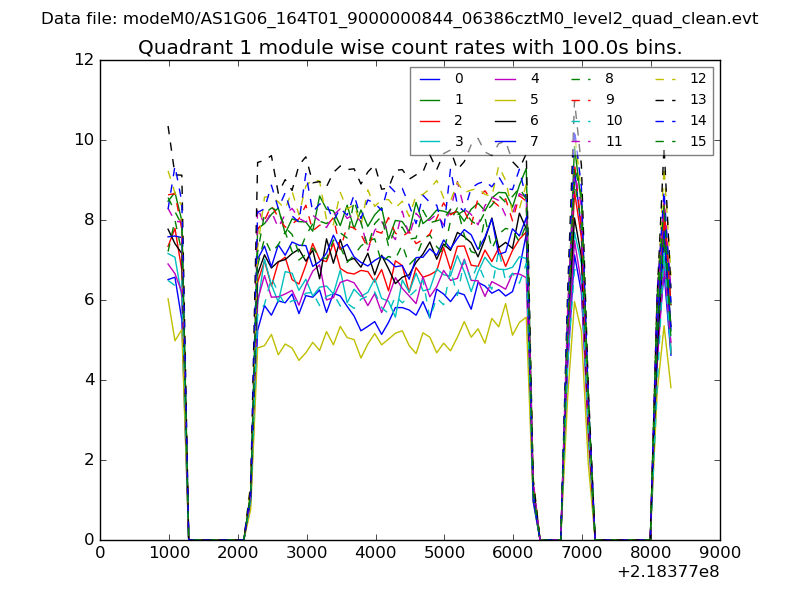 |
 |
| Module-wise count rates for Quadrant C Data is divided into 100 sec bins |
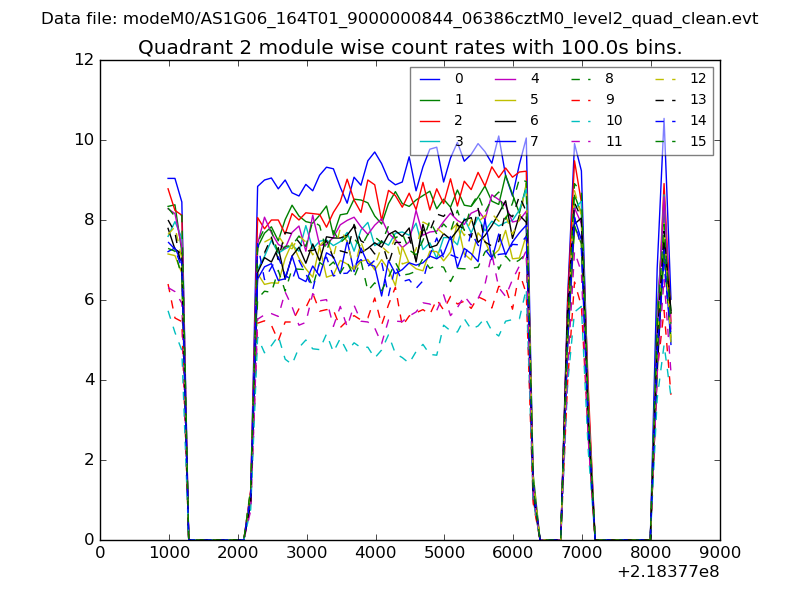 |
 |
| Module-wise count rates for Quadrant D Data is divided into 100 sec bins |
 |
 |
| Parameter | Plot |
|---|---|
| CZT HV Monitor | 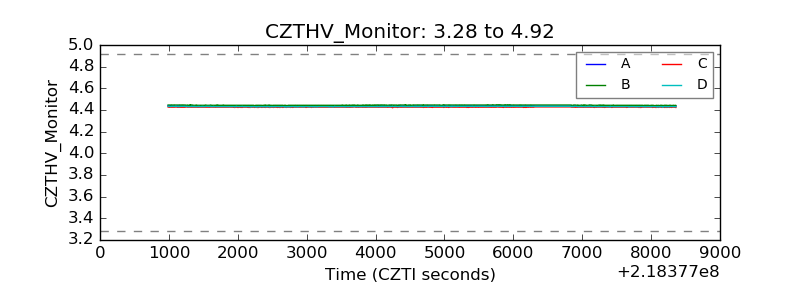 |
| D_VDD | 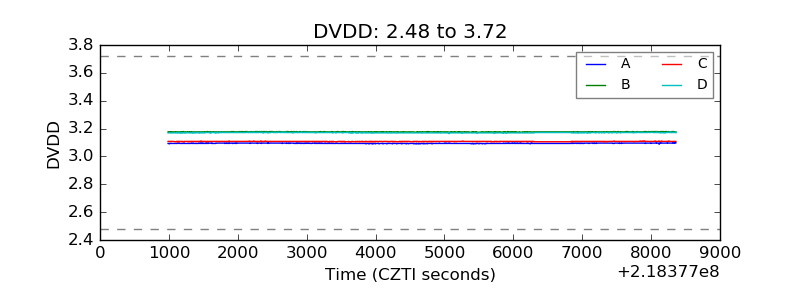 |
| Temperature 1 | 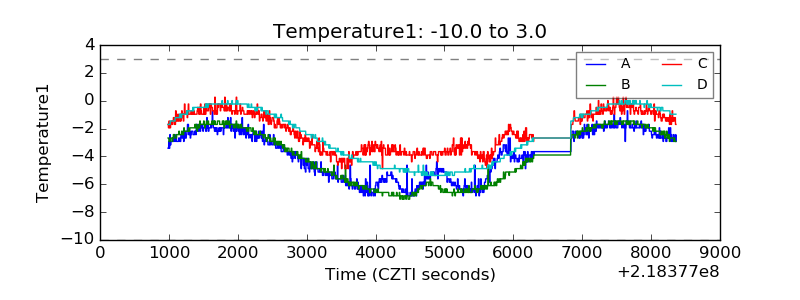 |
| Veto HV Monitor | 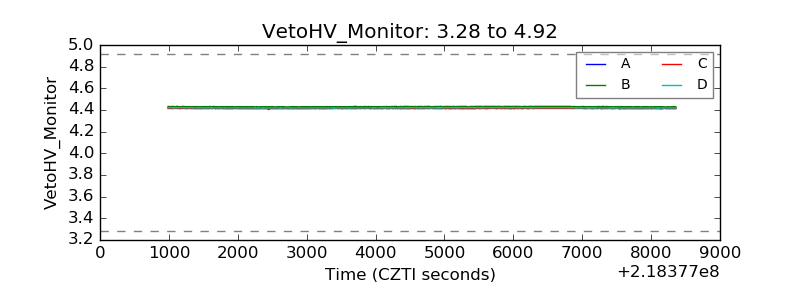 |
| Veto LLD | 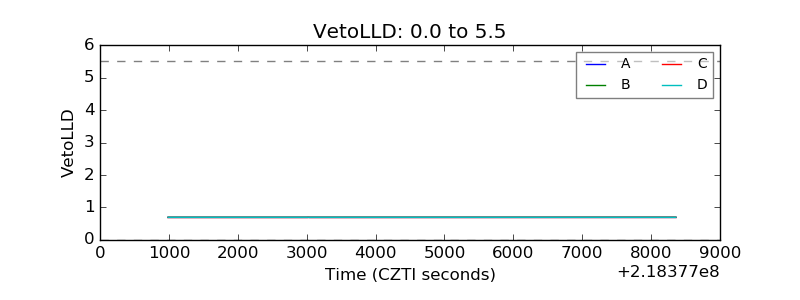 |
| Alpha Counter | 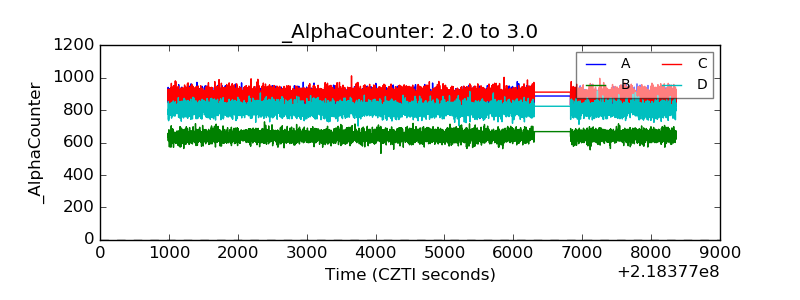 |
| _CPM_Rate | 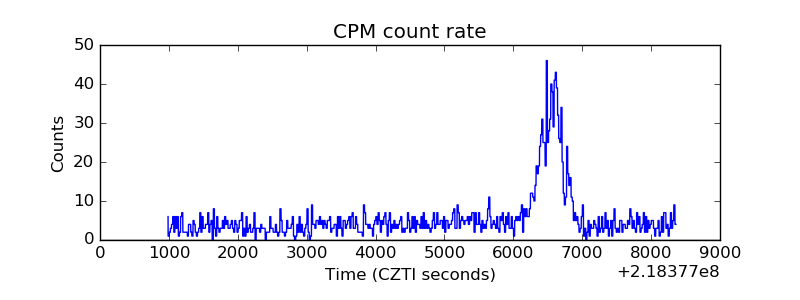 |
| CZT Counter | 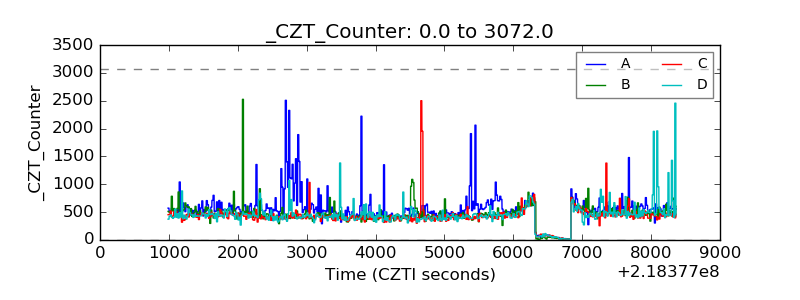 |
| +2.5 Volts monitor |  |
| +5 Volts monitor | 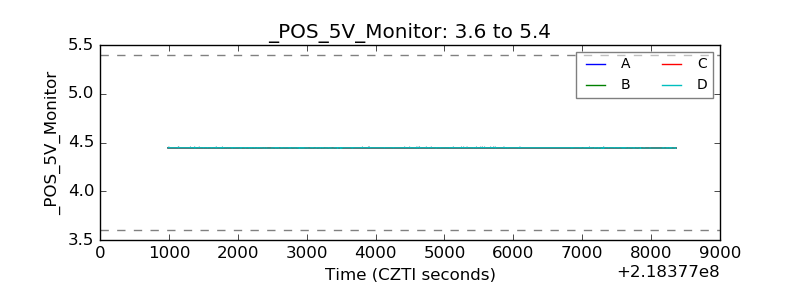 |
| _ROLL_ROT | 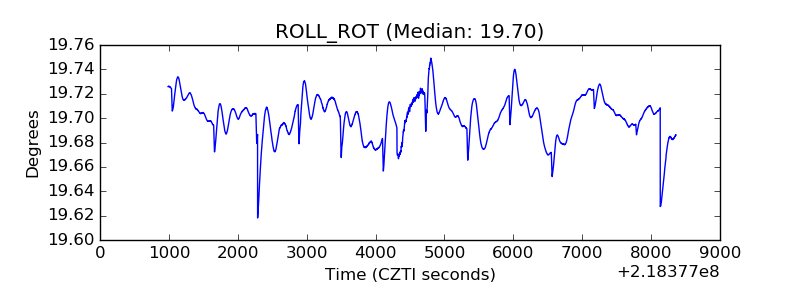 |
| _Roll_DEC | 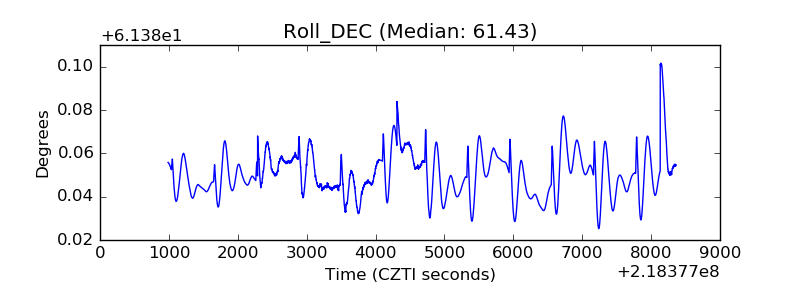 |
| _Roll_RA | 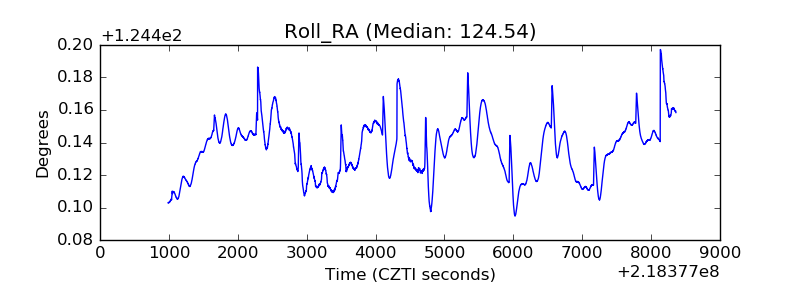 |
| Veto Counter | 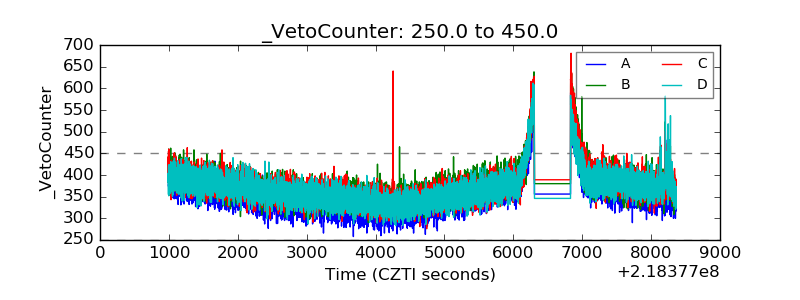 |