| Param | Original file | Final file |
|---|---|---|
| Filename | modeM0/AS1G06_164T01_9000000844_06387cztM0_level2.evt | modeM0/AS1G06_164T01_9000000844_06387cztM0_level2_quad_clean.evt |
| Size (bytes) | 147,081,600 | 21,744,000 |
| Size | 140.3 MB | 20.7 MB |
| Events in quadrant A | 1,195,309 | 131,928 |
| Events in quadrant B | 1,131,952 | 126,154 |
| Events in quadrant C | 876,689 | 127,781 |
| Events in quadrant D | 1,110,967 | 125,618 |
| Mode SS | |||
|---|---|---|---|
| Quadrant | BADHDUFLAG | Total packets | Discarded packets |
| A | 0 | 42 | 0 |
| B | 0 | 42 | 0 |
| C | 0 | 42 | 2 |
| D | 0 | 42 | 2 |
| Mode M0 | |||
|---|---|---|---|
| Quadrant | BADHDUFLAG | Total packets | Discarded packets |
| A | 0 | 4885 | 174 |
| B | 0 | 4818 | 139 |
| C | 0 | 4159 | 102 |
| D | 0 | 4829 | 183 |
| Quadrant | Total seconds | Saturated seconds | Saturation percentage |
|---|---|---|---|
| A | 2000 | 19 | 0.950000% |
| B | 2018 | 67 | 3.320119% |
| C | 2016 | 3 | 0.148810% |
| D | 2010 | 42 | 2.089552% |
Noise dominated data is calculated using 1-second bins in cleaned event files. If a bin has >2000 counts, and if more than 50% of those come from <1% of pixels, then it is considered to be noise-dominated and hence unusable.
| Quadrant | # 1 sec bins | Bins with >0 counts | Bins with >2000 counts | High rate bins dominated by noise | Noise dominated (total time) | Noise dominated (detector-on time) | Marked lightcurve |
|---|---|---|---|---|---|---|---|
| A | 2067 | 2064 | 16 | 16 | 0.77% | 0.78% |  |
| B | 2067 | 2064 | 54 | 54 | 2.61% | 2.62% |  |
| C | 2067 | 2064 | 1 | 1 | 0.05% | 0.05% | 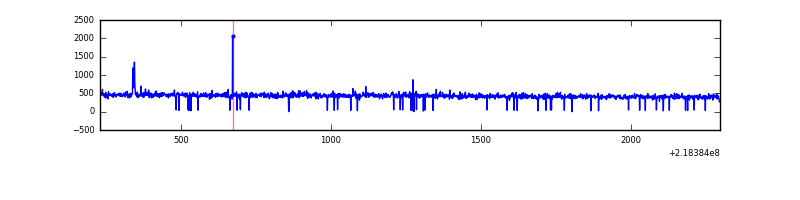 |
| D | 2067 | 2063 | 26 | 26 | 1.26% | 1.26% | 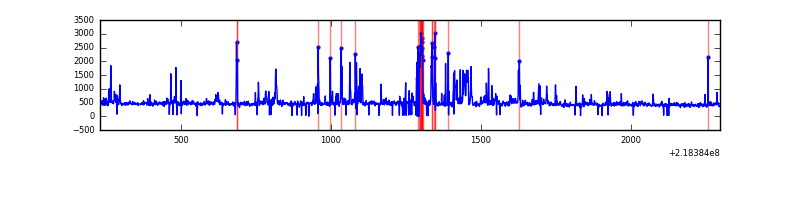 |
Top three noisy pixels from each quadrant. If the there are fewer than three noisy pixels in the level2.evt file, extra rows are filled as -1
| Pixel properties | Quadrant properties | ||||||
|---|---|---|---|---|---|---|---|
| Quadrant | DetID | PixID | Counts | Sigma | Mean | Median | Sigma |
| A | 8 | 15 | 315060 | 6638.83 | 226 | 220 | 47.4 |
| A | 15 | 236 | 4241 | 84.79 | 226 | 220 | 47.4 |
| A | 10 | 133 | 2919 | 56.91 | 226 | 220 | 47.4 |
| B | 0 | 214 | 167260 | 3739.65 | 222 | 217 | 44.7 |
| B | 4 | 81 | 42505 | 946.72 | 222 | 217 | 44.7 |
| B | 4 | 170 | 30373 | 675.11 | 222 | 217 | 44.7 |
| C | 4 | 254 | 14806 | 276.19 | 220 | 220 | 52.8 |
| C | 13 | 61 | 1755 | 29.07 | 220 | 220 | 52.8 |
| C | 1 | 16 | 636 | 7.88 | 220 | 220 | 52.8 |
| D | 5 | 97 | 156233 | 2807.32 | 221 | 214 | 55.6 |
| D | 2 | 152 | 49414 | 885.27 | 221 | 214 | 55.6 |
| D | 2 | 136 | 32879 | 587.75 | 221 | 214 | 55.6 |
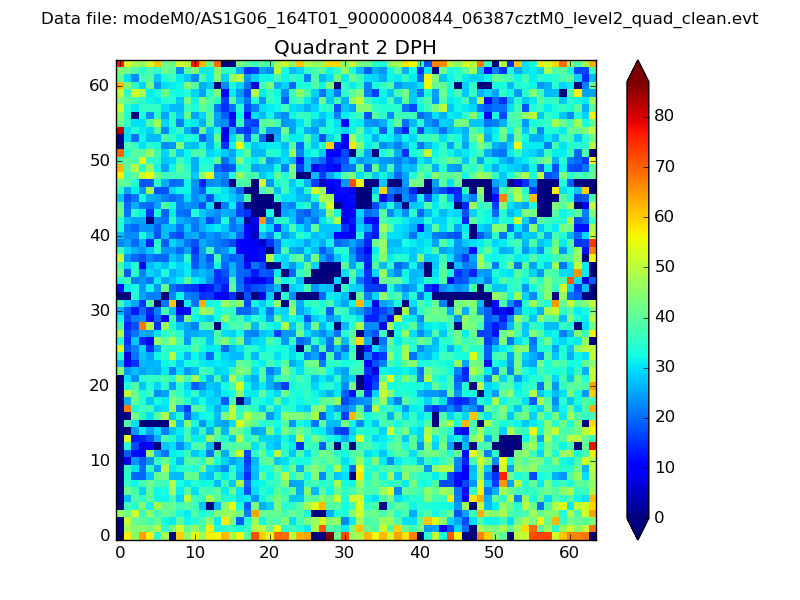
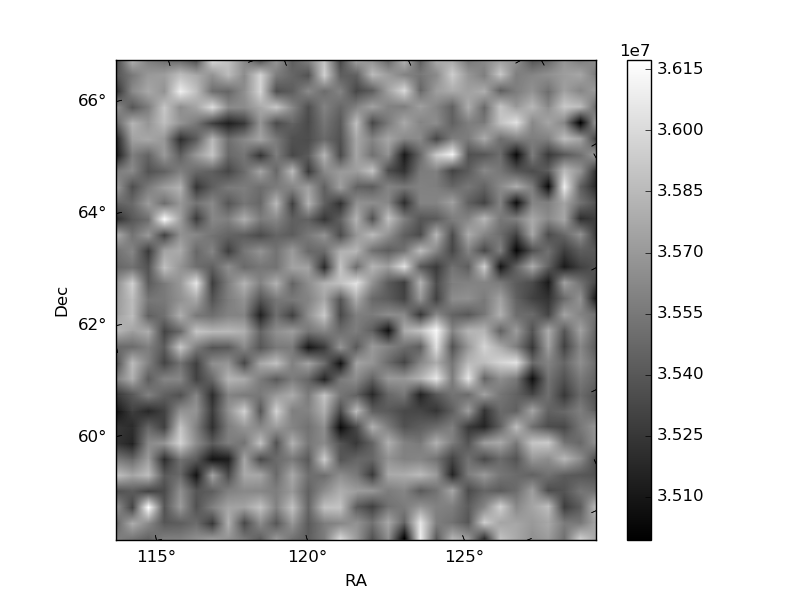
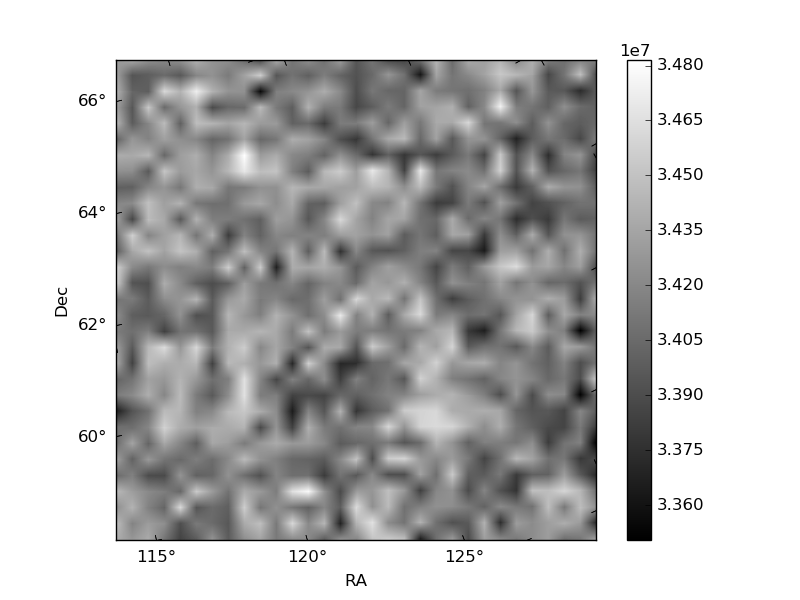
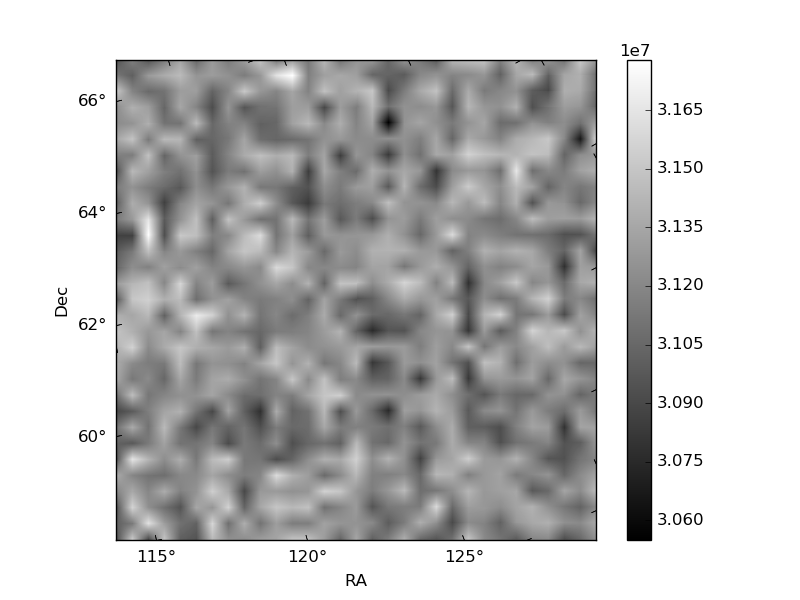
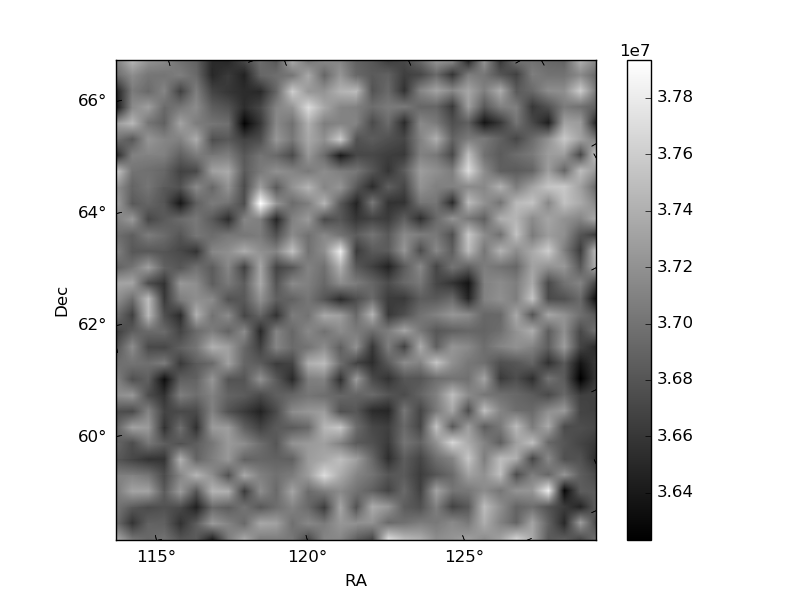
Histogram calculated using DETX and DETY for each event in the final _common_clean file
| Quadrant A | 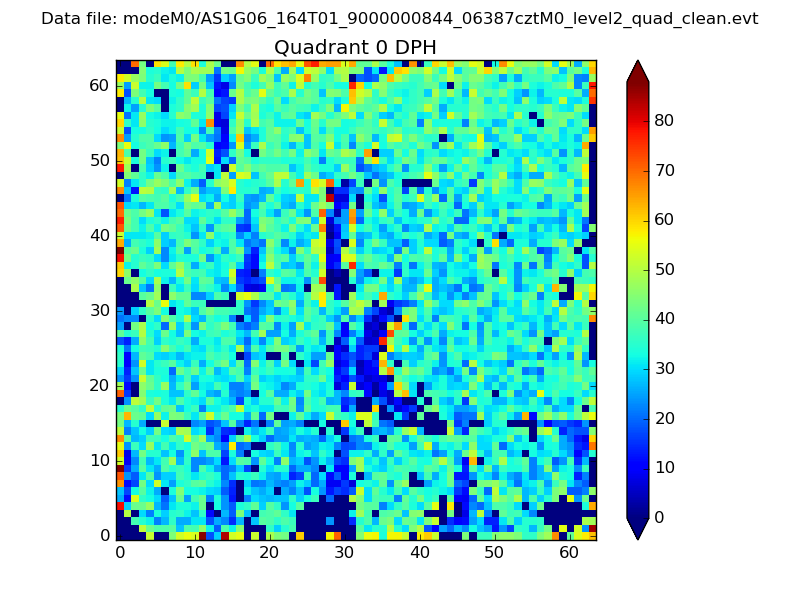 |
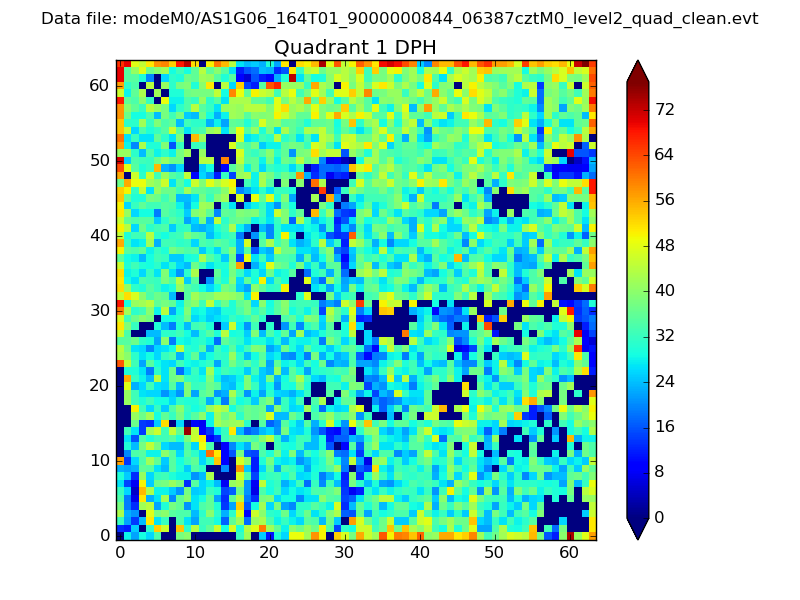 |
Quadrant B |
|---|---|---|---|
| Quadrant D | 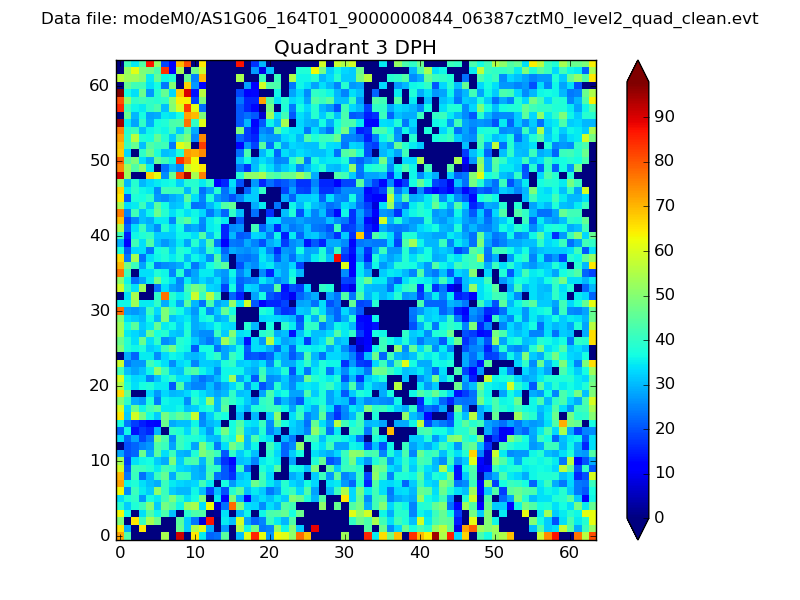 |
 |
Quadrant C |
| Plot type | Count rate plots | Images |
|---|---|---|
| Comparison with Poisson distribution Blue bars denote a histogram of data divided into 1 sec bins. Red curve is a Poisson curve with rate = median count rate of data. |
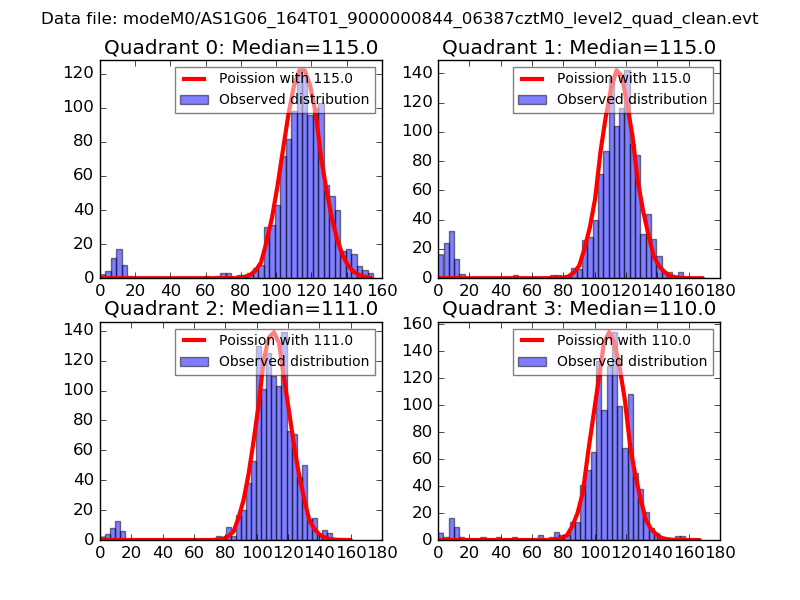 |
 |
| Quadrant-wise count rates Data is divided into 100 sec bins |
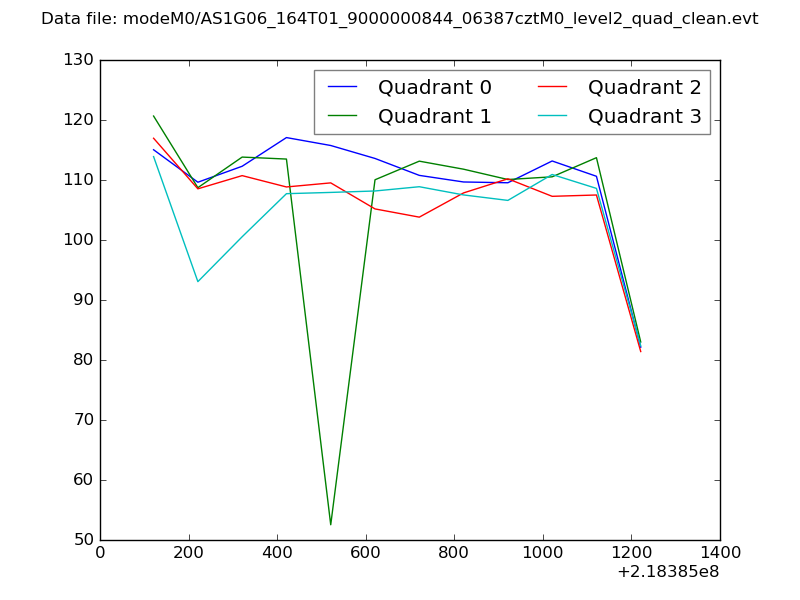 |
|
| Module-wise count rates for Quadrant A Data is divided into 100 sec bins |
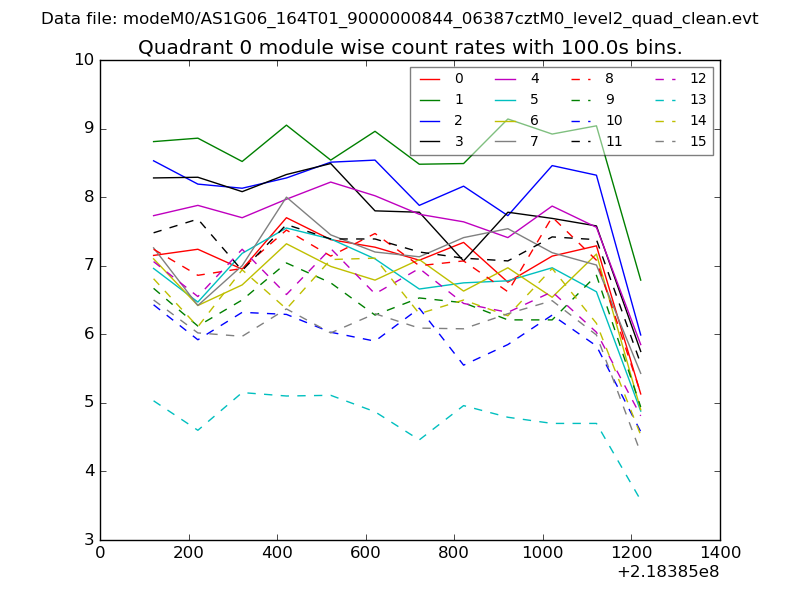 |
 |
| Module-wise count rates for Quadrant B Data is divided into 100 sec bins |
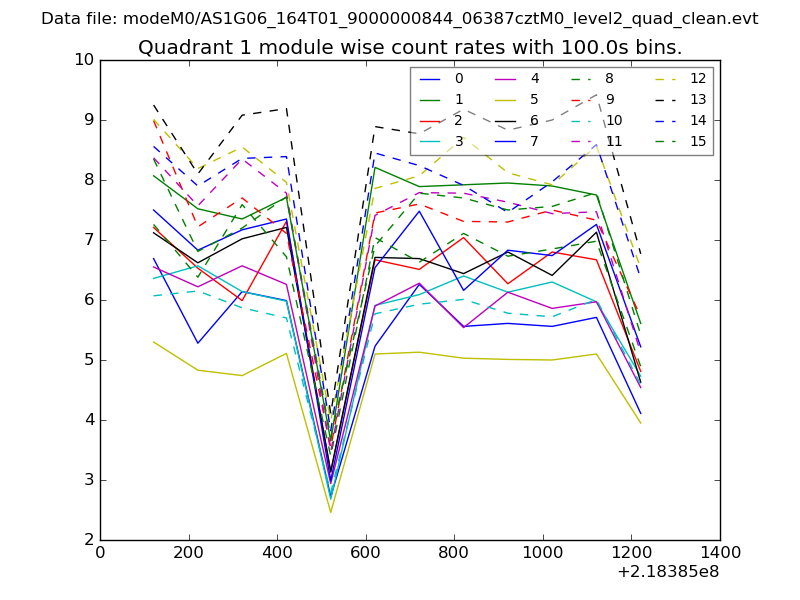 |
 |
| Module-wise count rates for Quadrant C Data is divided into 100 sec bins |
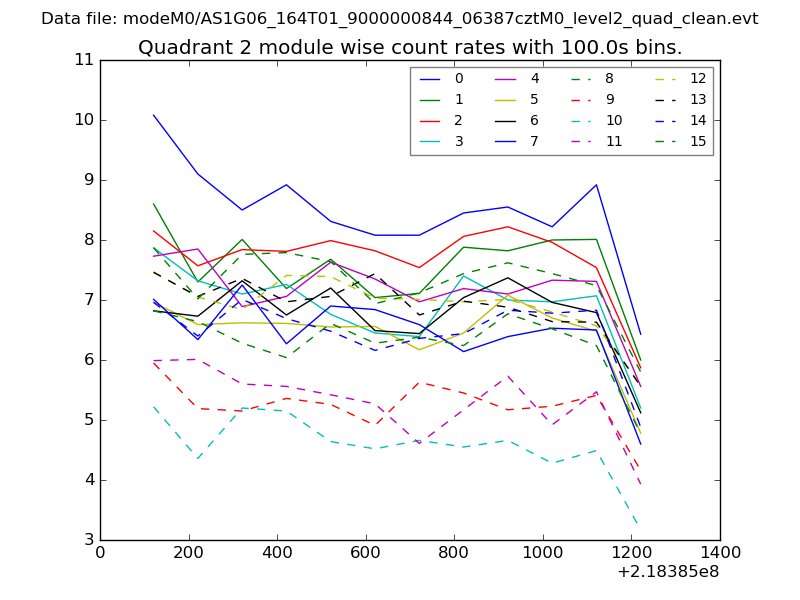 |
 |
| Module-wise count rates for Quadrant D Data is divided into 100 sec bins |
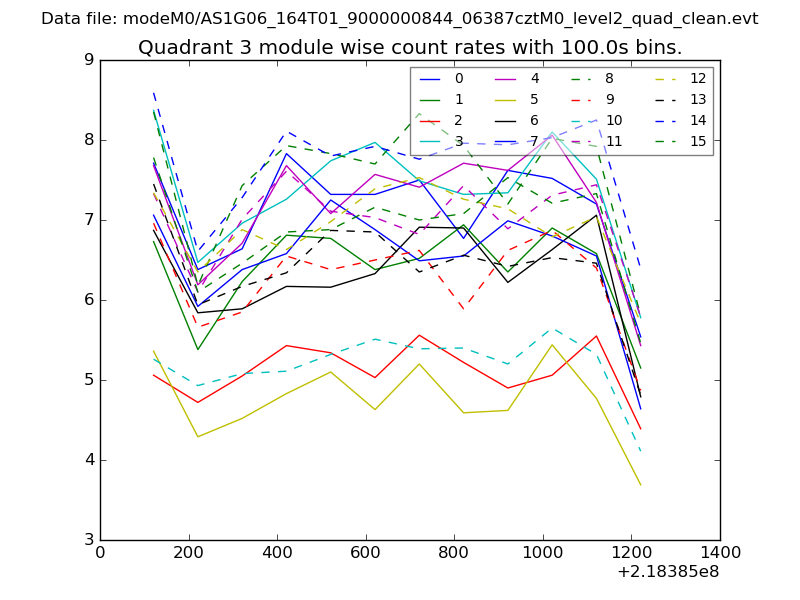 |
 |
| Parameter | Plot |
|---|---|
| CZT HV Monitor | 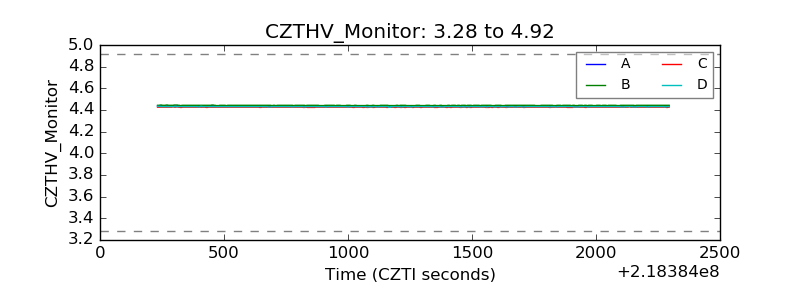 |
| D_VDD |  |
| Temperature 1 | 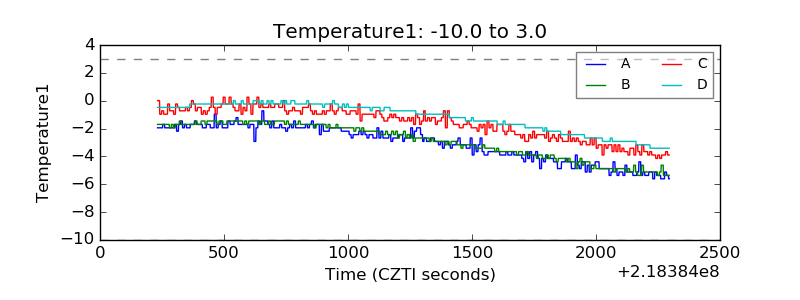 |
| Veto HV Monitor |  |
| Veto LLD | 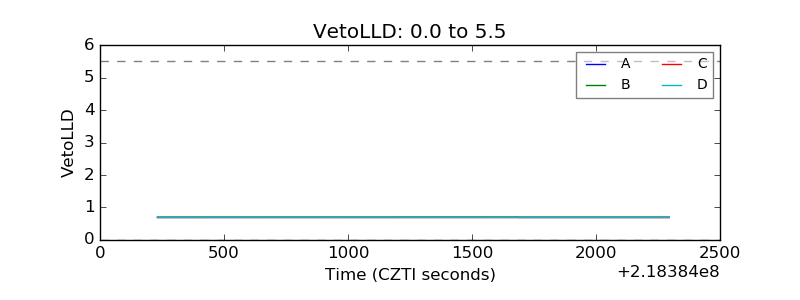 |
| Alpha Counter | 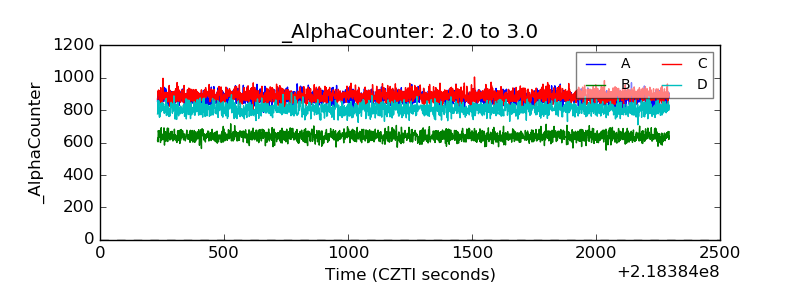 |
| _CPM_Rate | 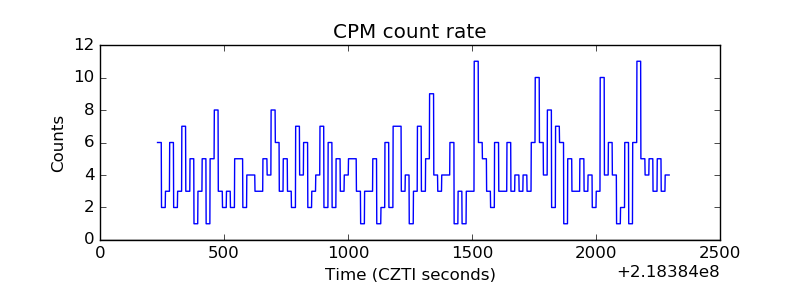 |
| CZT Counter | 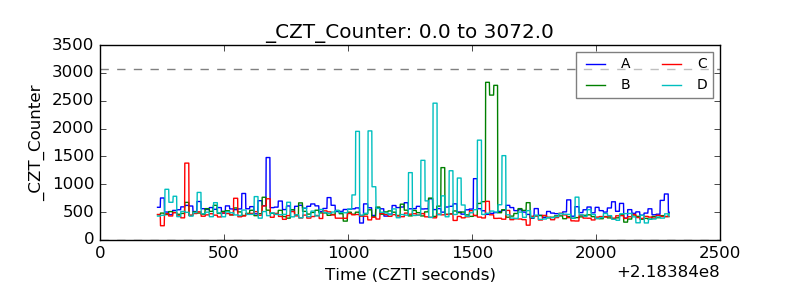 |
| +2.5 Volts monitor |  |
| +5 Volts monitor |  |
| _ROLL_ROT | 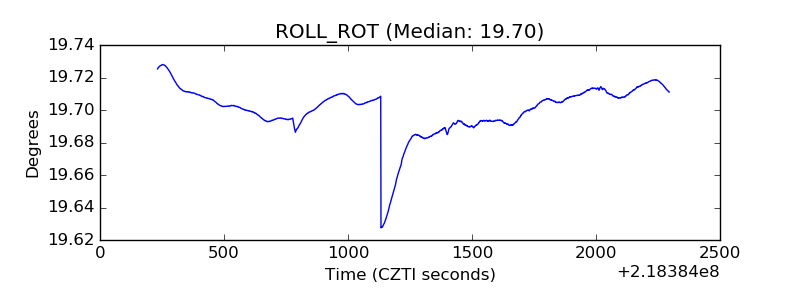 |
| _Roll_DEC | 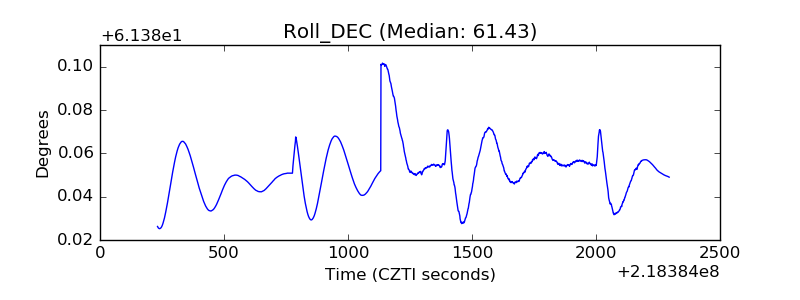 |
| _Roll_RA | 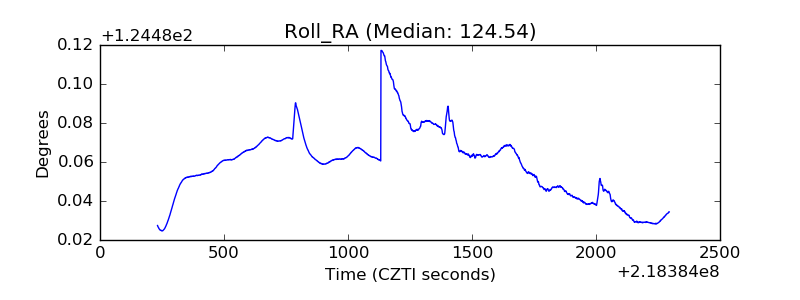 |
| Veto Counter | 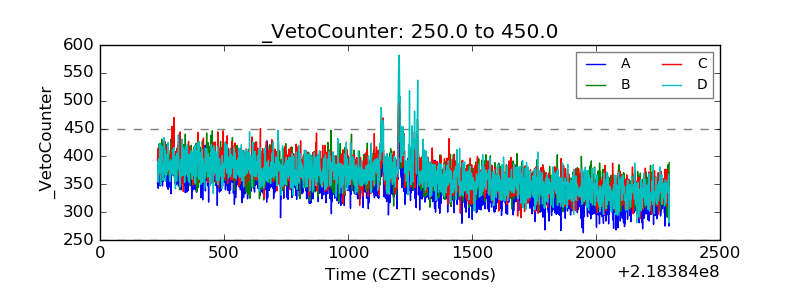 |