| Param | Original file | Final file |
|---|---|---|
| Filename | modeM0/AS1G06_169T01_9000000846cztM0_level2.fits | modeM0/AS1G06_169T01_9000000846cztM0_level2_quad_clean.evt |
| Size (bytes) | 96,154,560 | 87,742,080 |
| Size | 91.7 MB | 83.7 MB |
| Events in quadrant A | 556,196 | 499,904 |
| Events in quadrant B | 555,016 | 494,544 |
| Events in quadrant C | 568,108 | 475,628 |
| Events in quadrant D | 492,490 | 446,740 |
| Mode M0 | |||
|---|---|---|---|
| Quadrant | BADHDUFLAG | Total packets | Discarded packets |
| A | 0 | 27510 | 0 |
| B | 0 | 23882 | 0 |
| C | 0 | 22070 | 0 |
| D | 0 | 24965 | 0 |
| Mode SS | |||
|---|---|---|---|
| Quadrant | BADHDUFLAG | Total packets | Discarded packets |
| A | 0 | 220 | 0 |
| B | 0 | 220 | 0 |
| C | 0 | 218 | 0 |
| D | 0 | 220 | 0 |
| Mode M9 | |||
|---|---|---|---|
| Quadrant | BADHDUFLAG | Total packets | Discarded packets |
| A | 0 | 4 | 0 |
| B | 0 | 4 | 0 |
| C | 0 | 4 | 0 |
| D | 0 | 4 | 0 |
| Quadrant | Total seconds | Saturated seconds | Saturation percentage |
|---|---|---|---|
| A | 10659 | 842 | 7.899428% |
| B | 10675 | 316 | 2.960187% |
| C | 10691 | 161 | 1.505940% |
| D | 10677 | 313 | 2.931535% |
Noise dominated data is calculated using 1-second bins in cleaned event files. If a bin has >2000 counts, and if more than 50% of those come from <1% of pixels, then it is considered to be noise-dominated and hence unusable.
| Quadrant | # 1 sec bins | Bins with >0 counts | Bins with >2000 counts | High rate bins dominated by noise | Noise dominated (total time) | Noise dominated (detector-on time) | Marked lightcurve |
|---|---|---|---|---|---|---|---|
| A | 11217 | 10768 | 0 | 0 | 0.00% | 0.00% |  |
| B | 11217 | 10780 | 0 | 0 | 0.00% | 0.00% | 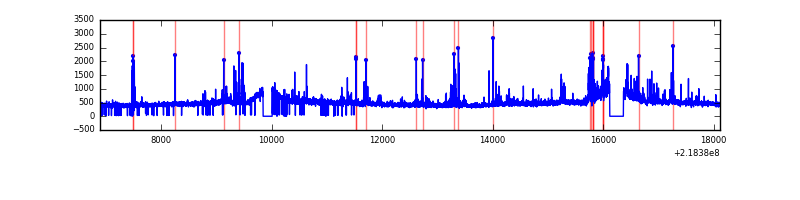 |
| C | 11217 | 10787 | 0 | 0 | 0.00% | 0.00% | 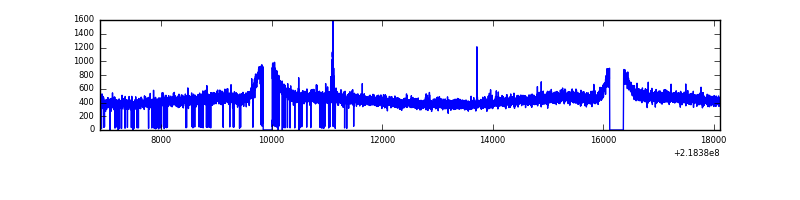 |
| D | 11217 | 10775 | 0 | 0 | 0.00% | 0.00% | 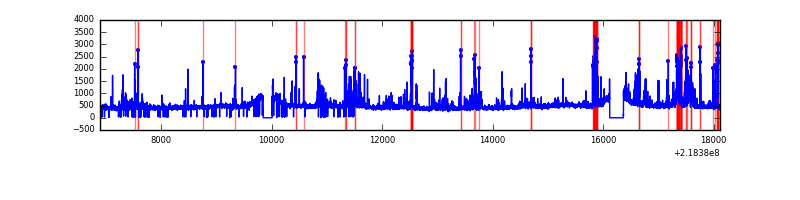 |
Top three noisy pixels from each quadrant. If the there are fewer than three noisy pixels in the level2.evt file, extra rows are filled as -1
| Pixel properties | Quadrant properties | ||||||
|---|---|---|---|---|---|---|---|
| Quadrant | DetID | PixID | Counts | Sigma | Mean | Median | Sigma |
| A | 14 | 188 | 561 | 10.97 | 144 | 135 | 38.8 |
| A | 0 | 29 | 554 | 10.79 | 144 | 135 | 38.8 |
| A | 7 | 110 | 498 | 9.35 | 144 | 135 | 38.8 |
| B | 2 | 9 | 485 | 10.9 | 146 | 138 | 31.8 |
| B | 14 | 254 | 399 | 8.19 | 146 | 138 | 31.8 |
| B | 3 | 17 | 385 | 7.76 | 146 | 138 | 31.8 |
| C | 2 | 191 | 391 | 6.07 | 150 | 138 | 41.7 |
| C | 1 | 80 | 389 | 6.02 | 150 | 138 | 41.7 |
| C | 1 | 81 | 388 | 6.0 | 150 | 138 | 41.7 |
| D | 3 | 14 | 397 | 6.83 | 140 | 126 | 39.7 |
| D | 3 | 30 | 384 | 6.5 | 140 | 126 | 39.7 |
| D | 4 | 160 | 373 | 6.22 | 140 | 126 | 39.7 |
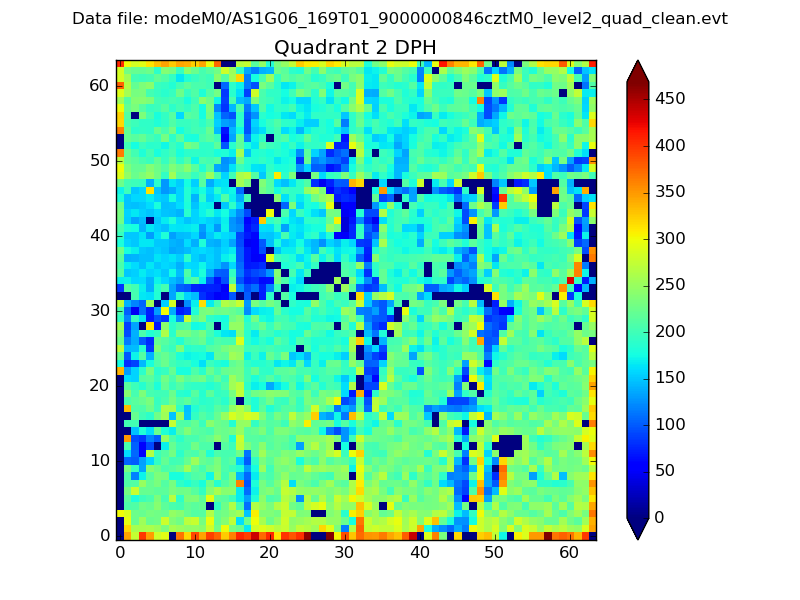
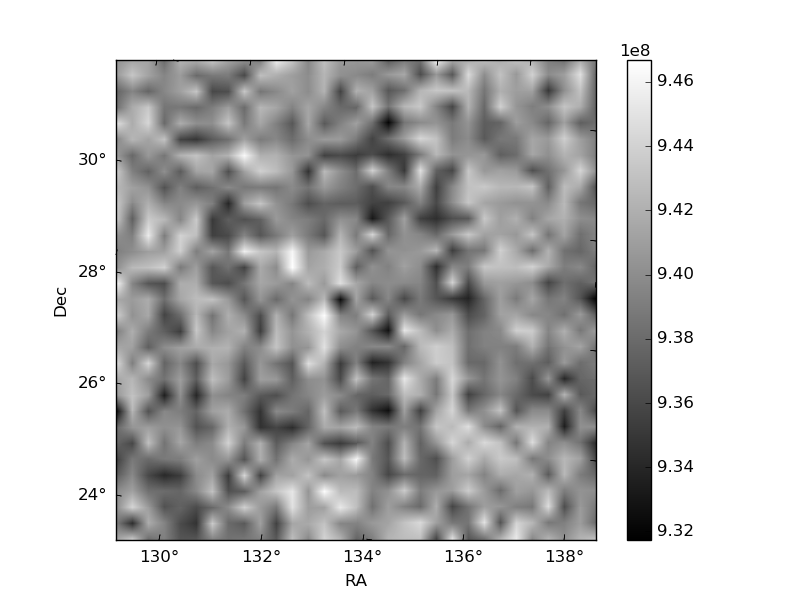
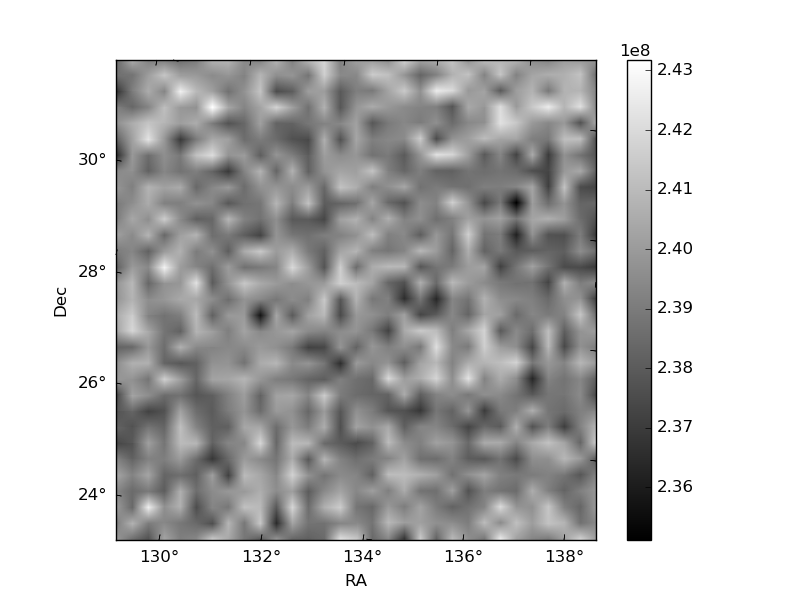
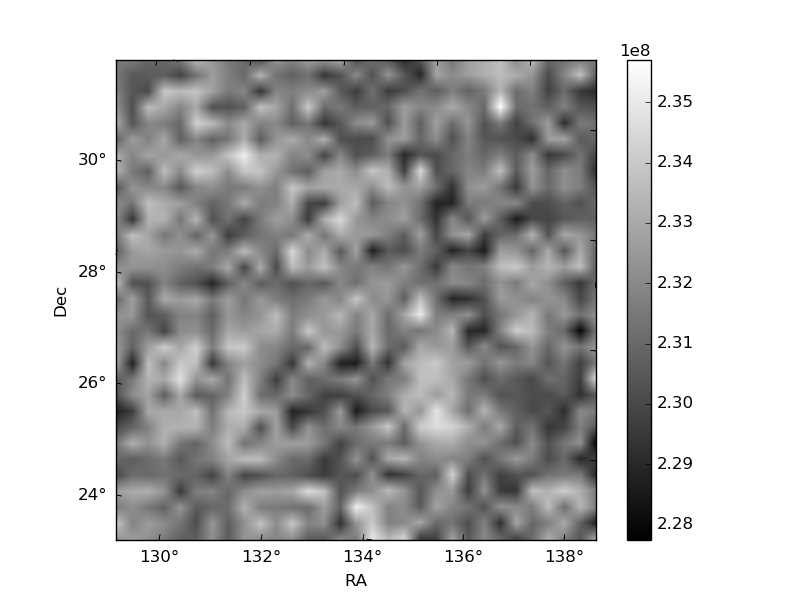
Histogram calculated using DETX and DETY for each event in the final _common_clean file
| Quadrant A | 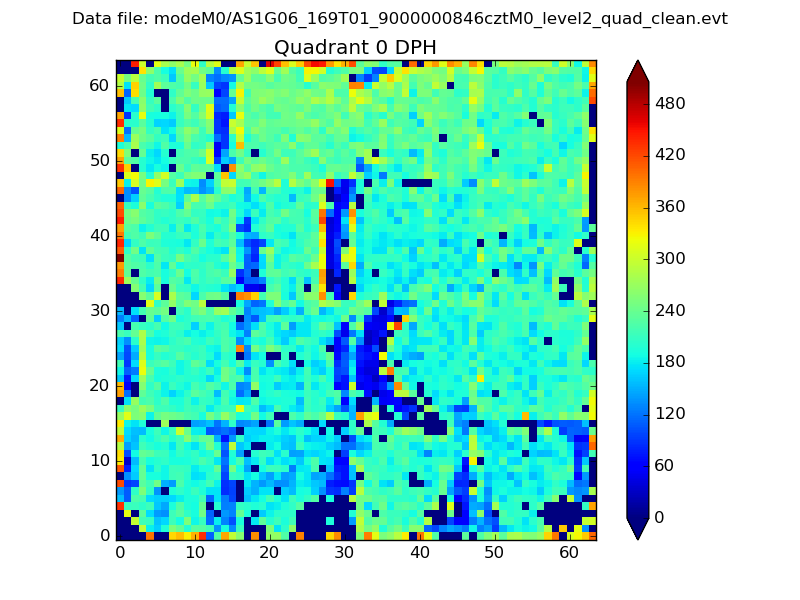 |
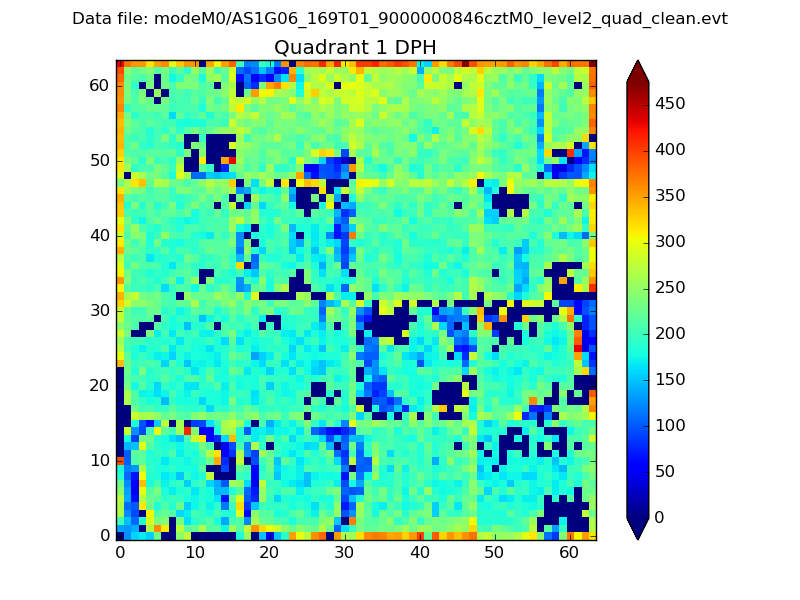 |
Quadrant B |
|---|---|---|---|
| Quadrant D | 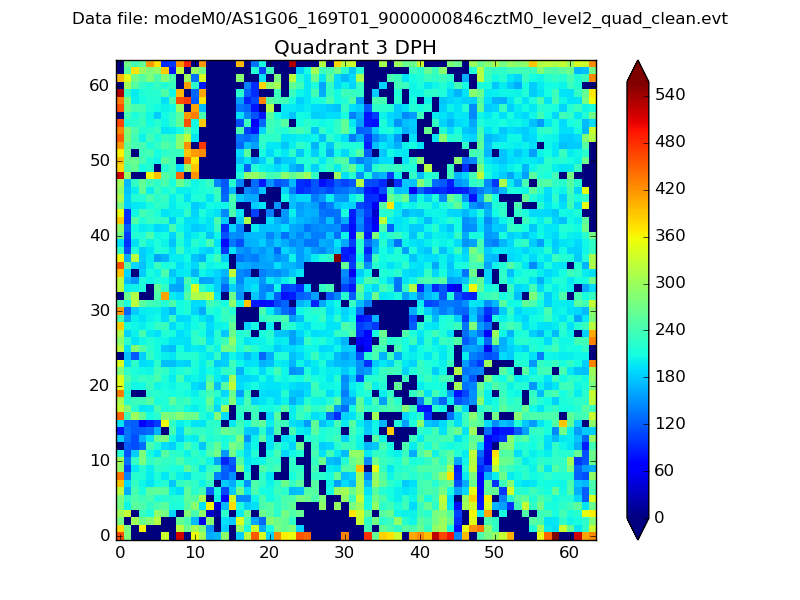 |
 |
Quadrant C |
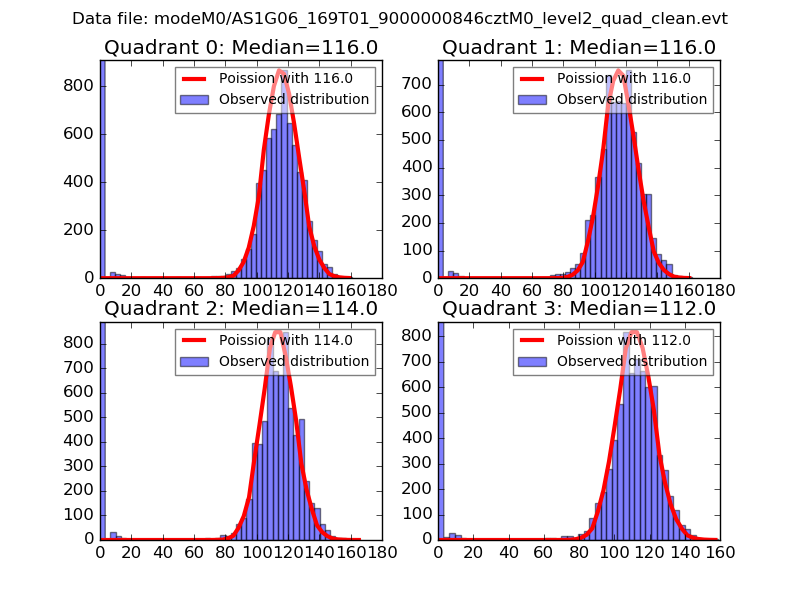
| Plot type | Count rate plots | Images |
|---|---|---|
| Comparison with Poisson distribution Blue bars denote a histogram of data divided into 1 sec bins. Red curve is a Poisson curve with rate = median count rate of data. |
 |
 |
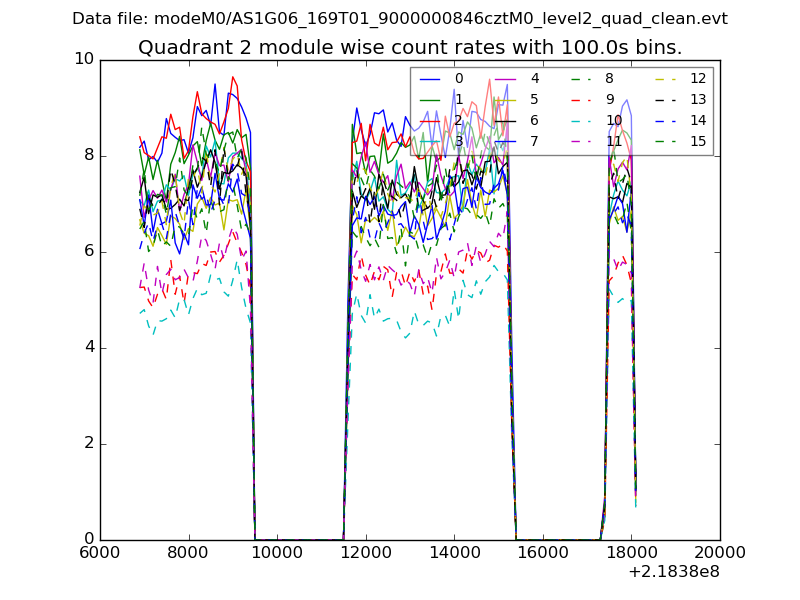
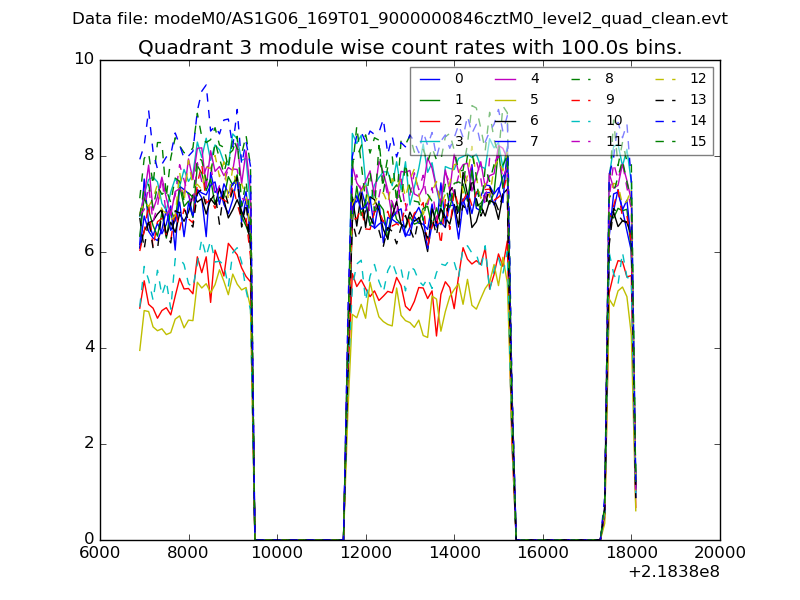
| Quadrant-wise count rates Data is divided into 100 sec bins |
 |
|
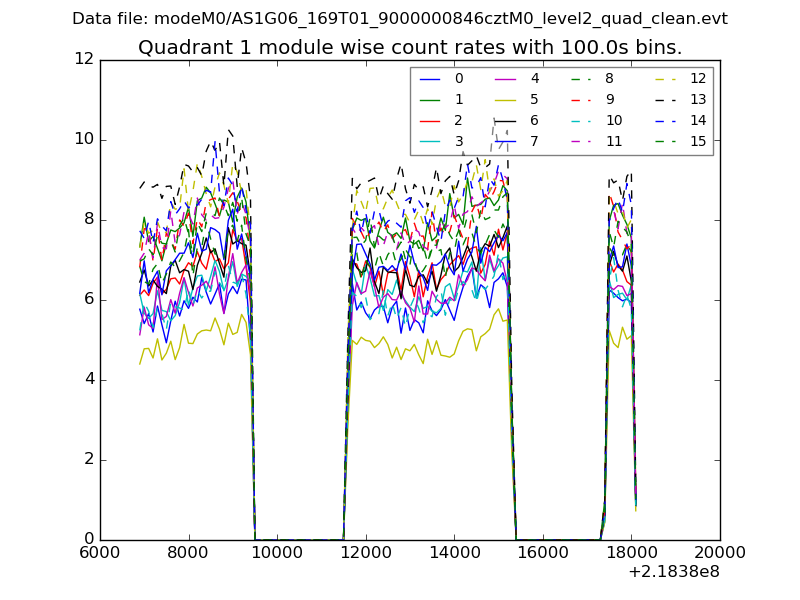
| Module-wise count rates for Quadrant A Data is divided into 100 sec bins |
 |
 |
| Module-wise count rates for Quadrant B Data is divided into 100 sec bins |
 |
 |
| Module-wise count rates for Quadrant C Data is divided into 100 sec bins |
 |
 |
| Module-wise count rates for Quadrant D Data is divided into 100 sec bins |
 |
 |
| Parameter | Plot |
|---|---|
| CZT HV Monitor |  |
| D_VDD | 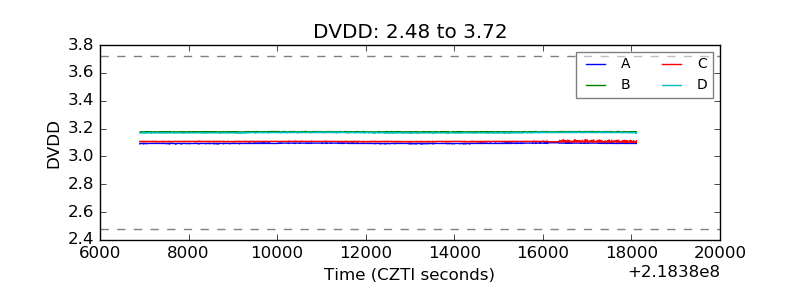 |
| Temperature 1 | 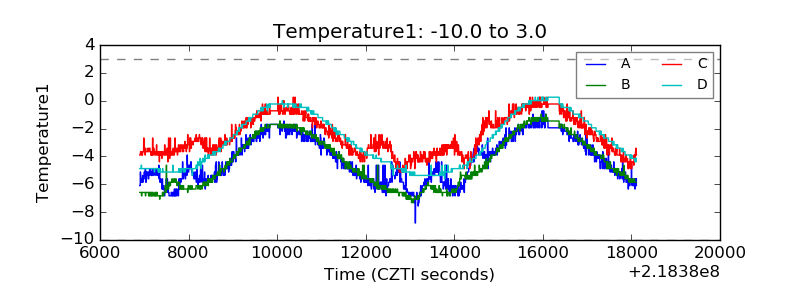 |
| Veto HV Monitor |  |
| Veto LLD | 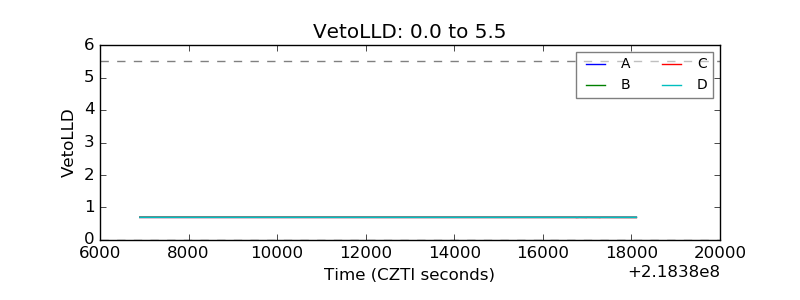 |
| Alpha Counter |  |
| _CPM_Rate |  |
| CZT Counter | 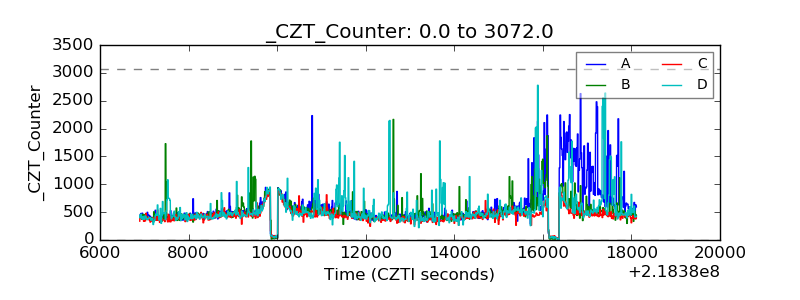 |
| +2.5 Volts monitor |  |
| +5 Volts monitor | 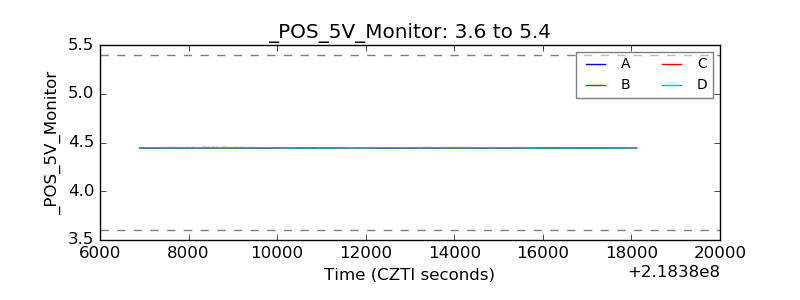 |
| _ROLL_ROT | 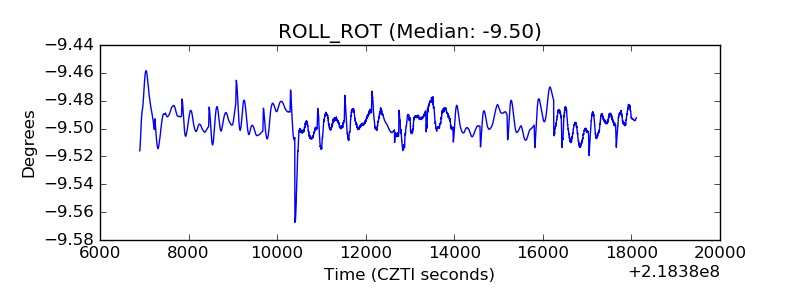 |
| _Roll_DEC | 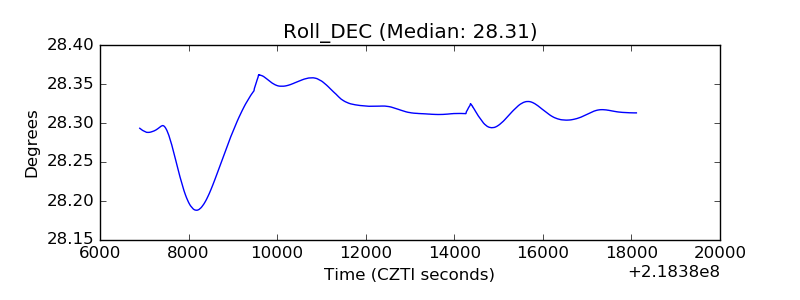 |
| _Roll_RA | 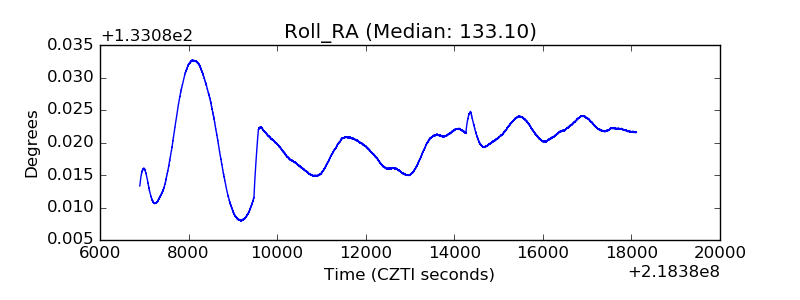 |
| Veto Counter | 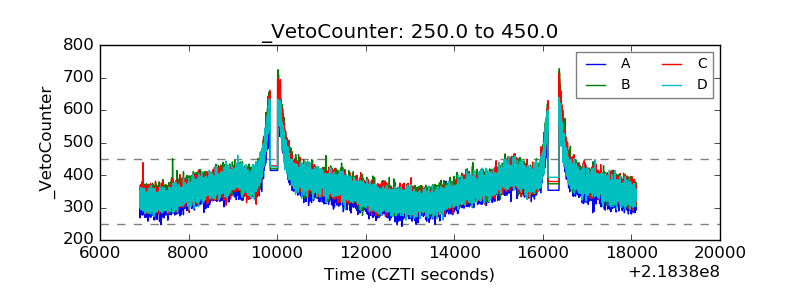 |