| Param | Original file | Final file |
|---|---|---|
| Filename | modeM0/AS1G06_169T01_9000000846_06387cztM0_level2.evt | modeM0/AS1G06_169T01_9000000846_06387cztM0_level2_quad_clean.evt |
| Size (bytes) | 306,408,960 | 49,245,120 |
| Size | 292.2 MB | 47.0 MB |
| Events in quadrant A | 2,328,779 | 299,323 |
| Events in quadrant B | 2,277,241 | 298,498 |
| Events in quadrant C | 2,053,874 | 295,482 |
| Events in quadrant D | 2,320,118 | 288,968 |
| Mode M0 | |||
|---|---|---|---|
| Quadrant | BADHDUFLAG | Total packets | Discarded packets |
| A | 0 | 10217 | 363 |
| B | 0 | 10052 | 323 |
| C | 0 | 9463 | 246 |
| D | 0 | 10253 | 304 |
| Mode SS | |||
|---|---|---|---|
| Quadrant | BADHDUFLAG | Total packets | Discarded packets |
| A | 0 | 92 | 2 |
| B | 0 | 92 | 2 |
| C | 0 | 92 | 4 |
| D | 0 | 92 | 2 |
| Mode M9 | |||
|---|---|---|---|
| Quadrant | BADHDUFLAG | Total packets | Discarded packets |
| A | 0 | 2 | 0 |
| B | 0 | 2 | 0 |
| C | 0 | 2 | 0 |
| D | 0 | 2 | 0 |
| Quadrant | Total seconds | Saturated seconds | Saturation percentage |
|---|---|---|---|
| A | 4369 | 139 | 3.181506% |
| B | 4385 | 154 | 3.511973% |
| C | 4401 | 109 | 2.476710% |
| D | 4387 | 125 | 2.849328% |
Noise dominated data is calculated using 1-second bins in cleaned event files. If a bin has >2000 counts, and if more than 50% of those come from <1% of pixels, then it is considered to be noise-dominated and hence unusable.
| Quadrant | # 1 sec bins | Bins with >0 counts | Bins with >2000 counts | High rate bins dominated by noise | Noise dominated (total time) | Noise dominated (detector-on time) | Marked lightcurve |
|---|---|---|---|---|---|---|---|
| A | 4678 | 4500 | 7 | 7 | 0.15% | 0.16% |  |
| B | 4678 | 4504 | 7 | 7 | 0.15% | 0.16% | 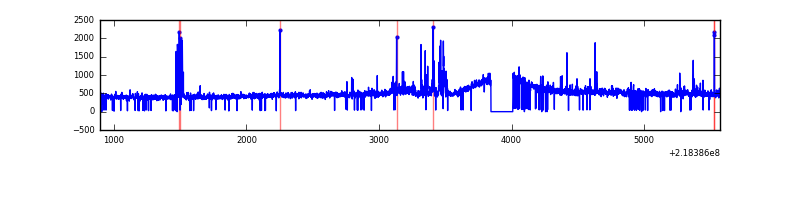 |
| C | 4678 | 4509 | 0 | 0 | 0.00% | 0.00% | 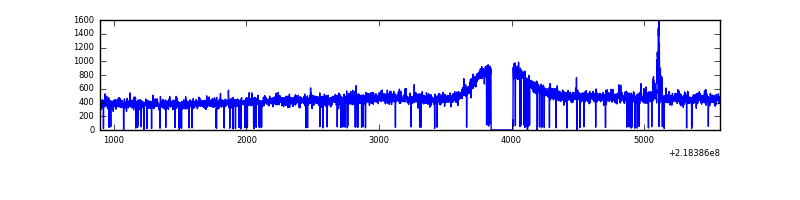 |
| D | 4677 | 4508 | 13 | 13 | 0.28% | 0.29% | 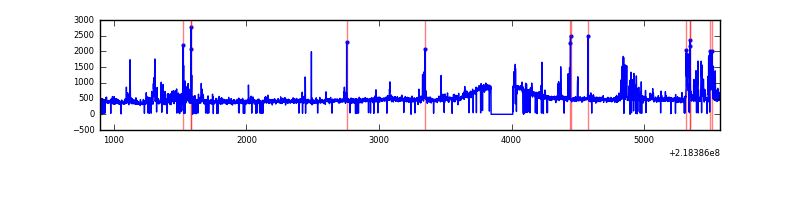 |
Top three noisy pixels from each quadrant. If the there are fewer than three noisy pixels in the level2.evt file, extra rows are filled as -1
| Pixel properties | Quadrant properties | ||||||
|---|---|---|---|---|---|---|---|
| Quadrant | DetID | PixID | Counts | Sigma | Mean | Median | Sigma |
| A | 8 | 15 | 237759 | 2164.41 | 532 | 519 | 109.6 |
| A | 15 | 234 | 14662 | 129.03 | 532 | 519 | 109.6 |
| A | 15 | 174 | 8741 | 75.01 | 532 | 519 | 109.6 |
| B | 0 | 219 | 53548 | 504.39 | 535 | 522 | 105.1 |
| B | 4 | 81 | 44162 | 415.11 | 535 | 522 | 105.1 |
| B | 15 | 204 | 28274 | 263.98 | 535 | 522 | 105.1 |
| C | 9 | 54 | 21324 | 171.9 | 518 | 518 | 121.0 |
| C | 4 | 254 | 5222 | 38.87 | 518 | 518 | 121.0 |
| C | 13 | 61 | 4171 | 30.18 | 518 | 518 | 121.0 |
| D | 2 | 136 | 139055 | 1056.88 | 522 | 504 | 131.1 |
| D | 2 | 152 | 96567 | 732.78 | 522 | 504 | 131.1 |
| D | 13 | 112 | 44257 | 333.75 | 522 | 504 | 131.1 |
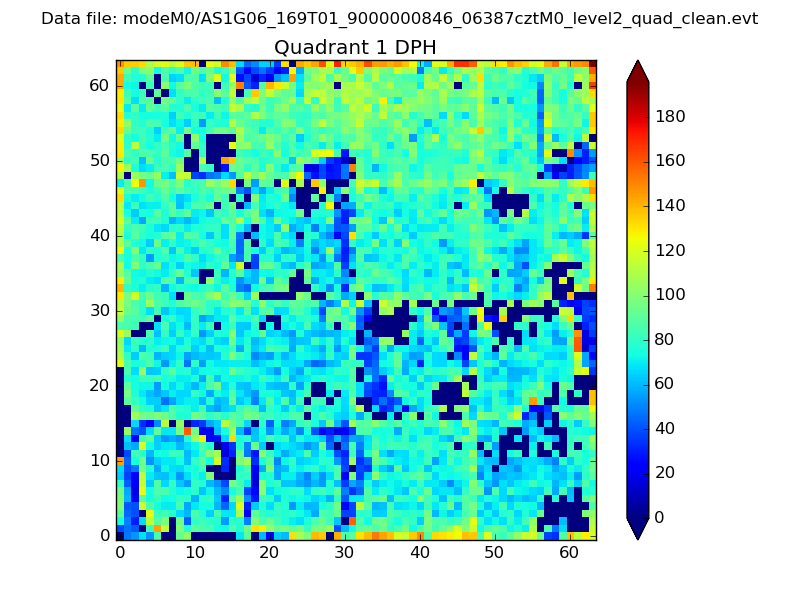
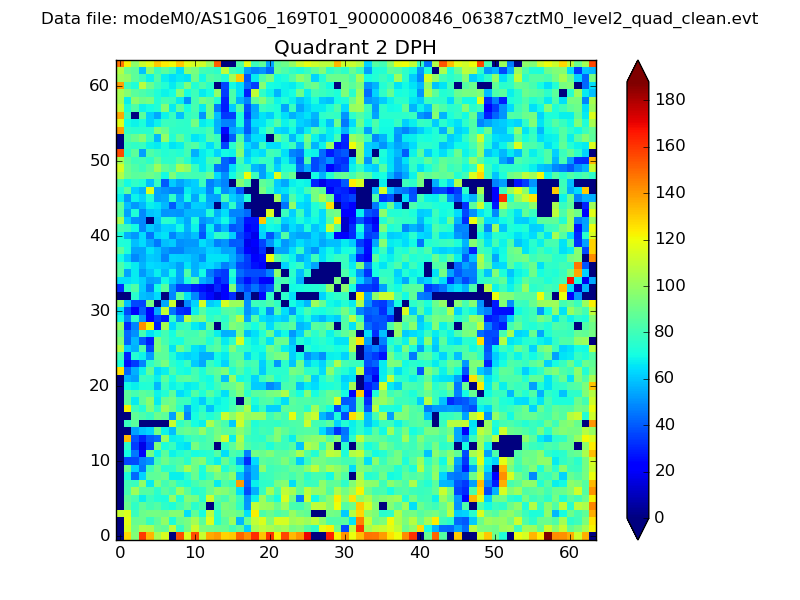
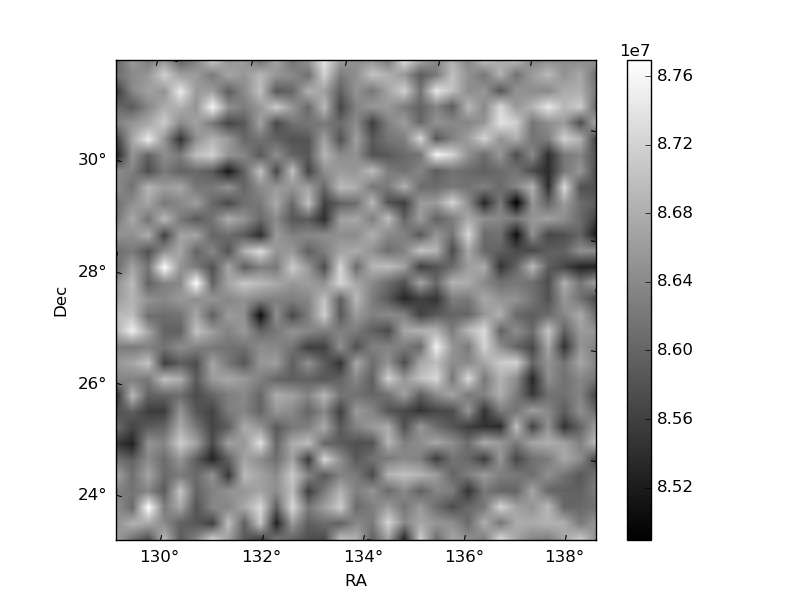
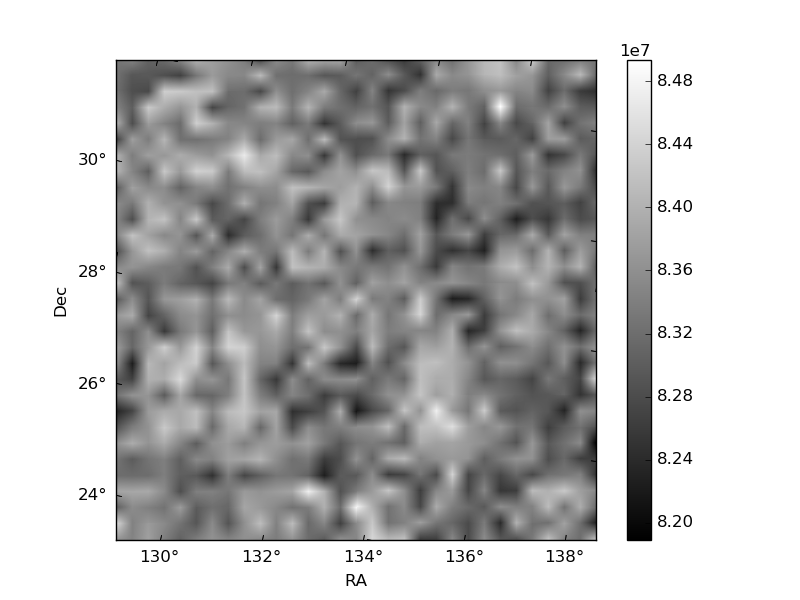
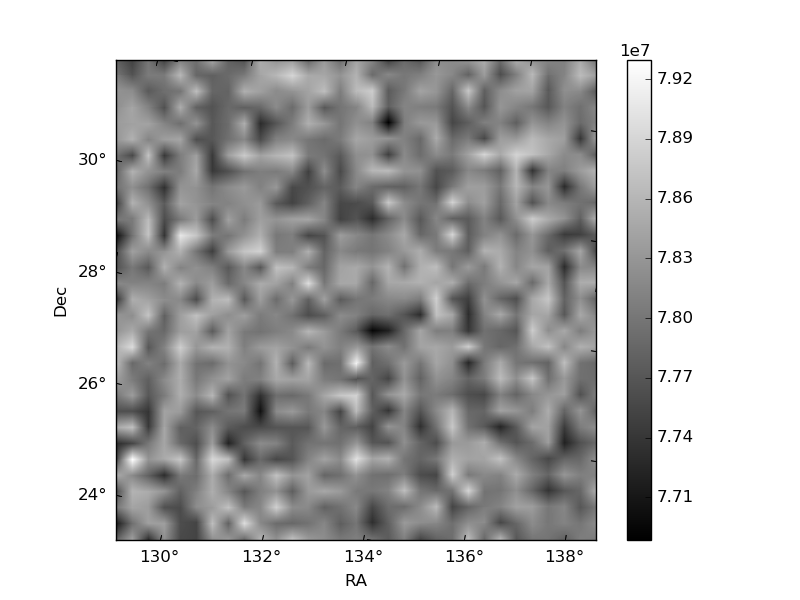
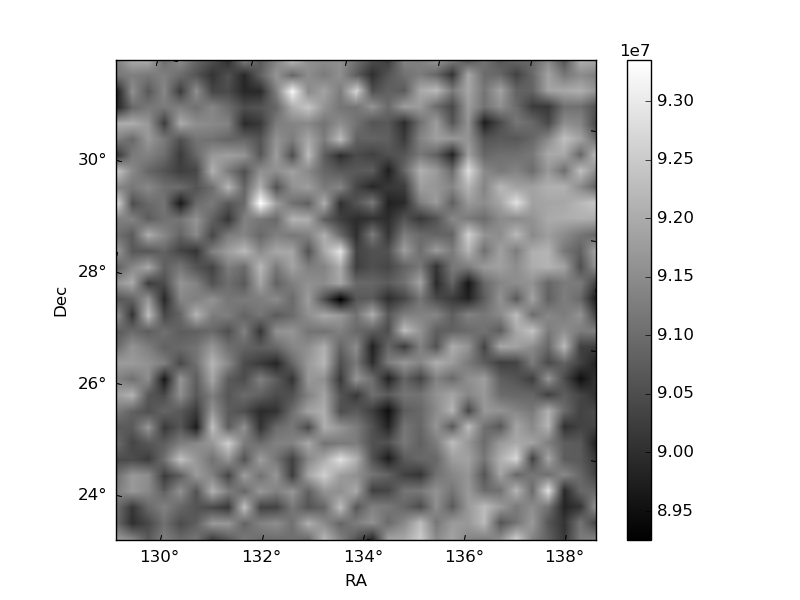
Histogram calculated using DETX and DETY for each event in the final _common_clean file
| Quadrant A | 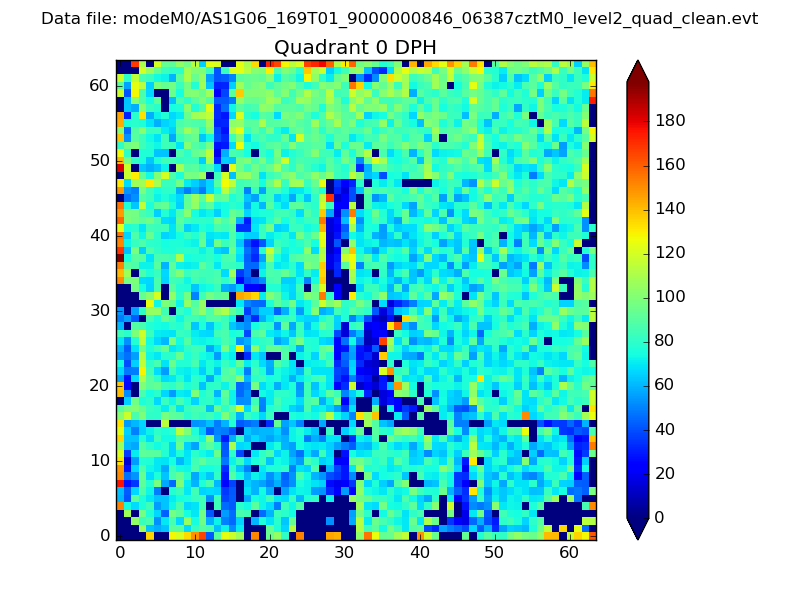 |
 |
Quadrant B |
|---|---|---|---|
| Quadrant D |  |
 |
Quadrant C |
| Plot type | Count rate plots | Images |
|---|---|---|
| Comparison with Poisson distribution Blue bars denote a histogram of data divided into 1 sec bins. Red curve is a Poisson curve with rate = median count rate of data. |
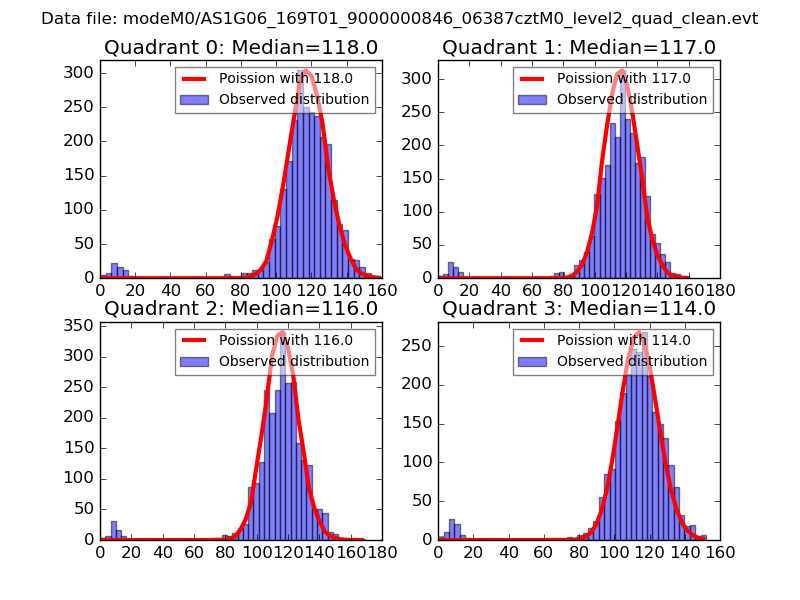 |
 |
| Quadrant-wise count rates Data is divided into 100 sec bins |
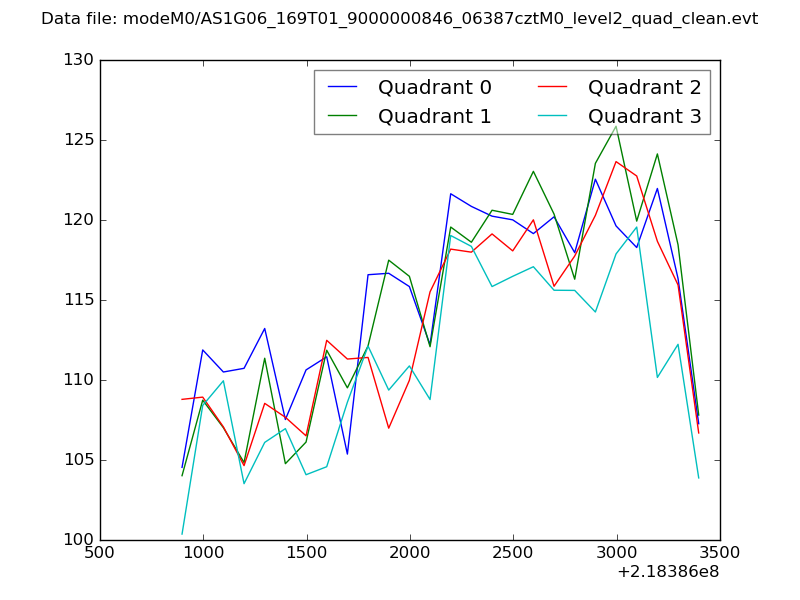 |
|
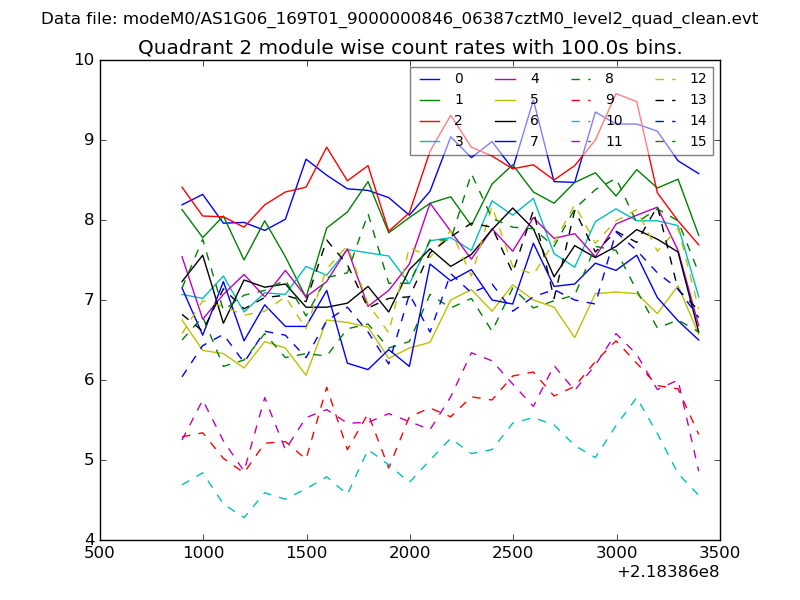
| Module-wise count rates for Quadrant A Data is divided into 100 sec bins |
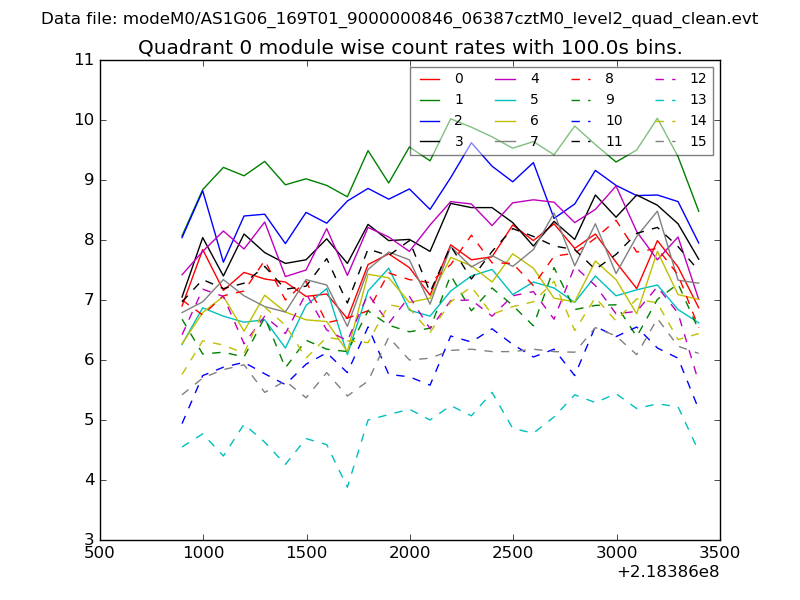 |
 |
| Module-wise count rates for Quadrant B Data is divided into 100 sec bins |
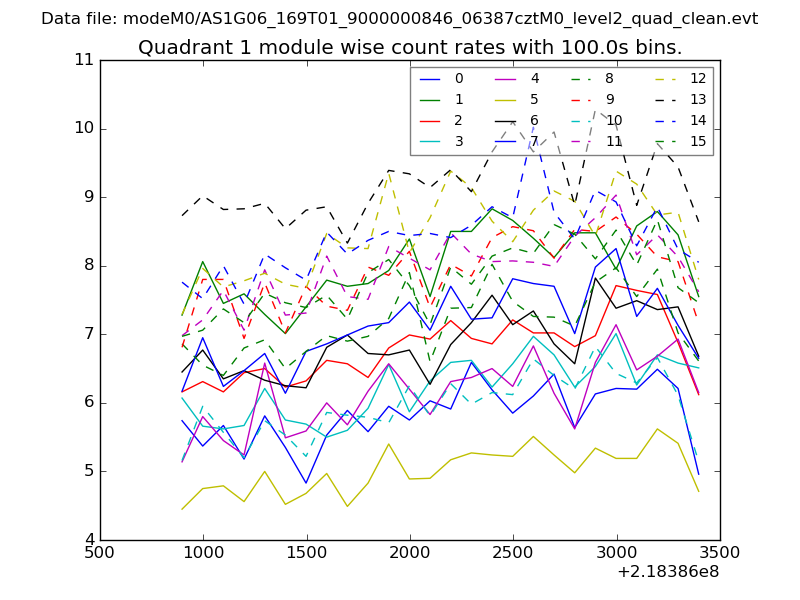 |
 |
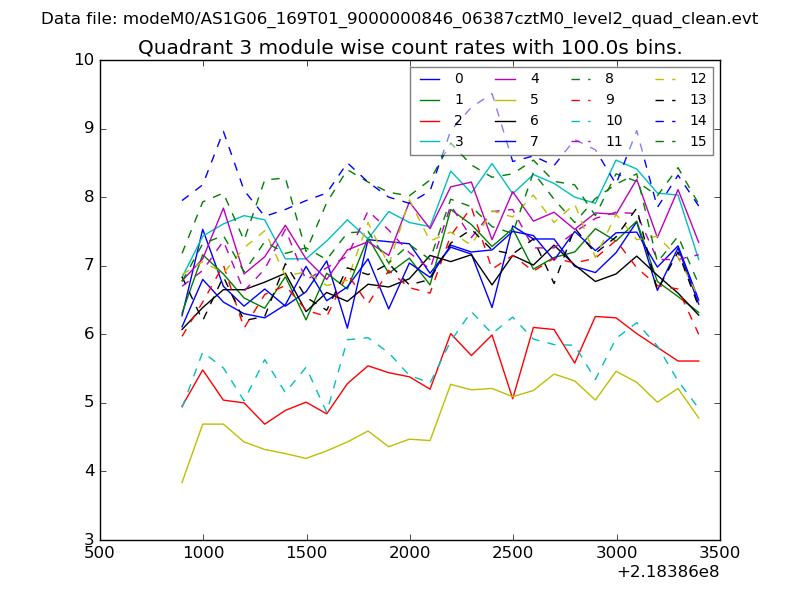
| Module-wise count rates for Quadrant C Data is divided into 100 sec bins |
 |
 |
| Module-wise count rates for Quadrant D Data is divided into 100 sec bins |
 |
 |
| Parameter | Plot |
|---|---|
| CZT HV Monitor | 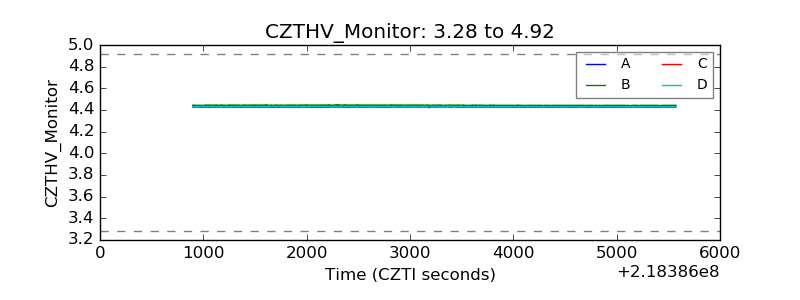 |
| D_VDD | 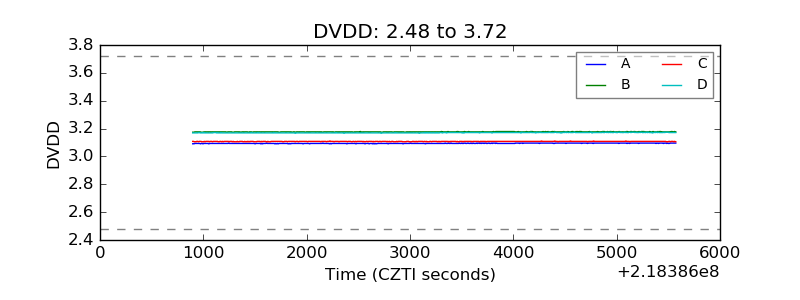 |
| Temperature 1 | 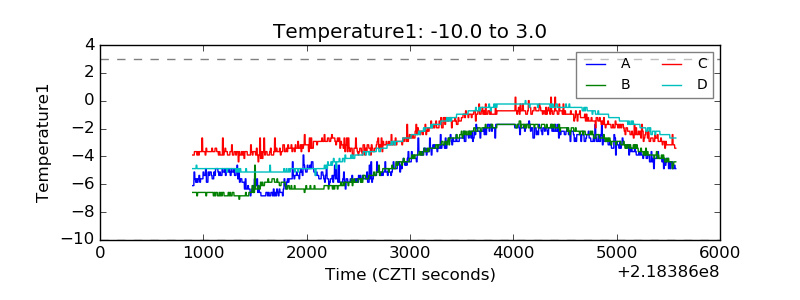 |
| Veto HV Monitor | 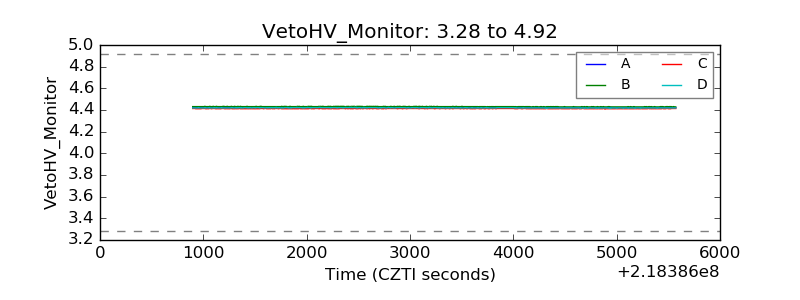 |
| Veto LLD | 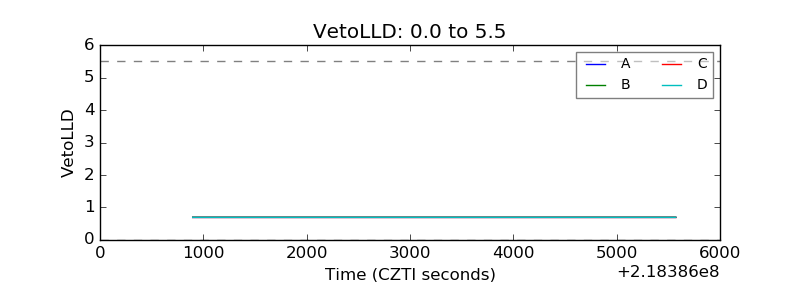 |
| Alpha Counter | 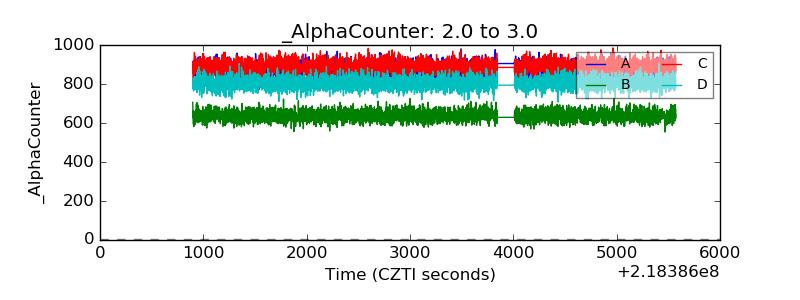 |
| _CPM_Rate | 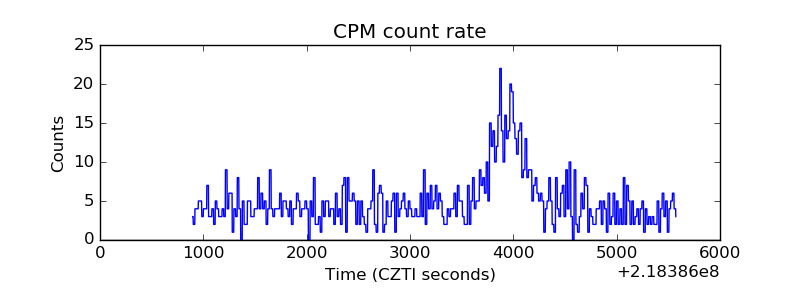 |
| CZT Counter | 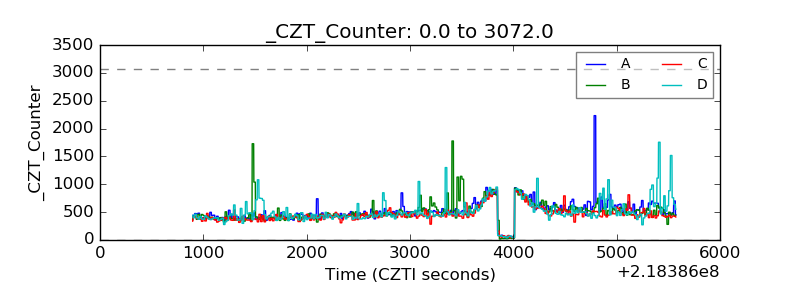 |
| +2.5 Volts monitor |  |
| +5 Volts monitor | 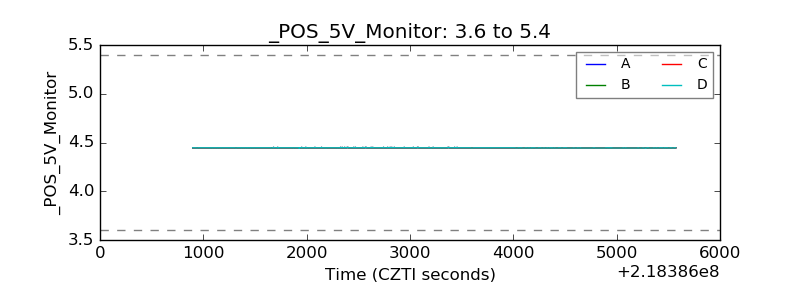 |
| _ROLL_ROT | 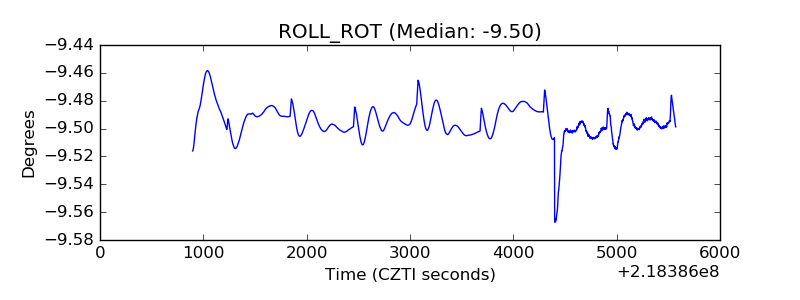 |
| _Roll_DEC | 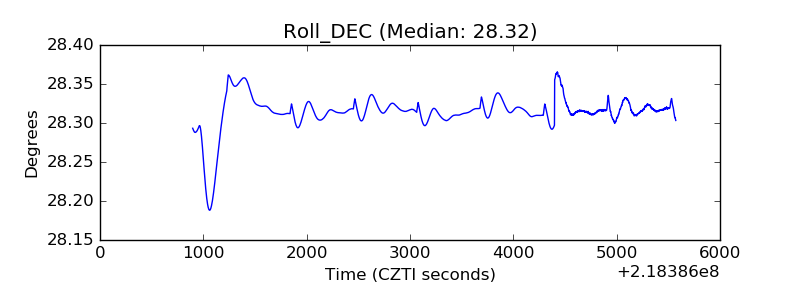 |
| _Roll_RA | 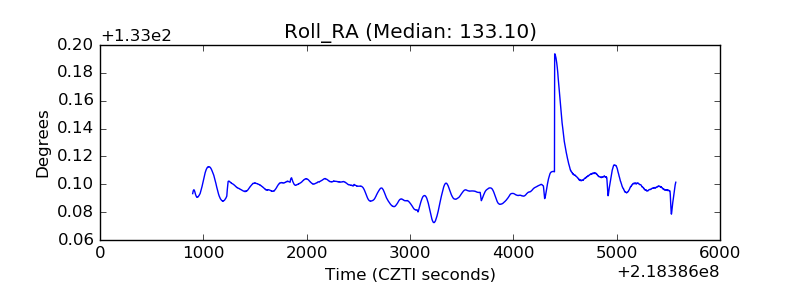 |
| Veto Counter | 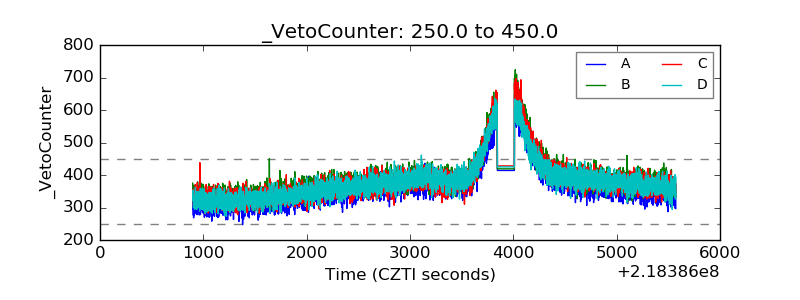 |