| Param | Original file | Final file |
|---|---|---|
| Filename | modeM0/AS1G06_169T01_9000000846_06391cztM0_level2.evt | modeM0/AS1G06_169T01_9000000846_06391cztM0_level2_quad_clean.evt |
| Size (bytes) | 559,005,120 | 73,454,400 |
| Size | 533.1 MB | 70.1 MB |
| Events in quadrant A | 4,974,961 | 435,334 |
| Events in quadrant B | 3,927,420 | 432,751 |
| Events in quadrant C | 3,335,238 | 428,674 |
| Events in quadrant D | 4,196,707 | 419,517 |
| Mode M0 | |||
|---|---|---|---|
| Quadrant | BADHDUFLAG | Total packets | Discarded packets |
| A | 0 | 19902 | 3 |
| B | 0 | 16592 | 2 |
| C | 0 | 15127 | 2 |
| D | 0 | 17529 | 2 |
| Mode SS | |||
|---|---|---|---|
| Quadrant | BADHDUFLAG | Total packets | Discarded packets |
| A | 0 | 148 | 0 |
| B | 0 | 148 | 0 |
| C | 0 | 148 | 0 |
| D | 0 | 148 | 0 |
| Mode M9 | |||
|---|---|---|---|
| Quadrant | BADHDUFLAG | Total packets | Discarded packets |
| A | 0 | 2 | 0 |
| B | 0 | 2 | 0 |
| C | 0 | 2 | 0 |
| D | 0 | 3 | 0 |
| Quadrant | Total seconds | Saturated seconds | Saturation percentage |
|---|---|---|---|
| A | 7295 | 720 | 9.869774% |
| B | 7295 | 227 | 3.111720% |
| C | 7295 | 100 | 1.370802% |
| D | 7295 | 230 | 3.152844% |
Noise dominated data is calculated using 1-second bins in cleaned event files. If a bin has >2000 counts, and if more than 50% of those come from <1% of pixels, then it is considered to be noise-dominated and hence unusable.
| Quadrant | # 1 sec bins | Bins with >0 counts | Bins with >2000 counts | High rate bins dominated by noise | Noise dominated (total time) | Noise dominated (detector-on time) | Marked lightcurve |
|---|---|---|---|---|---|---|---|
| A | 7545 | 7296 | 263 | 263 | 3.49% | 3.60% | 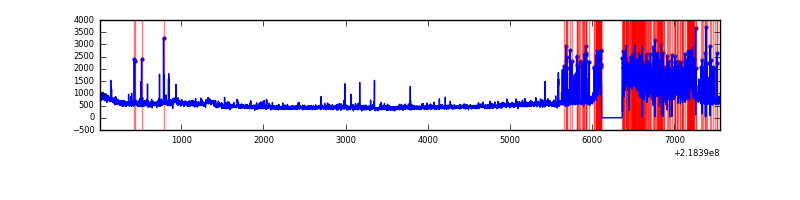 |
| B | 7545 | 7296 | 18 | 18 | 0.24% | 0.25% | 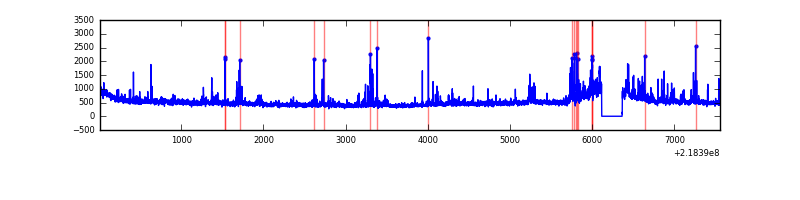 |
| C | 7545 | 7296 | 0 | 0 | 0.00% | 0.00% | 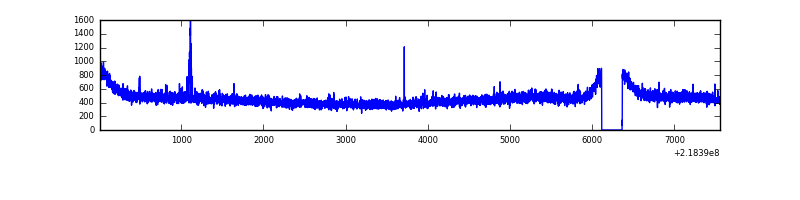 |
| D | 7545 | 7296 | 89 | 89 | 1.18% | 1.22% | 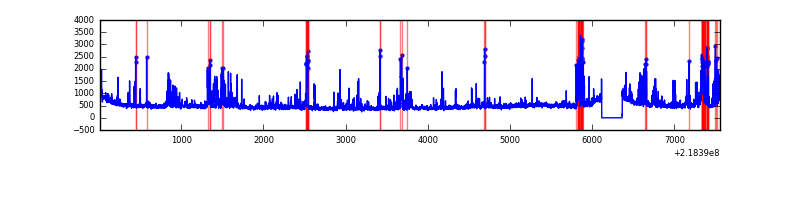 |
Top three noisy pixels from each quadrant. If the there are fewer than three noisy pixels in the level2.evt file, extra rows are filled as -1
| Pixel properties | Quadrant properties | ||||||
|---|---|---|---|---|---|---|---|
| Quadrant | DetID | PixID | Counts | Sigma | Mean | Median | Sigma |
| A | 8 | 15 | 1714920 | 10036.26 | 837 | 819 | 170.8 |
| A | 13 | 251 | 12374 | 67.66 | 837 | 819 | 170.8 |
| A | 15 | 236 | 8707 | 46.19 | 837 | 819 | 170.8 |
| B | 0 | 228 | 176987 | 1040.52 | 873 | 850 | 169.3 |
| B | 4 | 81 | 107933 | 632.59 | 873 | 850 | 169.3 |
| B | 4 | 170 | 79435 | 464.24 | 873 | 850 | 169.3 |
| C | 9 | 54 | 21398 | 104.25 | 845 | 845 | 197.1 |
| C | 13 | 61 | 6823 | 30.32 | 845 | 845 | 197.1 |
| C | 1 | 16 | 4557 | 18.83 | 845 | 845 | 197.1 |
| D | 2 | 136 | 347233 | 1634.11 | 850 | 819 | 212.0 |
| D | 13 | 105 | 190055 | 892.66 | 850 | 819 | 212.0 |
| D | 2 | 152 | 116879 | 547.48 | 850 | 819 | 212.0 |
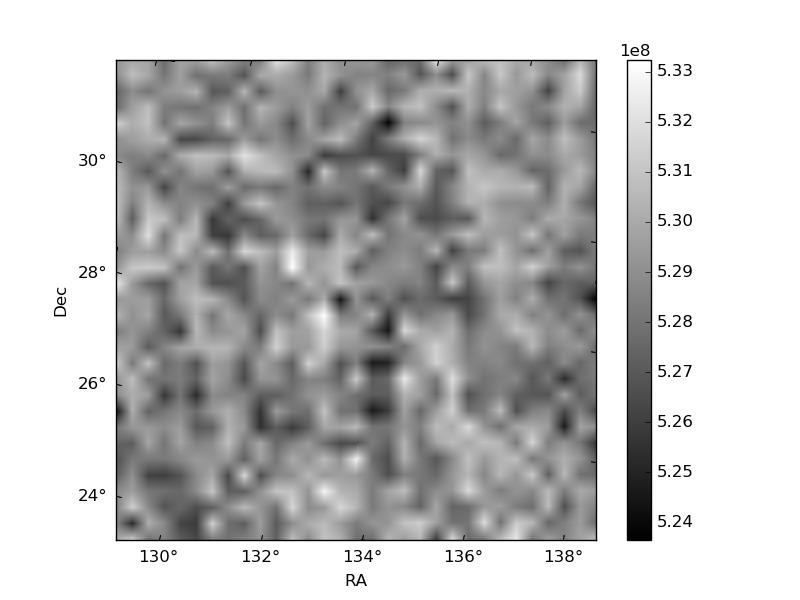
Histogram calculated using DETX and DETY for each event in the final _common_clean file
| Quadrant A | 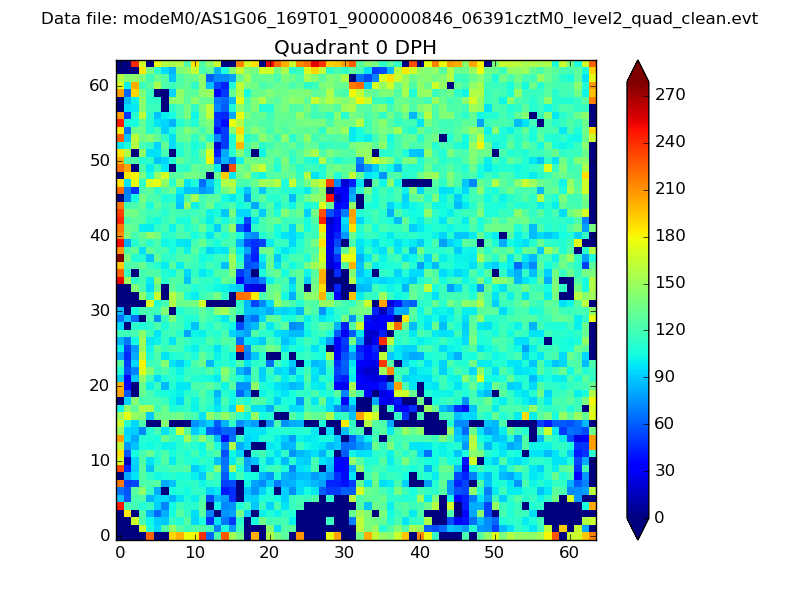 |
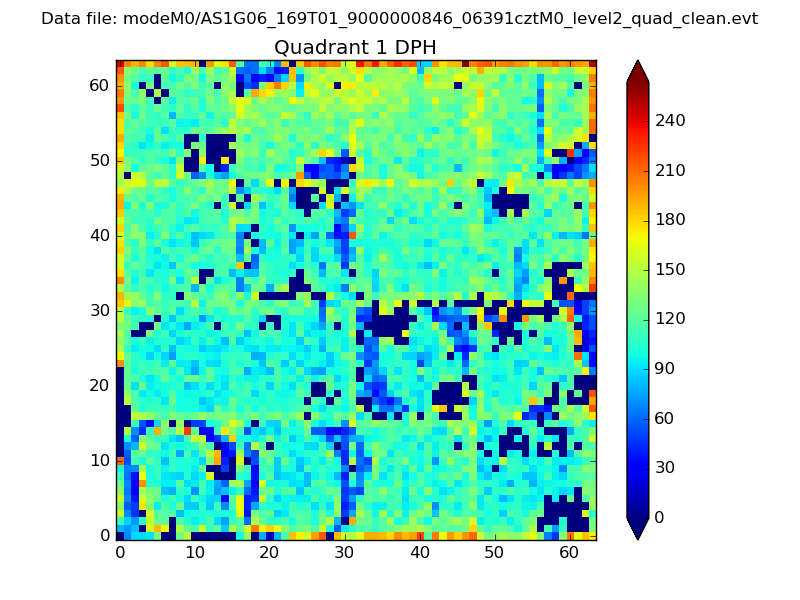 |
Quadrant B |
|---|---|---|---|
| Quadrant D | 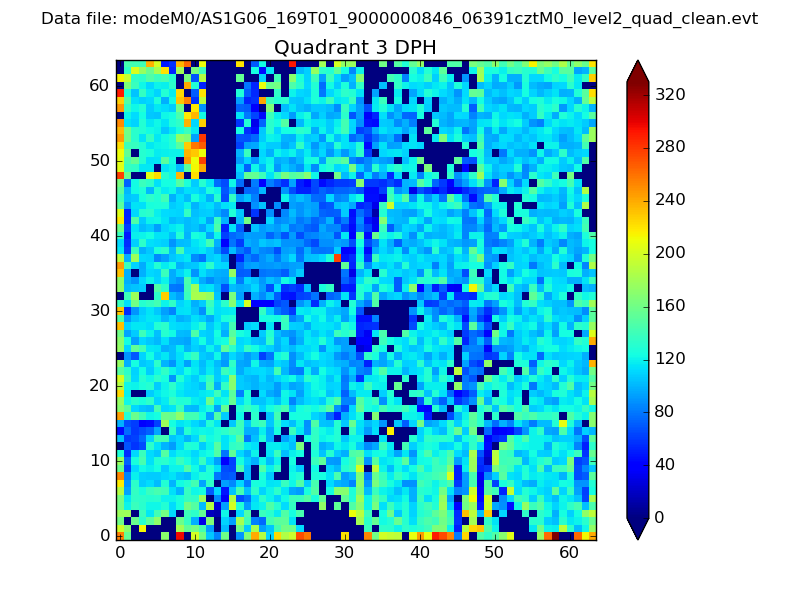 |
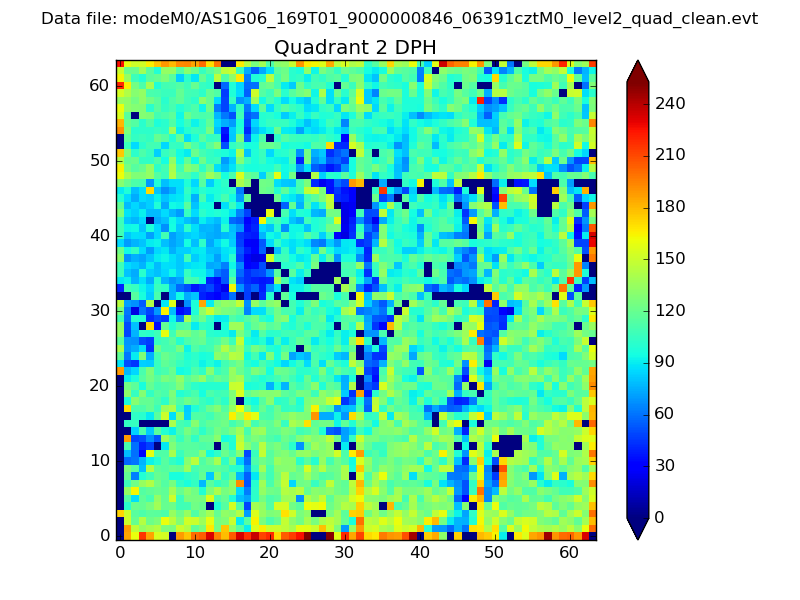 |
Quadrant C |
| Plot type | Count rate plots | Images |
|---|---|---|
| Comparison with Poisson distribution Blue bars denote a histogram of data divided into 1 sec bins. Red curve is a Poisson curve with rate = median count rate of data. |
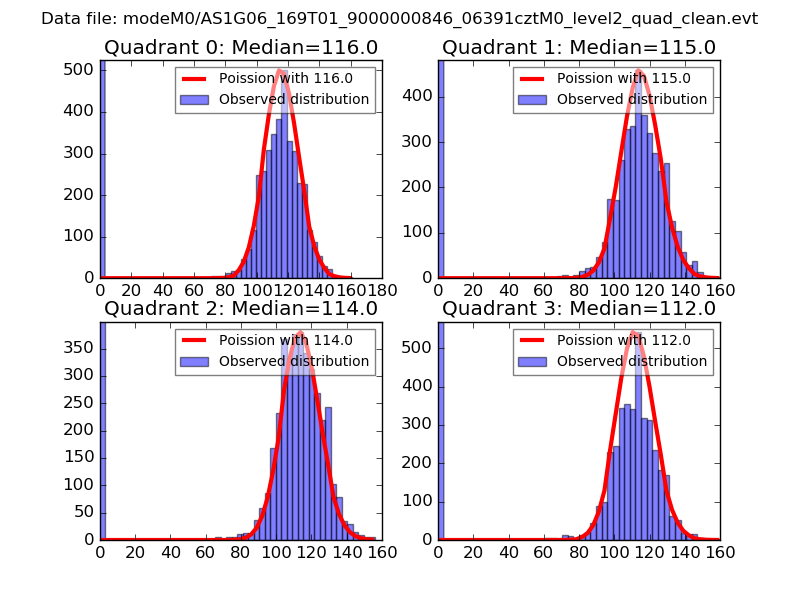 |
 |
| Quadrant-wise count rates Data is divided into 100 sec bins |
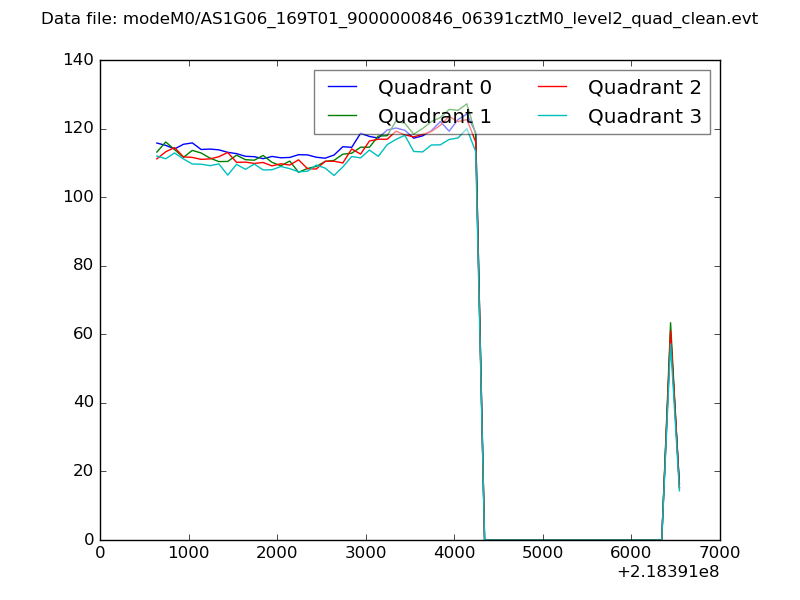 |
|
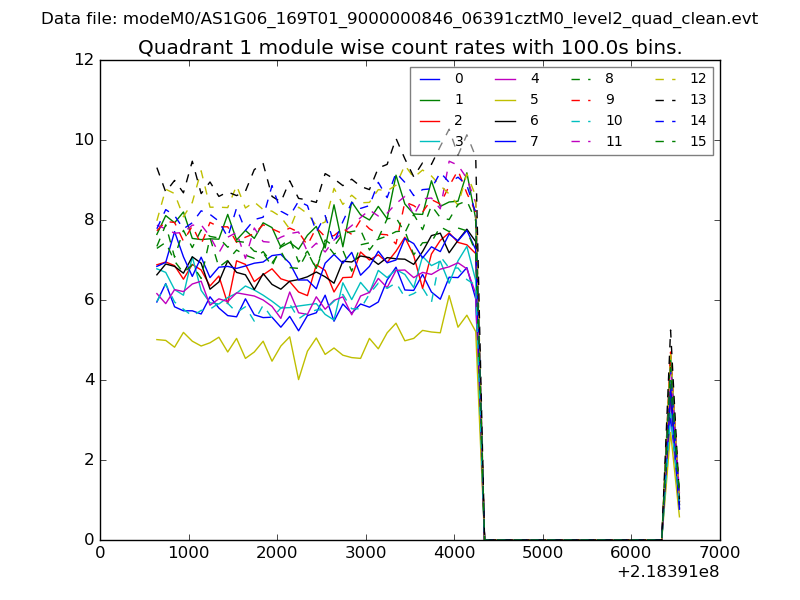
| Module-wise count rates for Quadrant A Data is divided into 100 sec bins |
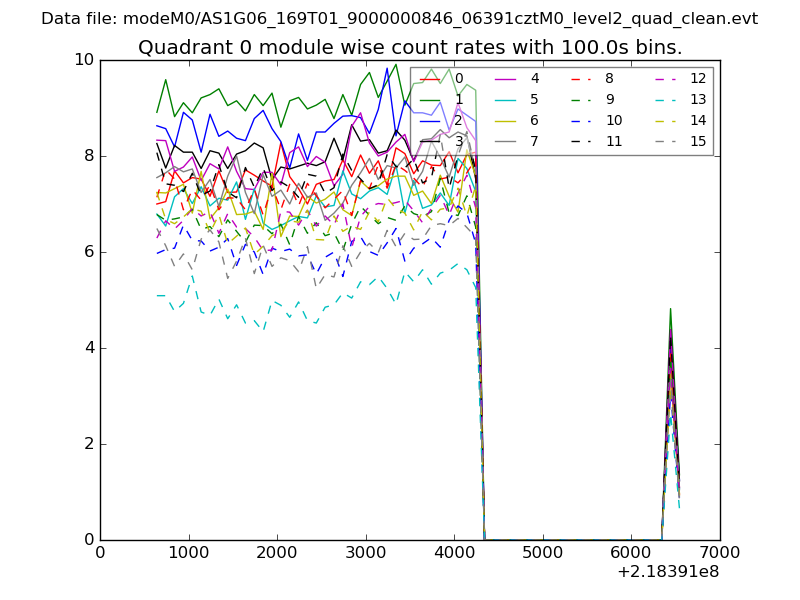 |
 |
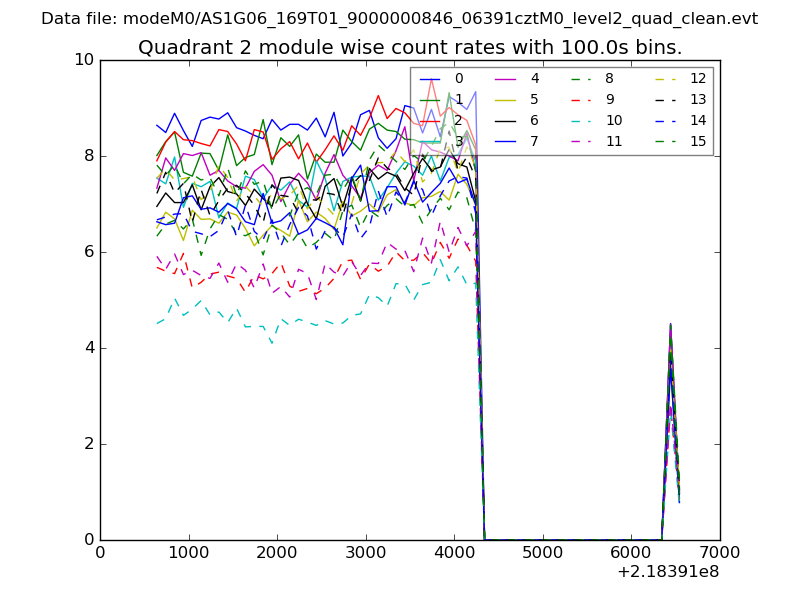
| Module-wise count rates for Quadrant B Data is divided into 100 sec bins |
 |
 |
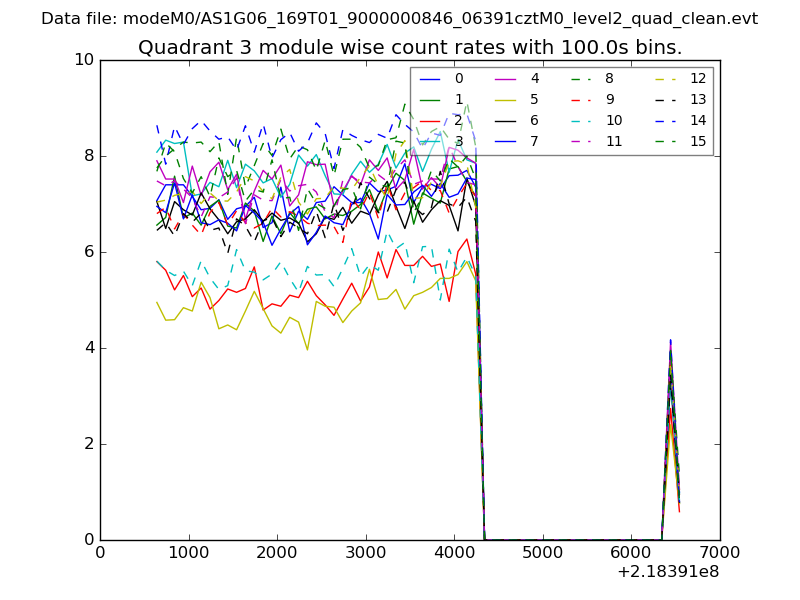
| Module-wise count rates for Quadrant C Data is divided into 100 sec bins |
 |
 |
| Module-wise count rates for Quadrant D Data is divided into 100 sec bins |
 |
 |
| Parameter | Plot |
|---|---|
| CZT HV Monitor | 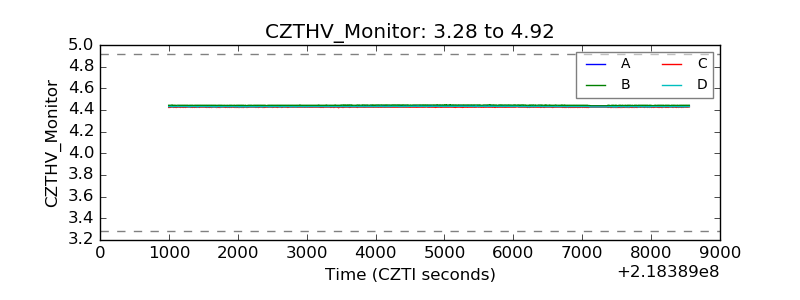 |
| D_VDD | 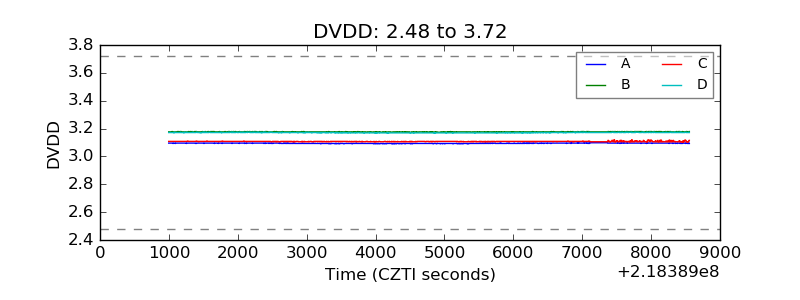 |
| Temperature 1 | 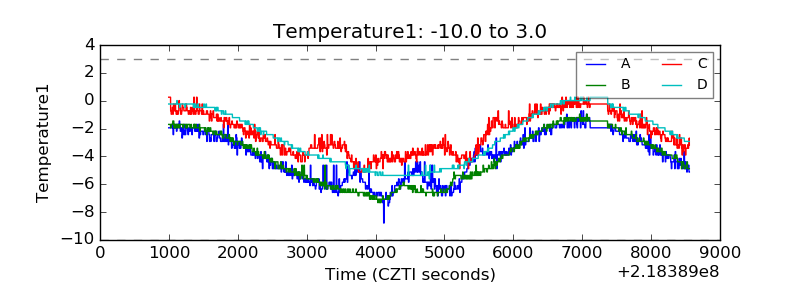 |
| Veto HV Monitor | 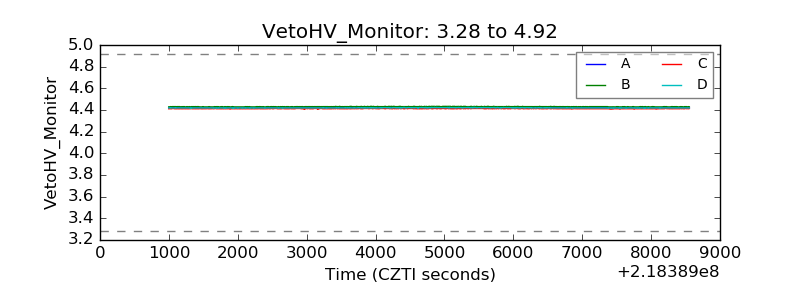 |
| Veto LLD | 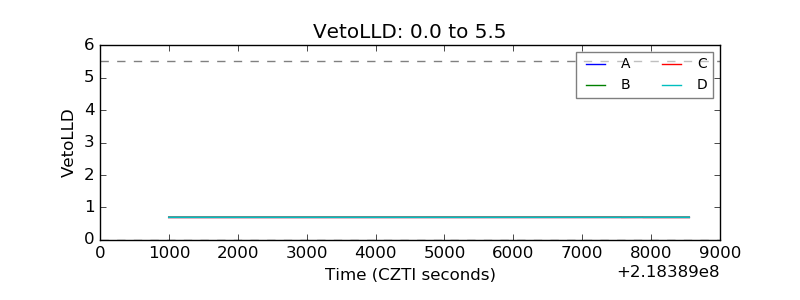 |
| Alpha Counter | 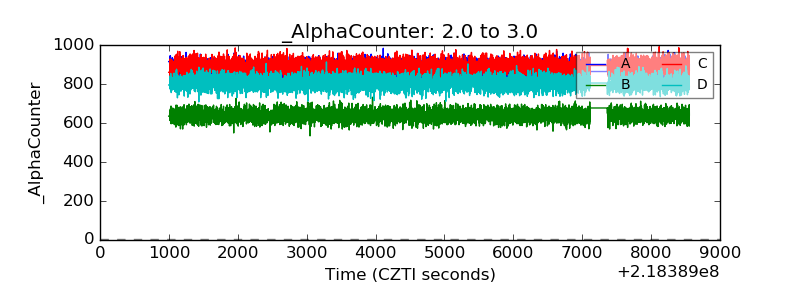 |
| _CPM_Rate | 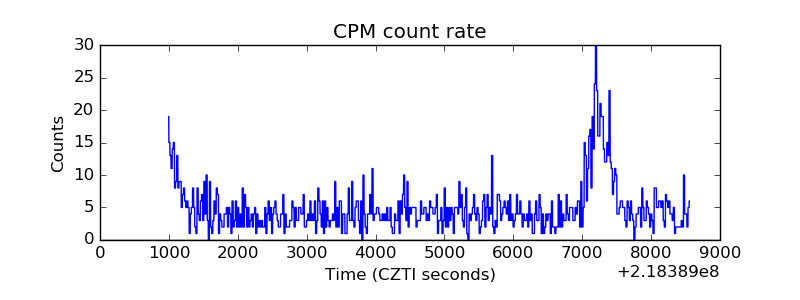 |
| CZT Counter | 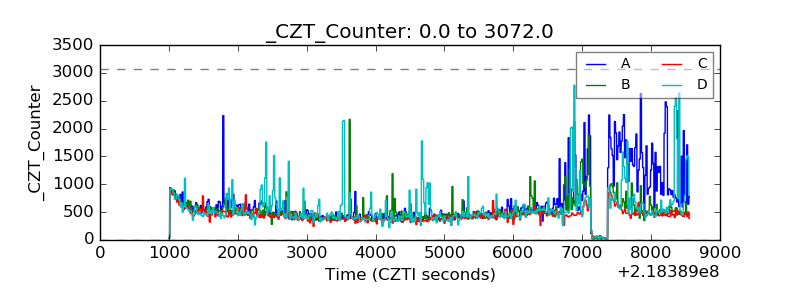 |
| +2.5 Volts monitor |  |
| +5 Volts monitor |  |
| _ROLL_ROT | 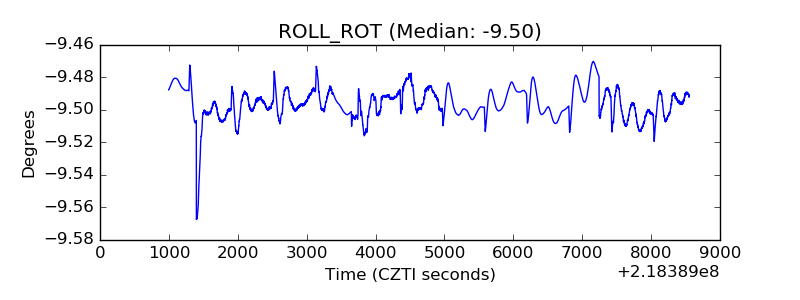 |
| _Roll_DEC | 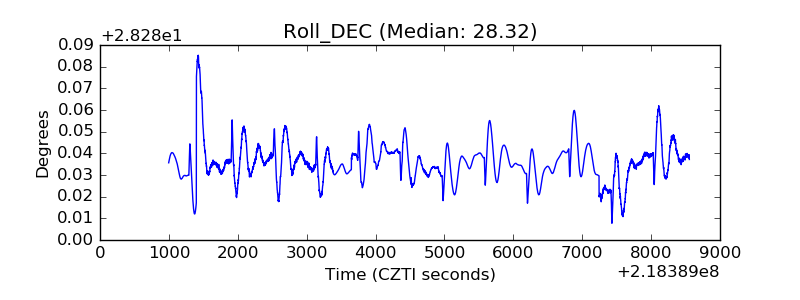 |
| _Roll_RA |  |
| Veto Counter | 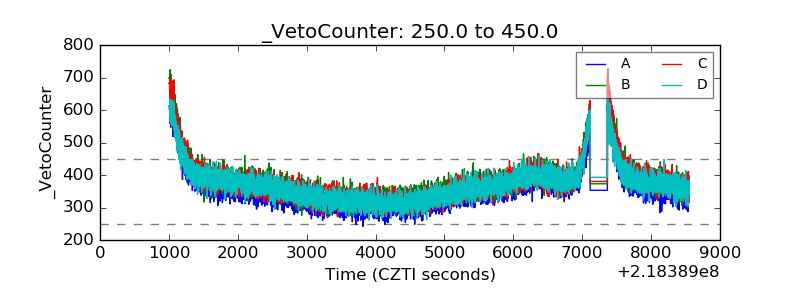 |