| Param | Original file | Final file |
|---|---|---|
| Filename | modeM0/AS1C02_011T01_9000000850cztM0_level2.fits | modeM0/AS1C02_011T01_9000000850cztM0_level2_quad_clean.evt |
| Size (bytes) | 1,031,477,760 | 1,017,832,320 |
| Size | 983.7 MB | 970.7 MB |
| Events in quadrant A | 6,234,648 | 6,084,708 |
| Events in quadrant B | 6,060,396 | 6,113,098 |
| Events in quadrant C | 6,170,480 | 5,929,068 |
| Events in quadrant D | 5,204,982 | 5,134,867 |
| Mode SS | |||
|---|---|---|---|
| Quadrant | BADHDUFLAG | Total packets | Discarded packets |
| A | 0 | 2248 | 0 |
| B | 0 | 2248 | 0 |
| C | 0 | 2248 | 0 |
| D | 0 | 2248 | 0 |
| Mode M0 | |||
|---|---|---|---|
| Quadrant | BADHDUFLAG | Total packets | Discarded packets |
| A | 0 | 238820 | 0 |
| B | 0 | 238752 | 0 |
| C | 0 | 233098 | 0 |
| D | 0 | 283249 | 0 |
| Mode M9 | |||
|---|---|---|---|
| Quadrant | BADHDUFLAG | Total packets | Discarded packets |
| A | 0 | 145 | 0 |
| B | 0 | 145 | 0 |
| C | 0 | 145 | 0 |
| D | 0 | 145 | 0 |
| Quadrant | Total seconds | Saturated seconds | Saturation percentage |
|---|---|---|---|
| A | 110364 | 2019 | 1.829401% |
| B | 110364 | 2423 | 2.195462% |
| C | 110364 | 1078 | 0.976768% |
| D | 110364 | 6497 | 5.886883% |
Noise dominated data is calculated using 1-second bins in cleaned event files. If a bin has >2000 counts, and if more than 50% of those come from <1% of pixels, then it is considered to be noise-dominated and hence unusable.
| Quadrant | # 1 sec bins | Bins with >0 counts | Bins with >2000 counts | High rate bins dominated by noise | Noise dominated (total time) | Noise dominated (detector-on time) | Marked lightcurve |
|---|---|---|---|---|---|---|---|
| A | 124020 | 110362 | 0 | 0 | 0.00% | 0.00% |  |
| B | 124020 | 110361 | 0 | 0 | 0.00% | 0.00% |  |
| C | 124020 | 110363 | 0 | 0 | 0.00% | 0.00% |  |
| D | 124020 | 110228 | 0 | 0 | 0.00% | 0.00% |  |
Top three noisy pixels from each quadrant. If the there are fewer than three noisy pixels in the level2.evt file, extra rows are filled as -1
| Pixel properties | Quadrant properties | ||||||
|---|---|---|---|---|---|---|---|
| Quadrant | DetID | PixID | Counts | Sigma | Mean | Median | Sigma |
| A | 0 | 29 | 5935 | 10.8 | 1620 | 1510 | 409.7 |
| A | 7 | 110 | 5329 | 9.32 | 1620 | 1510 | 409.7 |
| A | 0 | 30 | 4737 | 7.88 | 1620 | 1510 | 409.7 |
| B | 2 | 9 | 5109 | 10.99 | 1597 | 1512 | 327.3 |
| B | 14 | 254 | 4127 | 7.99 | 1597 | 1512 | 327.3 |
| B | 12 | 226 | 4070 | 7.82 | 1597 | 1512 | 327.3 |
| C | 12 | 241 | 4408 | 6.66 | 1629 | 1501 | 436.3 |
| C | 1 | 80 | 4389 | 6.62 | 1629 | 1501 | 436.3 |
| C | 1 | 81 | 4343 | 6.51 | 1629 | 1501 | 436.3 |
| D | 3 | 14 | 4005 | 6.62 | 1484 | 1344 | 401.7 |
| D | 6 | 231 | 3799 | 6.11 | 1484 | 1344 | 401.7 |
| D | 7 | 5 | 3771 | 6.04 | 1484 | 1344 | 401.7 |
Histogram calculated using DETX and DETY for each event in the final _common_clean file
| Quadrant A |  |
 |
Quadrant B |
|---|---|---|---|
| Quadrant D |  |
 |
Quadrant C |
| Plot type | Count rate plots | Images |
|---|---|---|
| Comparison with Poisson distribution Blue bars denote a histogram of data divided into 1 sec bins. Red curve is a Poisson curve with rate = median count rate of data. |
 |
 |
| Quadrant-wise count rates Data is divided into 100 sec bins |
 |
|
| Module-wise count rates for Quadrant A Data is divided into 100 sec bins |
 |
 |
| Module-wise count rates for Quadrant B Data is divided into 100 sec bins |
 |
 |
| Module-wise count rates for Quadrant C Data is divided into 100 sec bins |
 |
 |
| Module-wise count rates for Quadrant D Data is divided into 100 sec bins |
 |
 |
| Parameter | Plot |
|---|---|
| CZT HV Monitor |  |
| D_VDD | 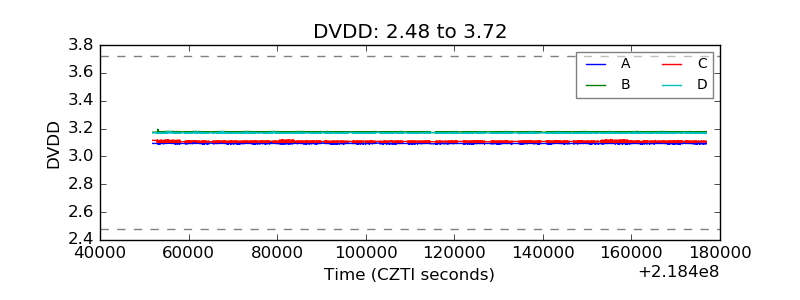 |
| Temperature 1 |  |
| Veto HV Monitor |  |
| Veto LLD |  |
| Alpha Counter |  |
| _CPM_Rate |  |
| CZT Counter |  |
| +2.5 Volts monitor |  |
| +5 Volts monitor |  |
| _ROLL_ROT |  |
| _Roll_DEC |  |
| _Roll_RA |  |
| Veto Counter |  |