| Param | Original file | Final file |
|---|---|---|
| Filename | modeM0/AS1C02_011T01_9000000850_06398cztM0_level2.evt | modeM0/AS1C02_011T01_9000000850_06398cztM0_level2_quad_clean.evt |
| Size (bytes) | 102,435,840 | 9,593,280 |
| Size | 97.7 MB | 9.1 MB |
| Events in quadrant A | 780,440 | 45,181 |
| Events in quadrant B | 741,853 | 47,756 |
| Events in quadrant C | 737,629 | 47,641 |
| Events in quadrant D | 745,233 | 45,735 |
| Mode SS | |||
|---|---|---|---|
| Quadrant | BADHDUFLAG | Total packets | Discarded packets |
| A | 0 | 28 | 0 |
| B | 0 | 28 | 0 |
| C | 0 | 28 | 0 |
| D | 0 | 28 | 0 |
| Mode M0 | |||
|---|---|---|---|
| Quadrant | BADHDUFLAG | Total packets | Discarded packets |
| A | 0 | 3142 | 2 |
| B | 0 | 2961 | 1 |
| C | 0 | 2972 | 1 |
| D | 0 | 3027 | 1 |
| Mode M9 | |||
|---|---|---|---|
| Quadrant | BADHDUFLAG | Total packets | Discarded packets |
| A | 0 | 10 | 0 |
| B | 0 | 10 | 0 |
| C | 0 | 10 | 0 |
| D | 0 | 10 | 0 |
| Quadrant | Total seconds | Saturated seconds | Saturation percentage |
|---|---|---|---|
| A | 1385 | 36 | 2.599278% |
| B | 1385 | 39 | 2.815884% |
| C | 1385 | 22 | 1.588448% |
| D | 1385 | 27 | 1.949458% |
Noise dominated data is calculated using 1-second bins in cleaned event files. If a bin has >2000 counts, and if more than 50% of those come from <1% of pixels, then it is considered to be noise-dominated and hence unusable.
| Quadrant | # 1 sec bins | Bins with >0 counts | Bins with >2000 counts | High rate bins dominated by noise | Noise dominated (total time) | Noise dominated (detector-on time) | Marked lightcurve |
|---|---|---|---|---|---|---|---|
| A | 1385 | 1385 | 0 | 0 | 0.00% | 0.00% | 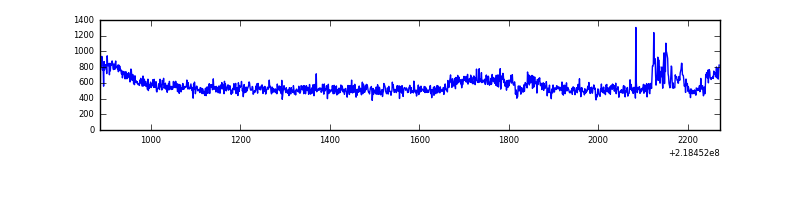 |
| B | 1385 | 1385 | 0 | 0 | 0.00% | 0.00% | 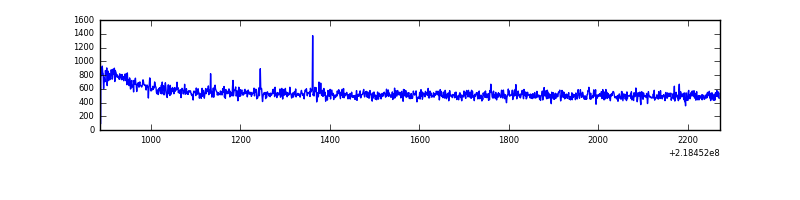 |
| C | 1385 | 1385 | 0 | 0 | 0.00% | 0.00% | 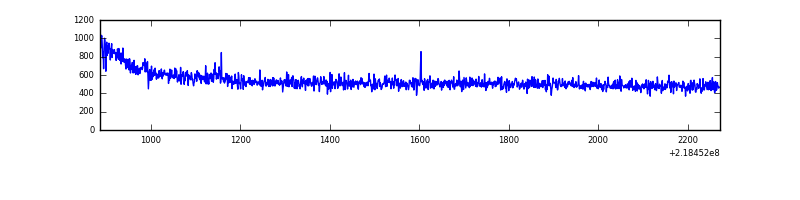 |
| D | 1385 | 1385 | 0 | 0 | 0.00% | 0.00% | 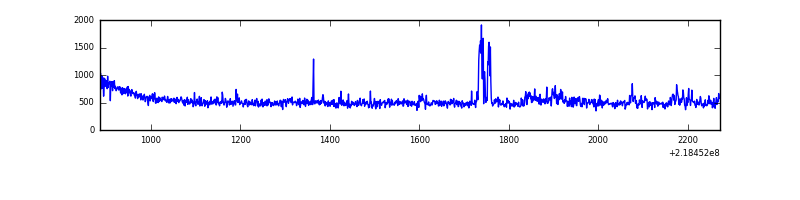 |
Top three noisy pixels from each quadrant. If the there are fewer than three noisy pixels in the level2.evt file, extra rows are filled as -1
| Pixel properties | Quadrant properties | ||||||
|---|---|---|---|---|---|---|---|
| Quadrant | DetID | PixID | Counts | Sigma | Mean | Median | Sigma |
| A | 15 | 236 | 34910 | 869.24 | 187 | 183 | 40.0 |
| A | 13 | 251 | 14912 | 368.68 | 187 | 183 | 40.0 |
| A | 8 | 15 | 8303 | 203.25 | 187 | 183 | 40.0 |
| B | 12 | 111 | 3781 | 93.3 | 189 | 184 | 38.5 |
| B | 11 | 111 | 2870 | 69.67 | 189 | 184 | 38.5 |
| B | 10 | 246 | 2246 | 53.48 | 189 | 184 | 38.5 |
| C | 1 | 16 | 15949 | 356.8 | 182 | 183 | 44.2 |
| C | 8 | 128 | 4909 | 106.95 | 182 | 183 | 44.2 |
| C | 8 | 112 | 2228 | 46.28 | 182 | 183 | 44.2 |
| D | 2 | 152 | 33968 | 730.85 | 182 | 176 | 46.2 |
| D | 11 | 241 | 11823 | 251.9 | 182 | 176 | 46.2 |
| D | 2 | 234 | 4622 | 96.16 | 182 | 176 | 46.2 |
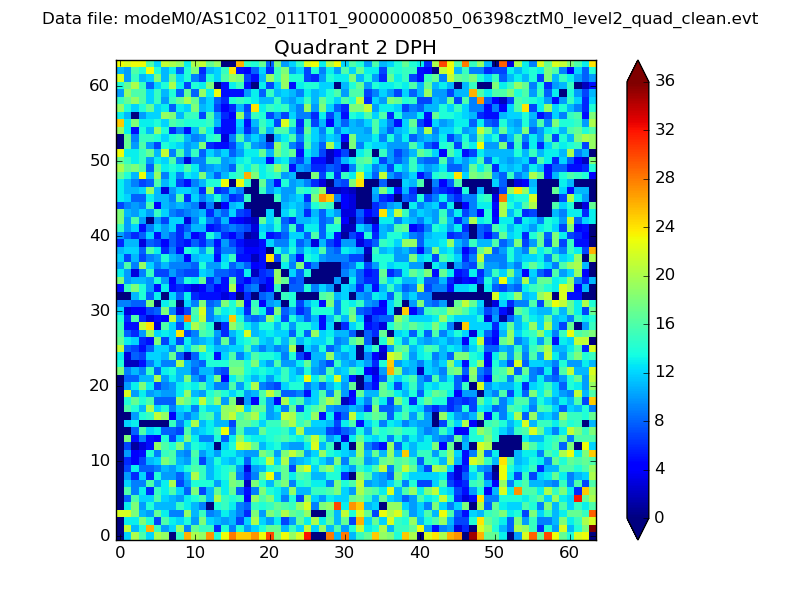
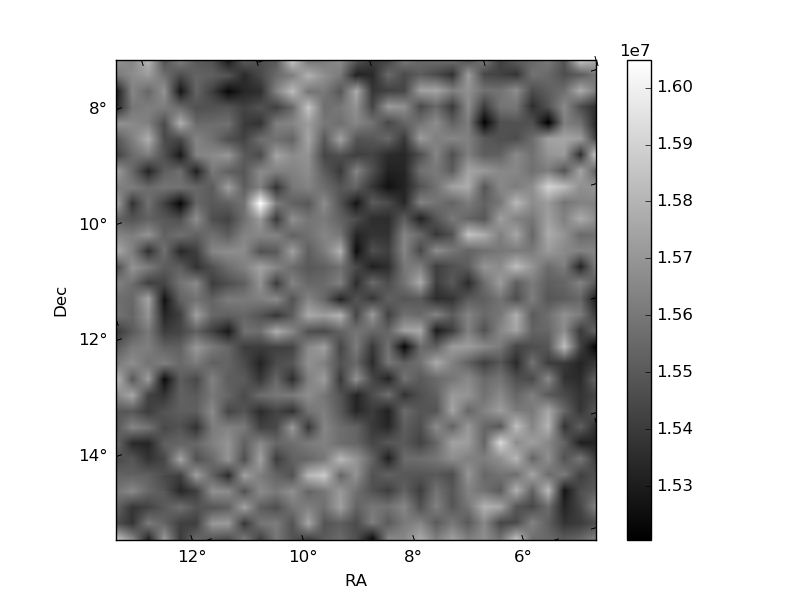
Histogram calculated using DETX and DETY for each event in the final _common_clean file
| Quadrant A | 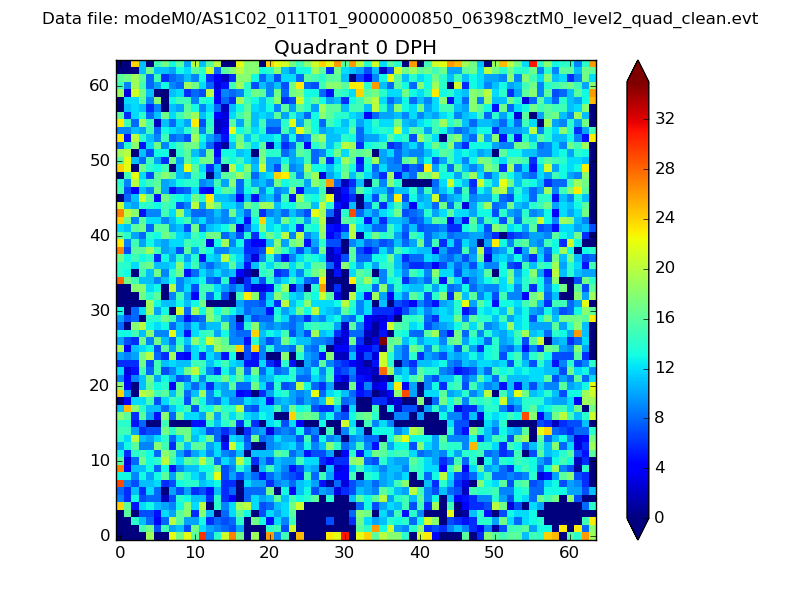 |
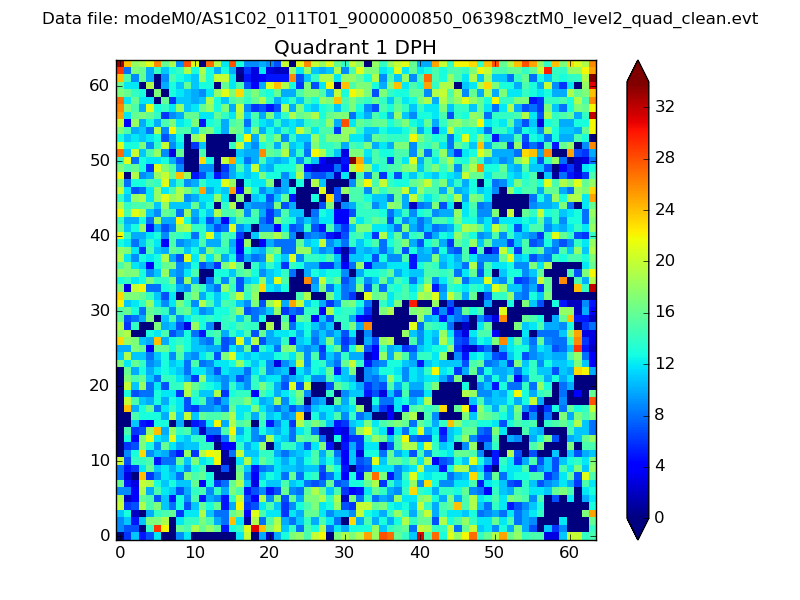 |
Quadrant B |
|---|---|---|---|
| Quadrant D | 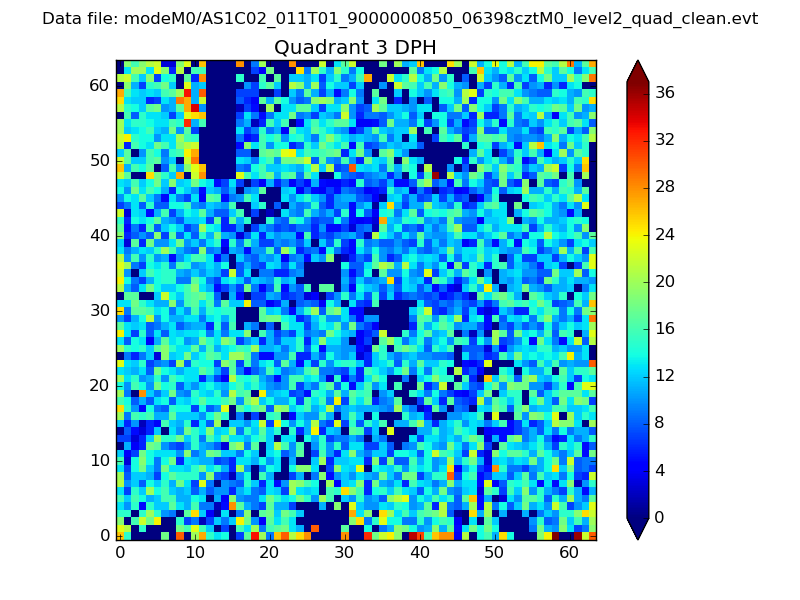 |
 |
Quadrant C |
| Plot type | Count rate plots | Images |
|---|---|---|
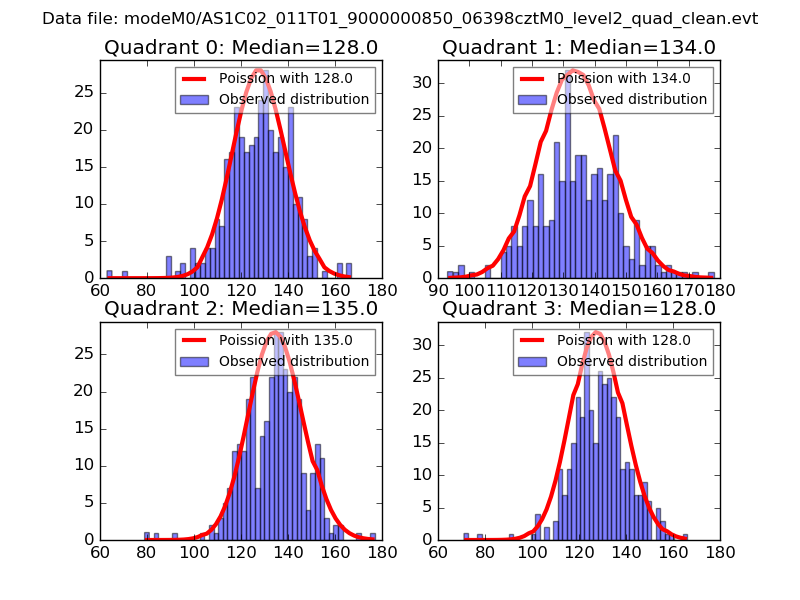
| Comparison with Poisson distribution Blue bars denote a histogram of data divided into 1 sec bins. Red curve is a Poisson curve with rate = median count rate of data. |
 |
 |
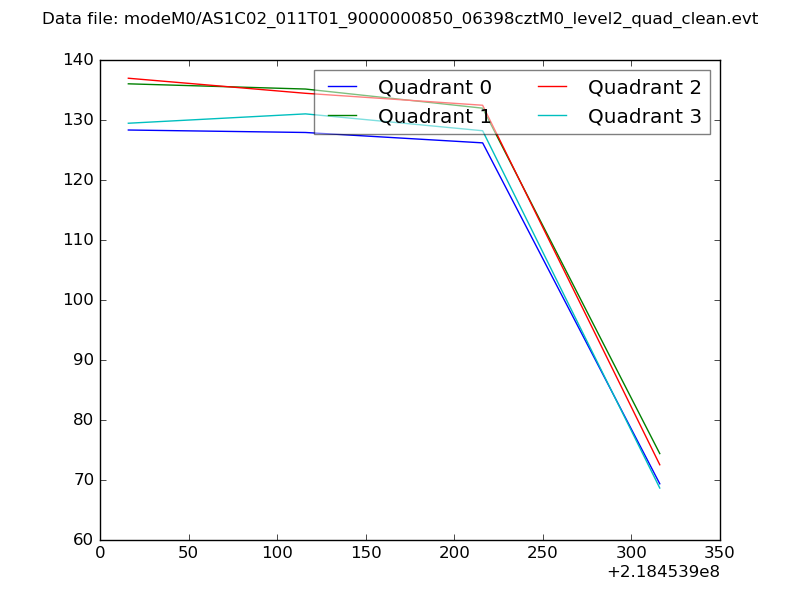
| Quadrant-wise count rates Data is divided into 100 sec bins |
 |
|
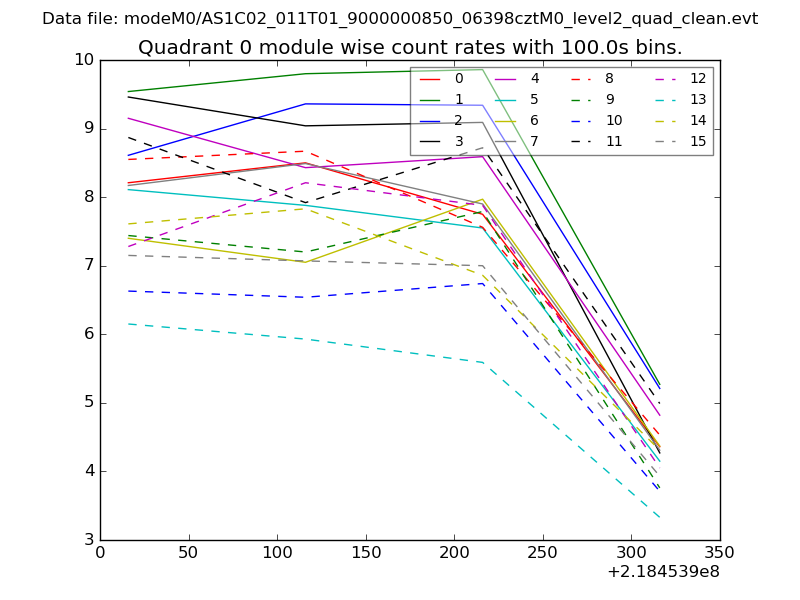
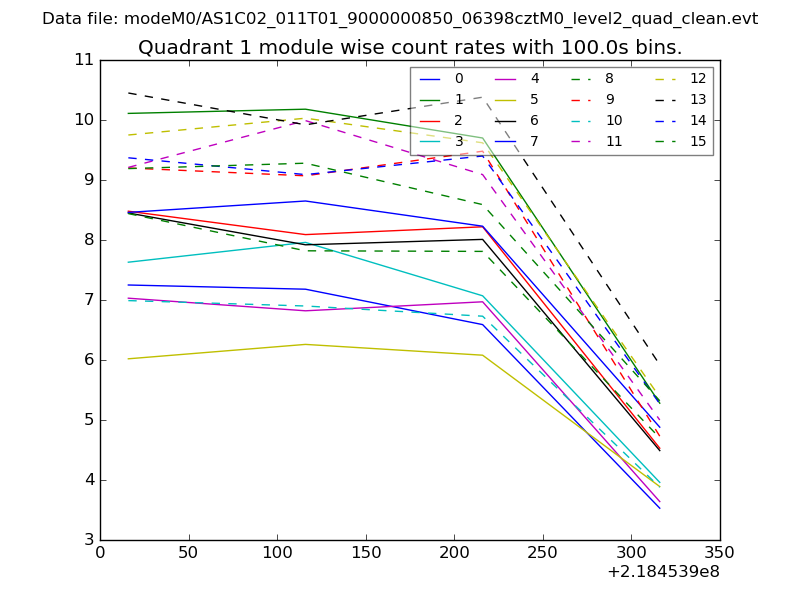
| Module-wise count rates for Quadrant A Data is divided into 100 sec bins |
 |
 |
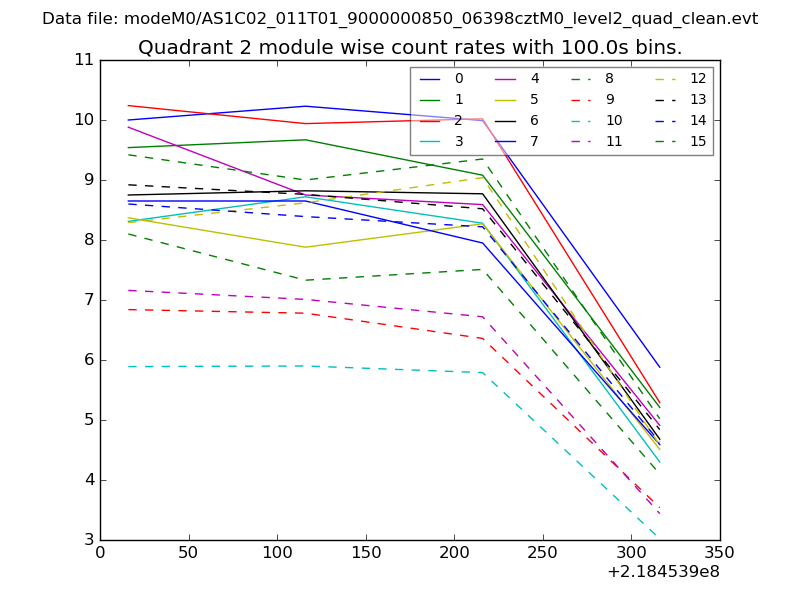
| Module-wise count rates for Quadrant B Data is divided into 100 sec bins |
 |
 |
| Module-wise count rates for Quadrant C Data is divided into 100 sec bins |
 |
 |
| Module-wise count rates for Quadrant D Data is divided into 100 sec bins |
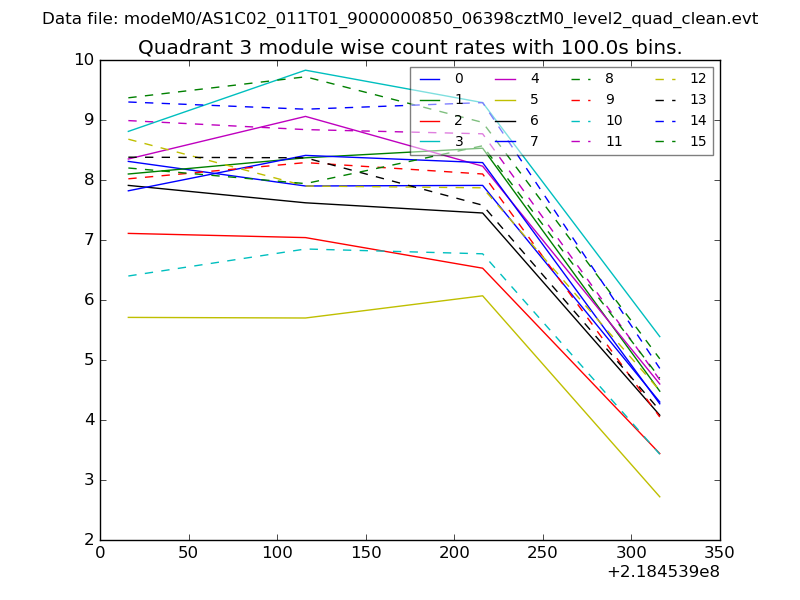 |
 |
| Parameter | Plot |
|---|---|
| CZT HV Monitor | 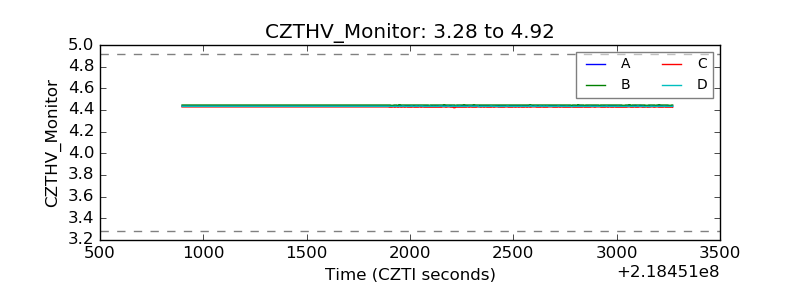 |
| D_VDD |  |
| Temperature 1 | 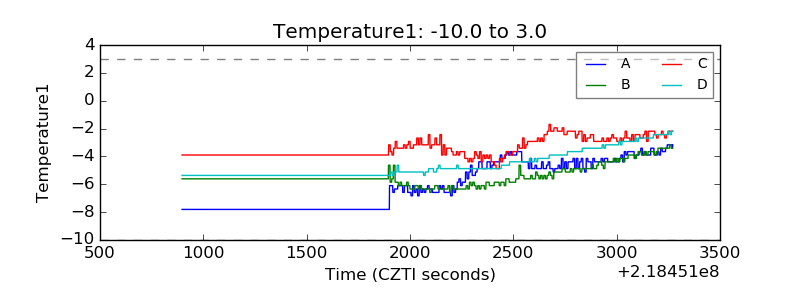 |
| Veto HV Monitor |  |
| Veto LLD | 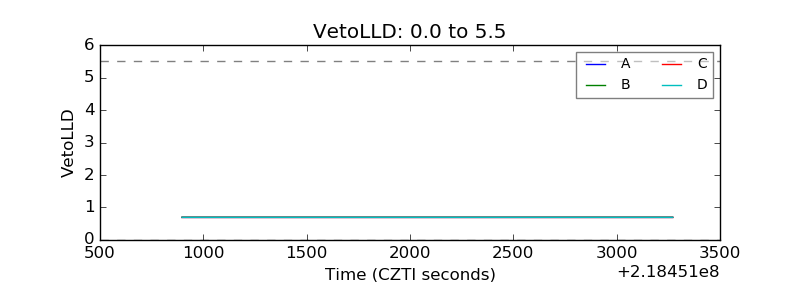 |
| Alpha Counter | 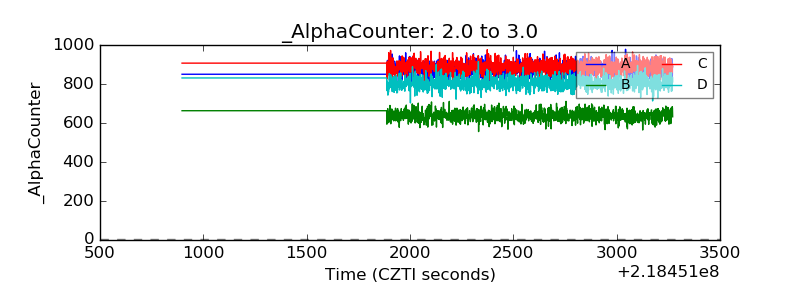 |
| _CPM_Rate | 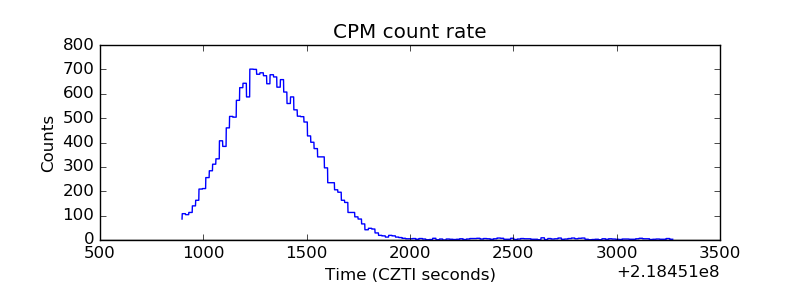 |
| CZT Counter | 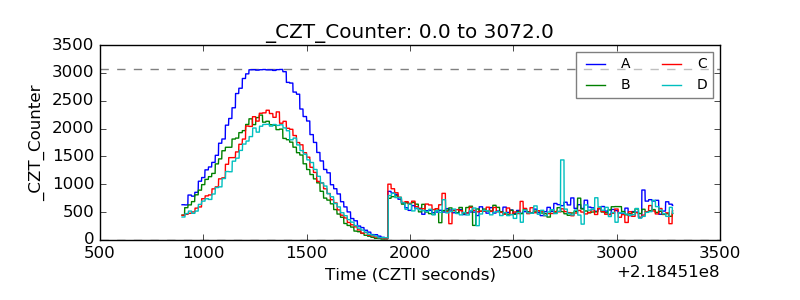 |
| +2.5 Volts monitor |  |
| +5 Volts monitor |  |
| _ROLL_ROT | 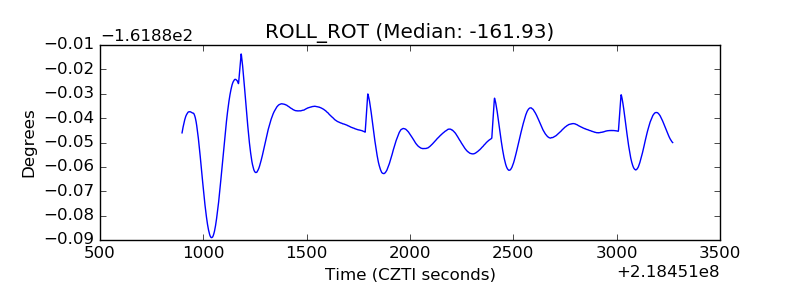 |
| _Roll_DEC | 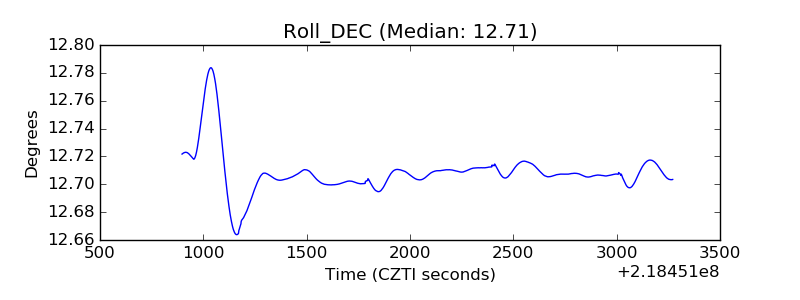 |
| _Roll_RA | 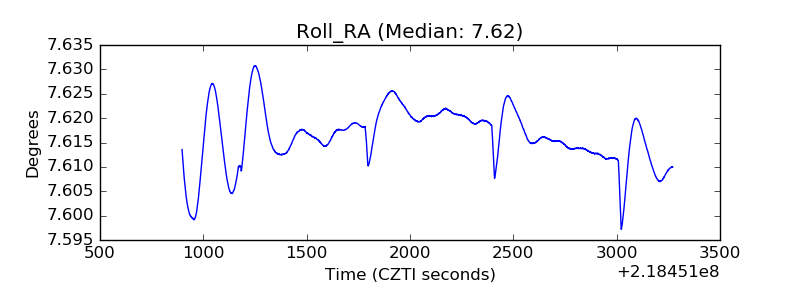 |
| Veto Counter | 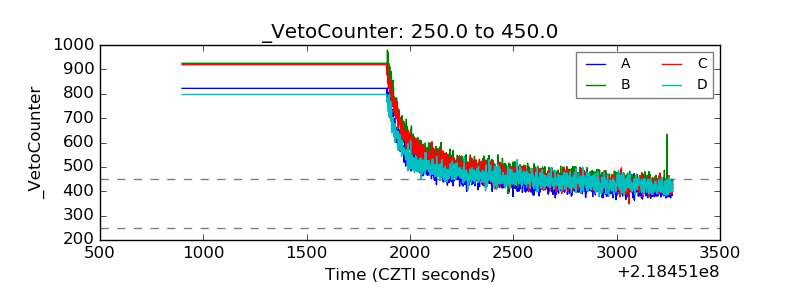 |