| Param | Original file | Final file |
|---|---|---|
| Filename | modeM0/AS1C02_011T01_9000000850_06400cztM0_level2.evt | modeM0/AS1C02_011T01_9000000850_06400cztM0_level2_quad_clean.evt |
| Size (bytes) | 497,039,040 | 92,030,400 |
| Size | 474.0 MB | 87.8 MB |
| Events in quadrant A | 4,356,415 | 567,106 |
| Events in quadrant B | 3,452,429 | 586,355 |
| Events in quadrant C | 3,204,411 | 587,727 |
| Events in quadrant D | 3,568,623 | 562,689 |
| Mode SS | |||
|---|---|---|---|
| Quadrant | BADHDUFLAG | Total packets | Discarded packets |
| A | 0 | 142 | 0 |
| B | 0 | 142 | 0 |
| C | 0 | 142 | 0 |
| D | 0 | 142 | 0 |
| Mode M0 | |||
|---|---|---|---|
| Quadrant | BADHDUFLAG | Total packets | Discarded packets |
| A | 0 | 17474 | 3 |
| B | 0 | 14672 | 2 |
| C | 0 | 14264 | 2 |
| D | 0 | 14990 | 2 |
| Mode M9 | |||
|---|---|---|---|
| Quadrant | BADHDUFLAG | Total packets | Discarded packets |
| A | 0 | 16 | 0 |
| B | 0 | 16 | 0 |
| C | 0 | 16 | 0 |
| D | 0 | 16 | 0 |
| Quadrant | Total seconds | Saturated seconds | Saturation percentage |
|---|---|---|---|
| A | 6930 | 265 | 3.823954% |
| B | 6930 | 113 | 1.630592% |
| C | 6930 | 33 | 0.476190% |
| D | 6930 | 77 | 1.111111% |
Noise dominated data is calculated using 1-second bins in cleaned event files. If a bin has >2000 counts, and if more than 50% of those come from <1% of pixels, then it is considered to be noise-dominated and hence unusable.
| Quadrant | # 1 sec bins | Bins with >0 counts | Bins with >2000 counts | High rate bins dominated by noise | Noise dominated (total time) | Noise dominated (detector-on time) | Marked lightcurve |
|---|---|---|---|---|---|---|---|
| A | 7645 | 6931 | 108 | 108 | 1.41% | 1.56% | 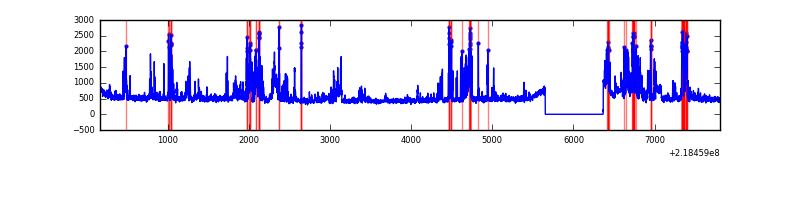 |
| B | 7645 | 6931 | 5 | 5 | 0.07% | 0.07% | 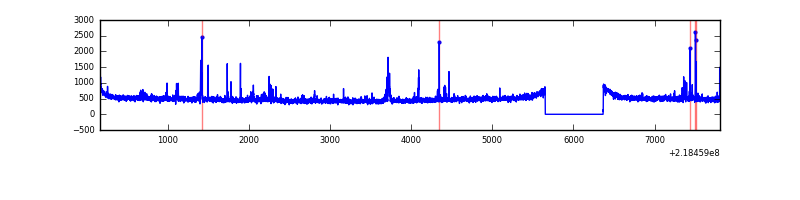 |
| C | 7645 | 6931 | 0 | 0 | 0.00% | 0.00% | 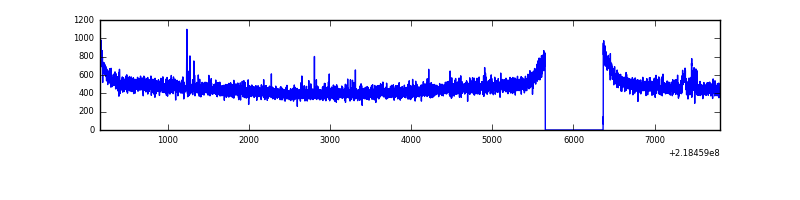 |
| D | 7645 | 6931 | 15 | 15 | 0.20% | 0.22% | 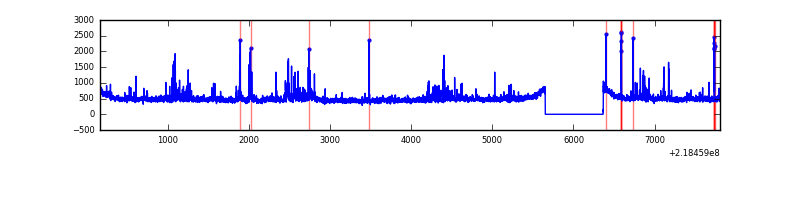 |
Top three noisy pixels from each quadrant. If the there are fewer than three noisy pixels in the level2.evt file, extra rows are filled as -1
| Pixel properties | Quadrant properties | ||||||
|---|---|---|---|---|---|---|---|
| Quadrant | DetID | PixID | Counts | Sigma | Mean | Median | Sigma |
| A | 13 | 251 | 905936 | 5327.64 | 831 | 814 | 169.9 |
| A | 15 | 236 | 178137 | 1043.74 | 831 | 814 | 169.9 |
| A | 8 | 15 | 50323 | 291.42 | 831 | 814 | 169.9 |
| B | 4 | 172 | 39637 | 238.44 | 844 | 823 | 162.8 |
| B | 10 | 246 | 29623 | 176.92 | 844 | 823 | 162.8 |
| B | 0 | 214 | 23504 | 139.33 | 844 | 823 | 162.8 |
| C | 8 | 208 | 19055 | 95.91 | 814 | 820 | 190.1 |
| C | 1 | 16 | 7304 | 34.1 | 814 | 820 | 190.1 |
| C | 13 | 61 | 6353 | 29.1 | 814 | 820 | 190.1 |
| D | 11 | 241 | 164052 | 810.1 | 819 | 796 | 201.5 |
| D | 2 | 152 | 105505 | 519.58 | 819 | 796 | 201.5 |
| D | 4 | 95 | 37735 | 183.3 | 819 | 796 | 201.5 |
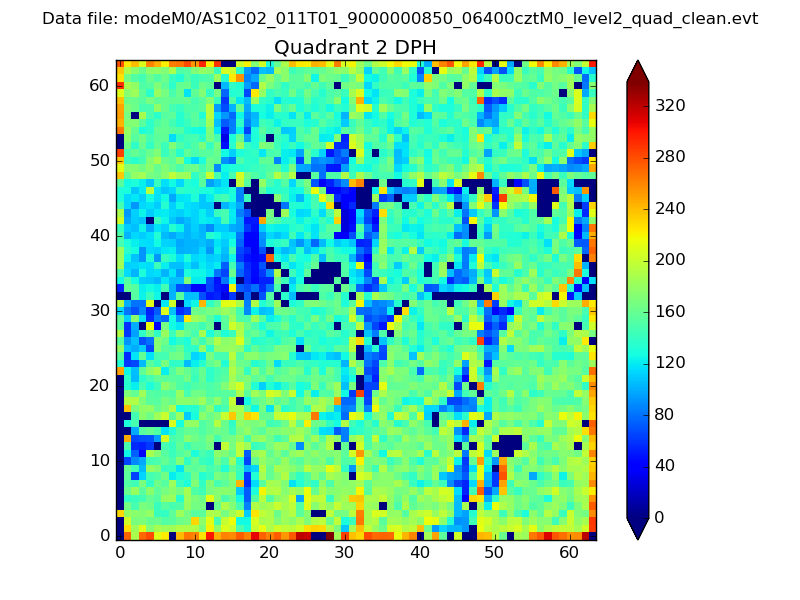
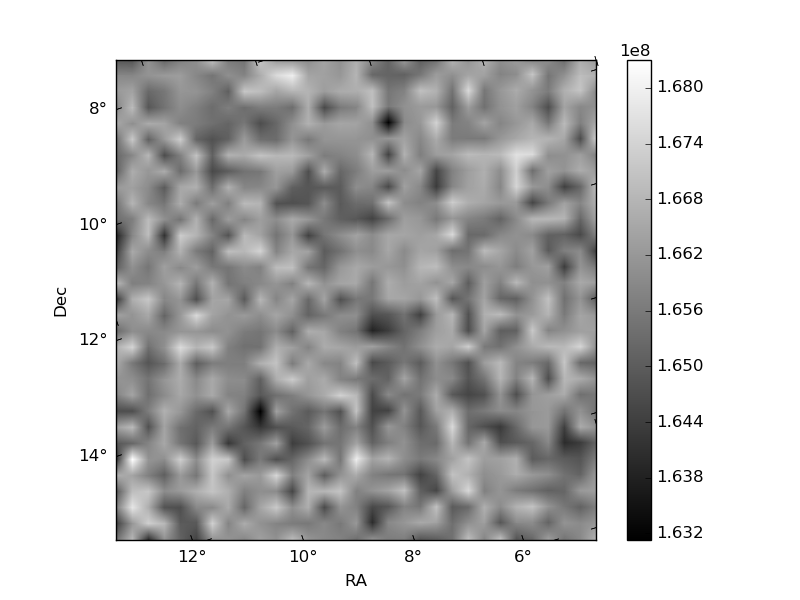
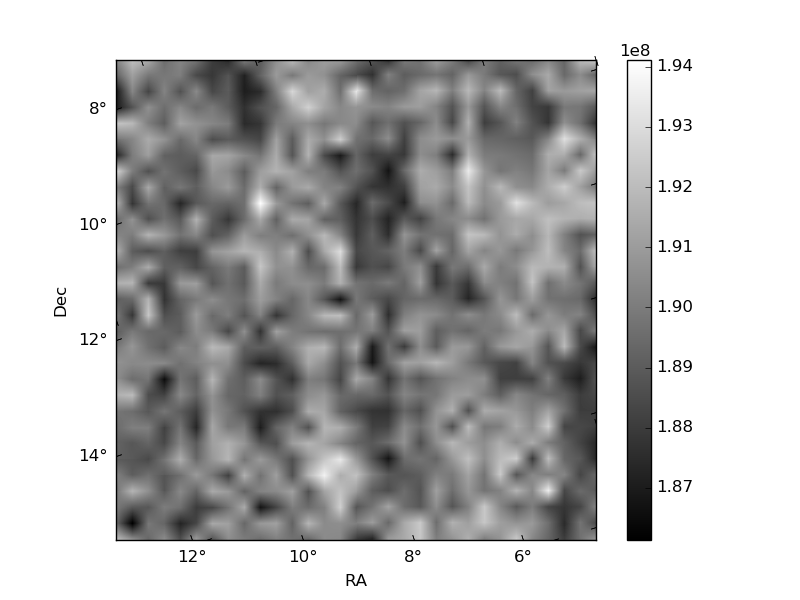
Histogram calculated using DETX and DETY for each event in the final _common_clean file
| Quadrant A | 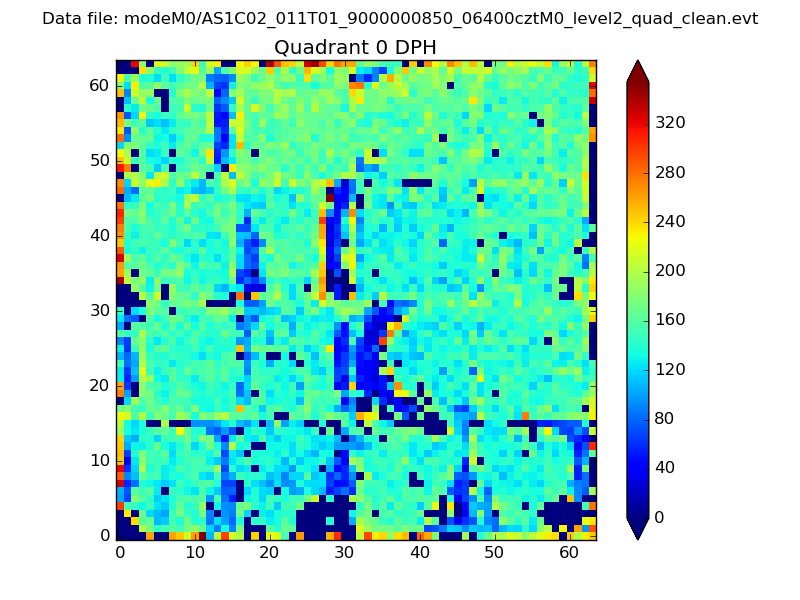 |
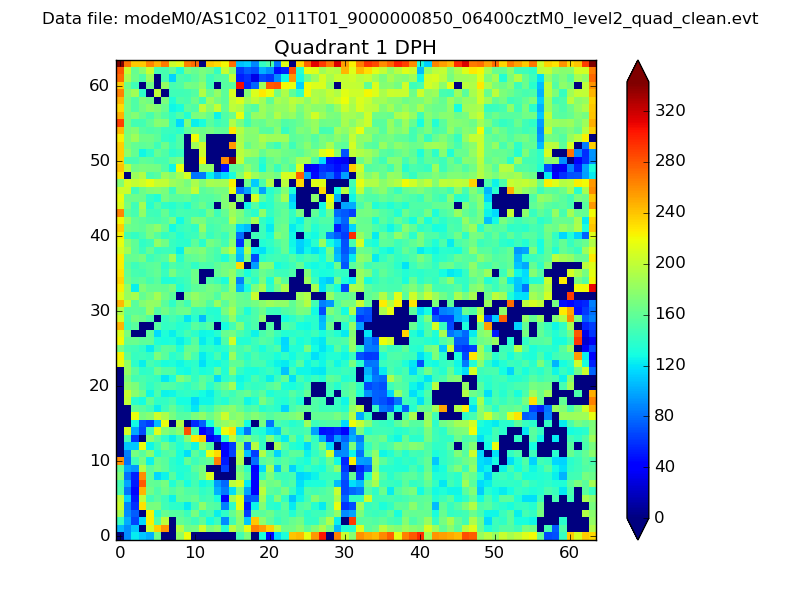 |
Quadrant B |
|---|---|---|---|
| Quadrant D | 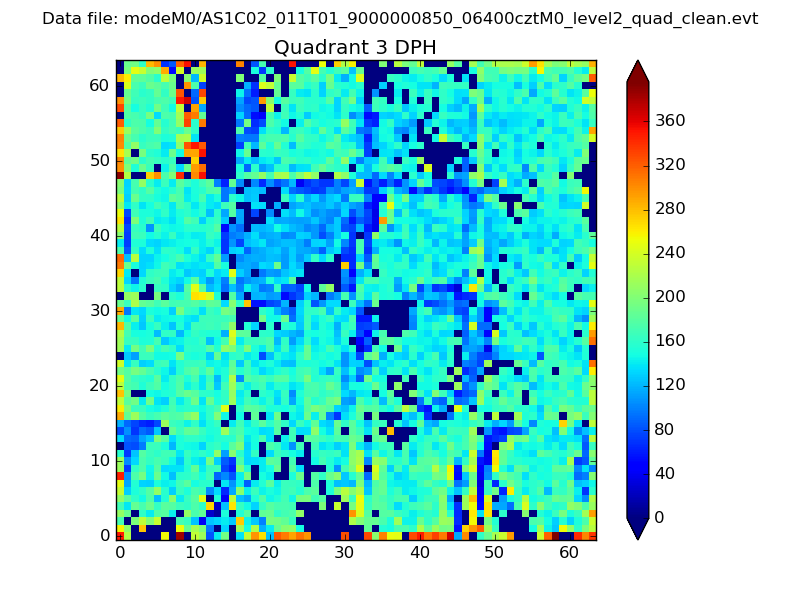 |
 |
Quadrant C |
| Plot type | Count rate plots | Images |
|---|---|---|
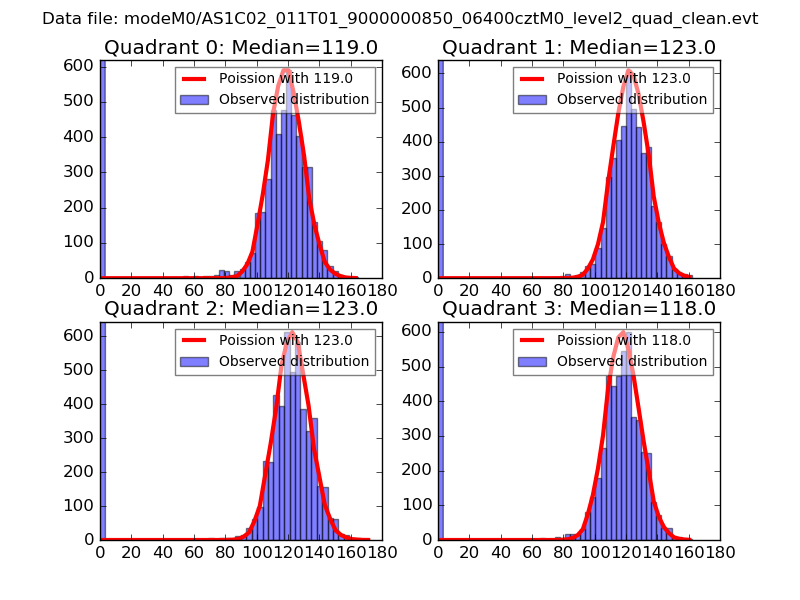
| Comparison with Poisson distribution Blue bars denote a histogram of data divided into 1 sec bins. Red curve is a Poisson curve with rate = median count rate of data. |
 |
 |
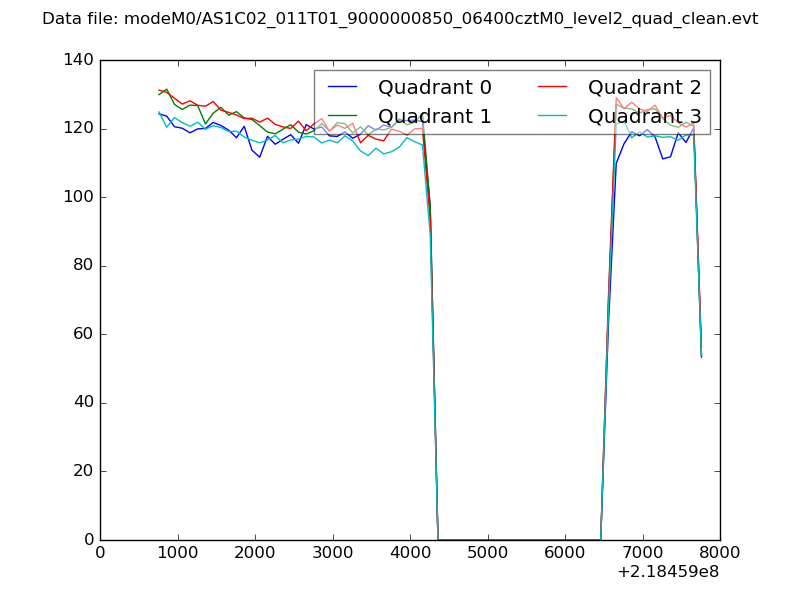
| Quadrant-wise count rates Data is divided into 100 sec bins |
 |
|
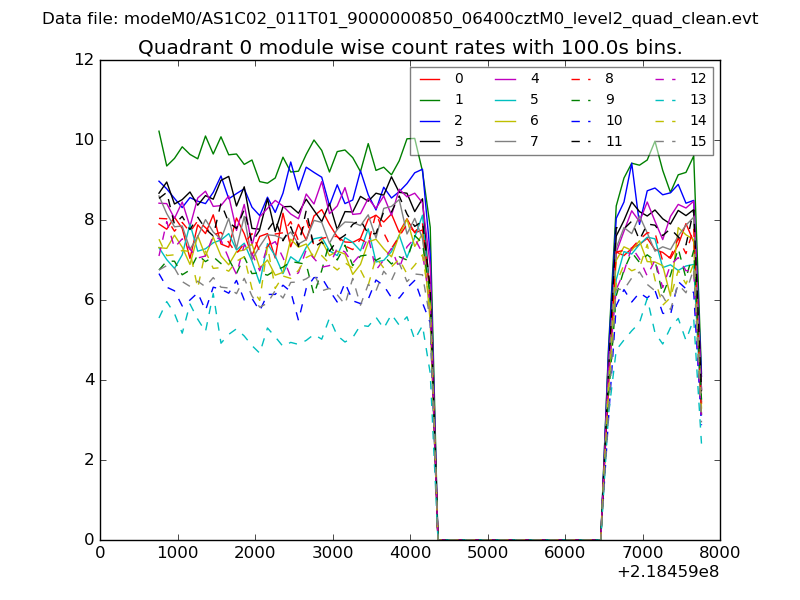
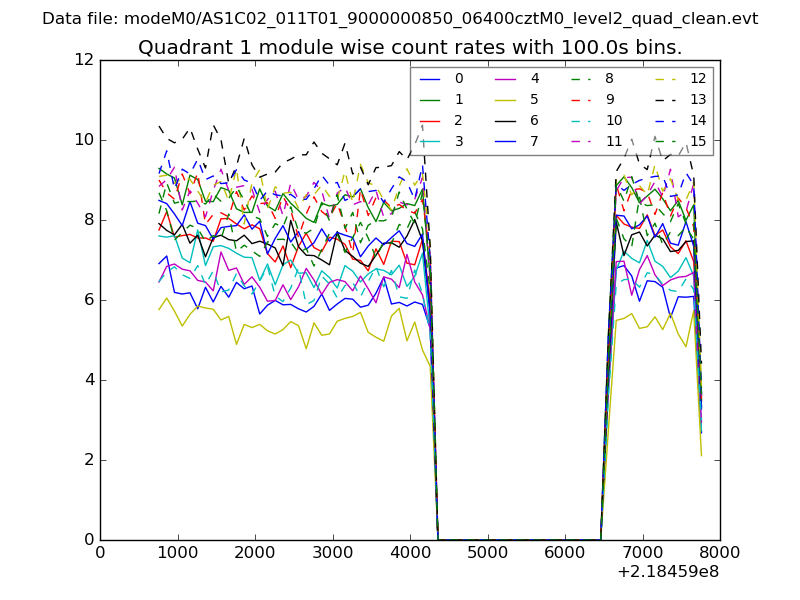
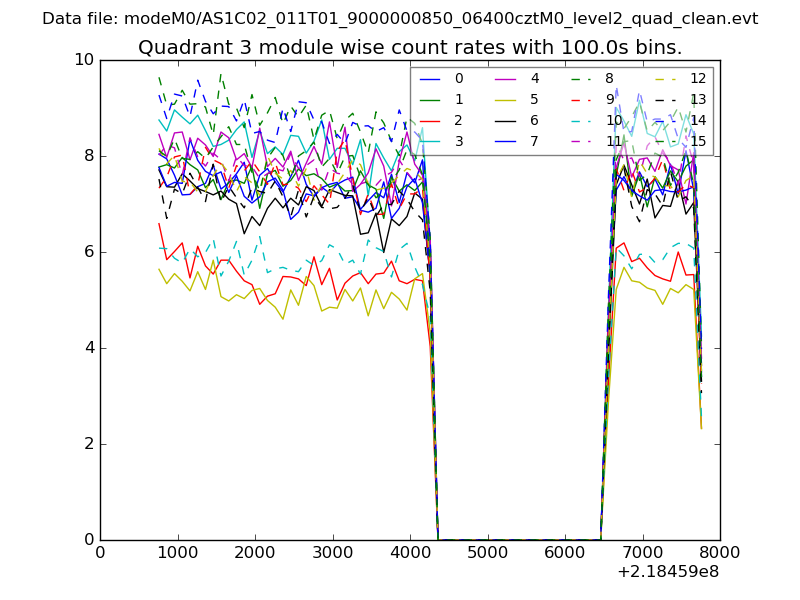
| Module-wise count rates for Quadrant A Data is divided into 100 sec bins |
 |
 |
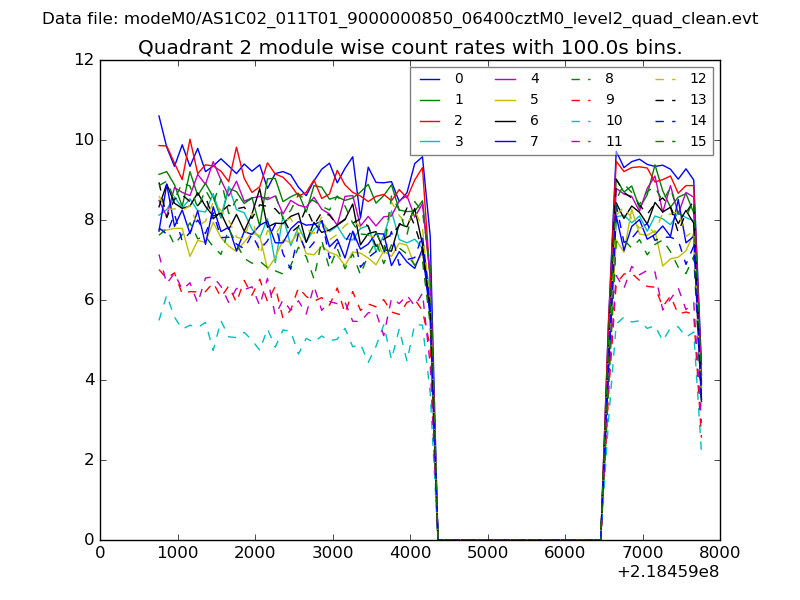
| Module-wise count rates for Quadrant B Data is divided into 100 sec bins |
 |
 |
| Module-wise count rates for Quadrant C Data is divided into 100 sec bins |
 |
 |
| Module-wise count rates for Quadrant D Data is divided into 100 sec bins |
 |
 |
| Parameter | Plot |
|---|---|
| CZT HV Monitor | 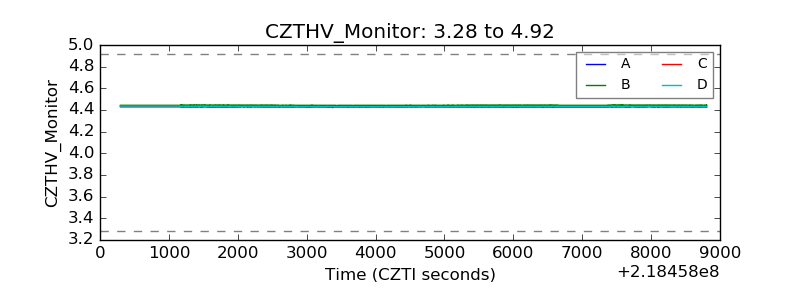 |
| D_VDD | 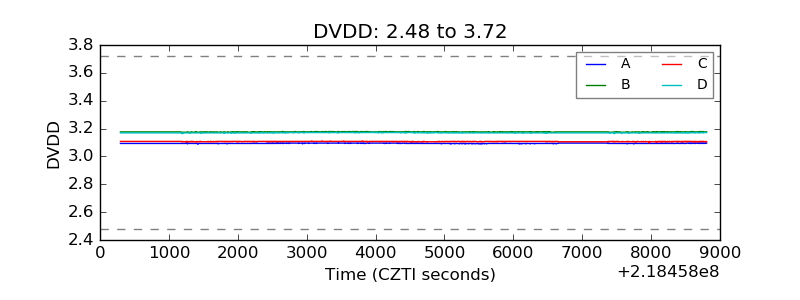 |
| Temperature 1 | 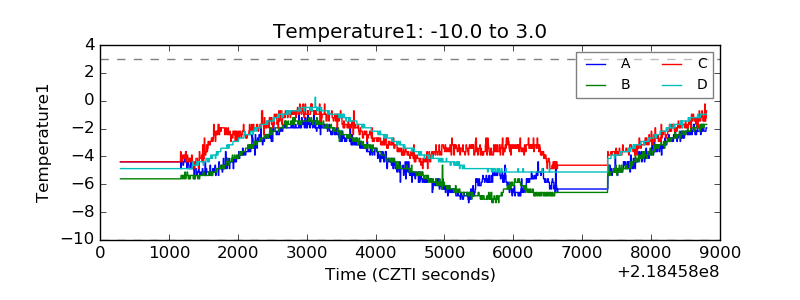 |
| Veto HV Monitor | 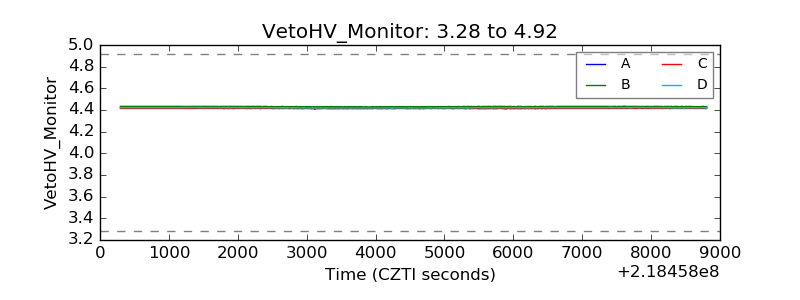 |
| Veto LLD | 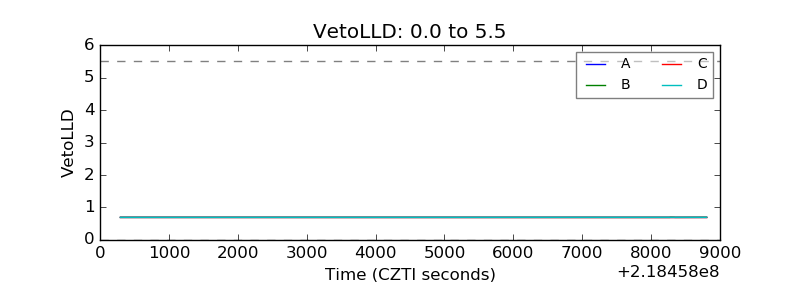 |
| Alpha Counter | 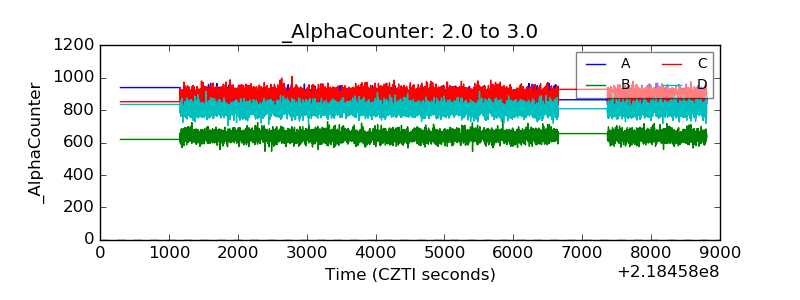 |
| _CPM_Rate | 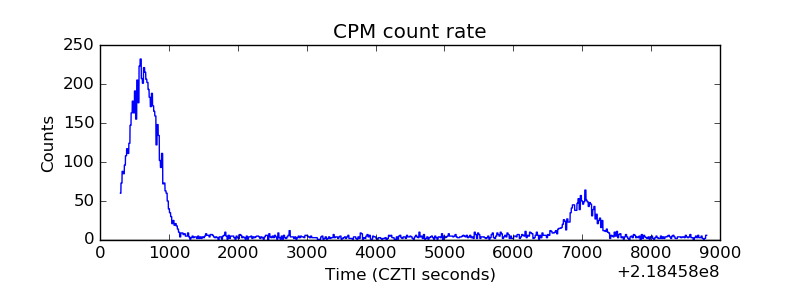 |
| CZT Counter | 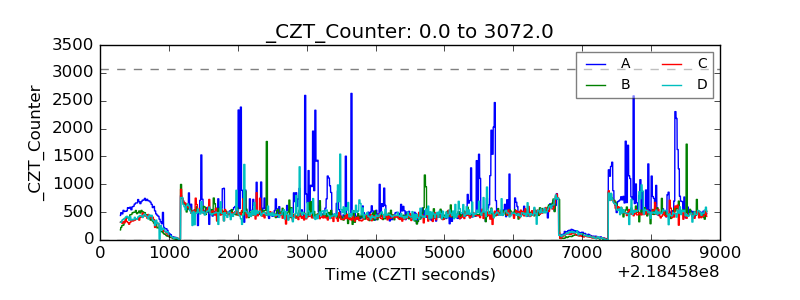 |
| +2.5 Volts monitor | 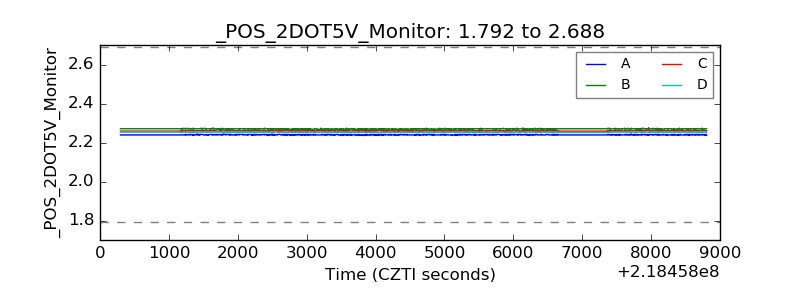 |
| +5 Volts monitor | 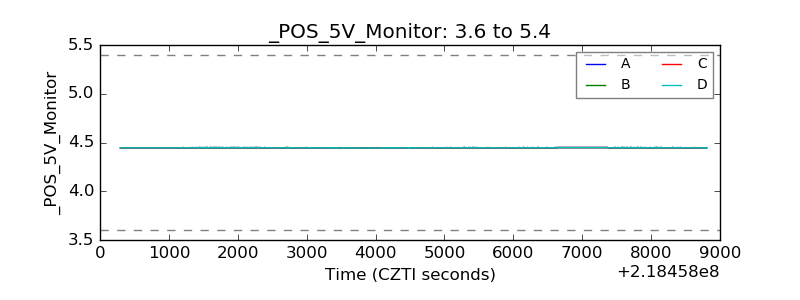 |
| _ROLL_ROT | 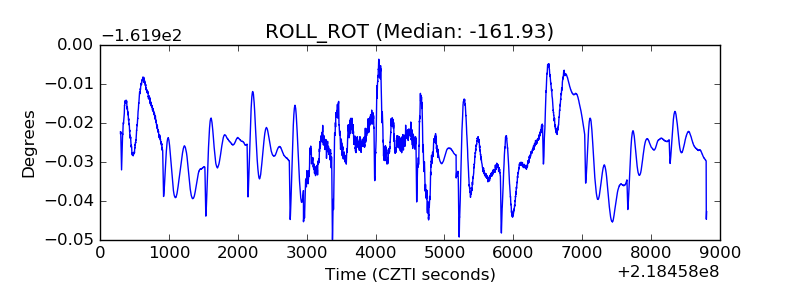 |
| _Roll_DEC | 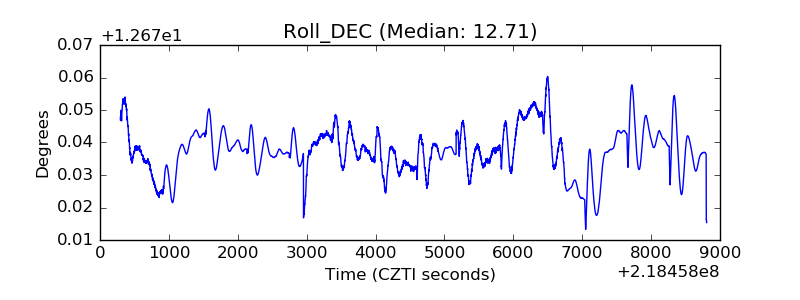 |
| _Roll_RA | 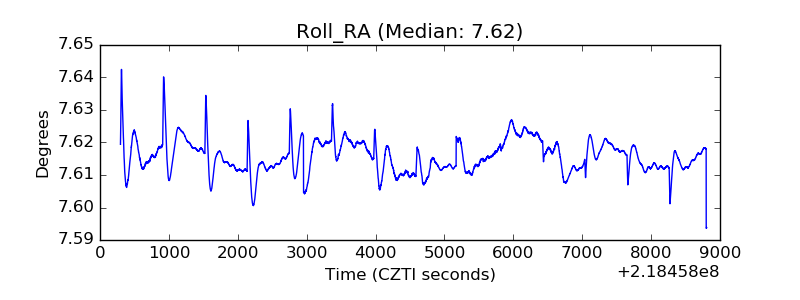 |
| Veto Counter | 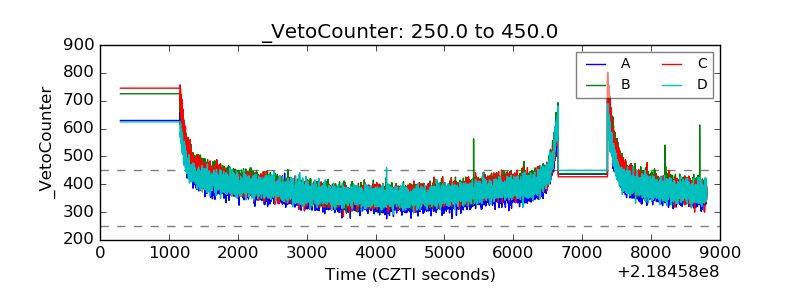 |