| Param | Original file | Final file |
|---|---|---|
| Filename | modeM0/AS1C02_011T01_9000000850_06401cztM0_level2.evt | modeM0/AS1C02_011T01_9000000850_06401cztM0_level2_quad_clean.evt |
| Size (bytes) | 681,811,200 | 97,505,280 |
| Size | 650.2 MB | 93.0 MB |
| Events in quadrant A | 4,676,959 | 617,335 |
| Events in quadrant B | 4,141,960 | 631,350 |
| Events in quadrant C | 3,620,455 | 639,913 |
| Events in quadrant D | 7,691,033 | 531,763 |
| Mode SS | |||
|---|---|---|---|
| Quadrant | BADHDUFLAG | Total packets | Discarded packets |
| A | 0 | 156 | 0 |
| B | 0 | 156 | 0 |
| C | 0 | 156 | 0 |
| D | 0 | 156 | 0 |
| Mode M0 | |||
|---|---|---|---|
| Quadrant | BADHDUFLAG | Total packets | Discarded packets |
| A | 0 | 18903 | 4 |
| B | 0 | 17264 | 3 |
| C | 0 | 16107 | 3 |
| D | 0 | 27870 | 3 |
| Quadrant | Total seconds | Saturated seconds | Saturation percentage |
|---|---|---|---|
| A | 7634 | 417 | 5.462405% |
| B | 7634 | 371 | 4.859838% |
| C | 7634 | 116 | 1.519518% |
| D | 7634 | 1872 | 24.521876% |
Noise dominated data is calculated using 1-second bins in cleaned event files. If a bin has >2000 counts, and if more than 50% of those come from <1% of pixels, then it is considered to be noise-dominated and hence unusable.
| Quadrant | # 1 sec bins | Bins with >0 counts | Bins with >2000 counts | High rate bins dominated by noise | Noise dominated (total time) | Noise dominated (detector-on time) | Marked lightcurve |
|---|---|---|---|---|---|---|---|
| A | 7754 | 7636 | 132 | 132 | 1.70% | 1.73% | 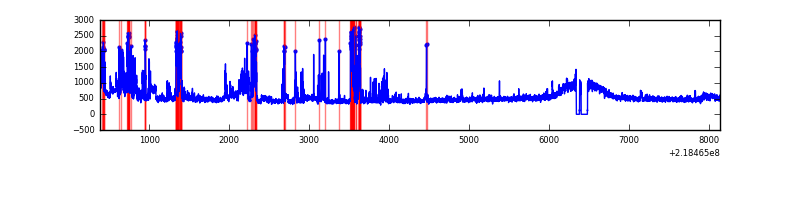 |
| B | 7754 | 7636 | 84 | 84 | 1.08% | 1.10% | 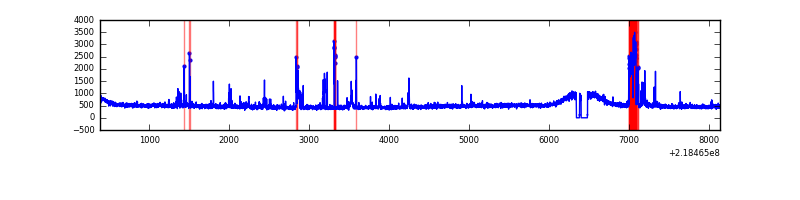 |
| C | 7754 | 7636 | 0 | 0 | 0.00% | 0.00% | 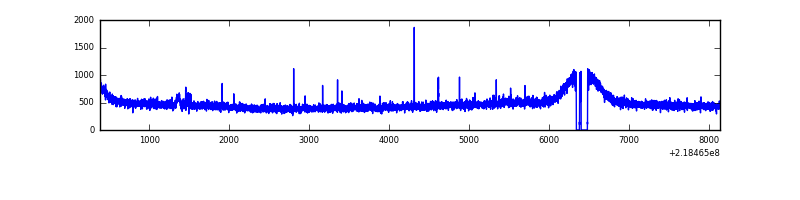 |
| D | 7754 | 7636 | 1433 | 1433 | 18.48% | 18.77% | 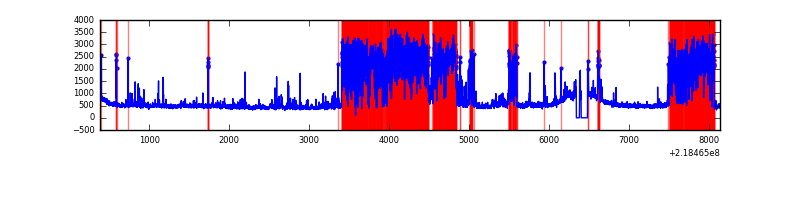 |
Top three noisy pixels from each quadrant. If the there are fewer than three noisy pixels in the level2.evt file, extra rows are filled as -1
| Pixel properties | Quadrant properties | ||||||
|---|---|---|---|---|---|---|---|
| Quadrant | DetID | PixID | Counts | Sigma | Mean | Median | Sigma |
| A | 13 | 251 | 806773 | 4116.08 | 942 | 920 | 195.8 |
| A | 15 | 236 | 157616 | 800.36 | 942 | 920 | 195.8 |
| A | 8 | 15 | 76773 | 387.44 | 942 | 920 | 195.8 |
| B | 4 | 81 | 283643 | 1524.02 | 948 | 924 | 185.5 |
| B | 0 | 214 | 50135 | 265.28 | 948 | 924 | 185.5 |
| B | 4 | 170 | 32696 | 171.27 | 948 | 924 | 185.5 |
| C | 8 | 208 | 15565 | 67.53 | 920 | 925 | 216.8 |
| C | 9 | 54 | 7960 | 32.45 | 920 | 925 | 216.8 |
| C | 13 | 61 | 7133 | 28.64 | 920 | 925 | 216.8 |
| D | 4 | 95 | 4288418 | 20992.77 | 819 | 792 | 204.2 |
| D | 2 | 152 | 121279 | 589.92 | 819 | 792 | 204.2 |
| D | 11 | 241 | 116875 | 568.36 | 819 | 792 | 204.2 |
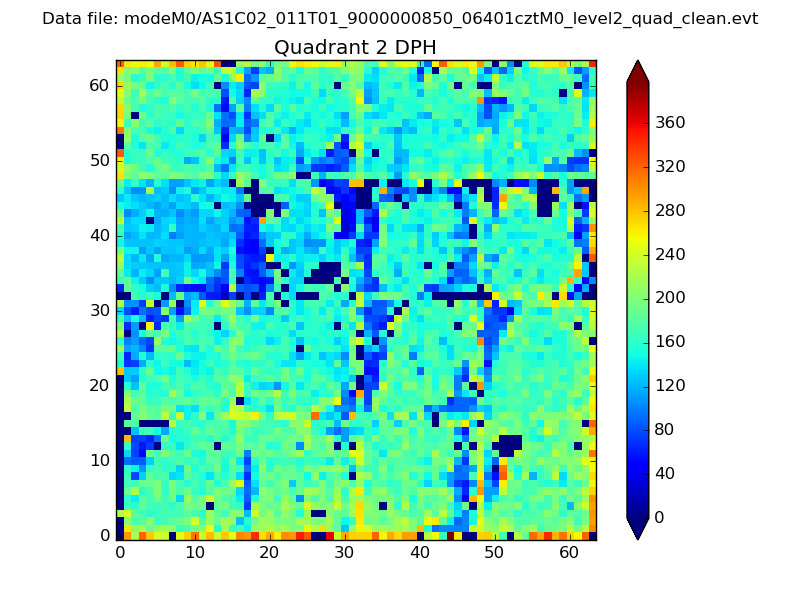
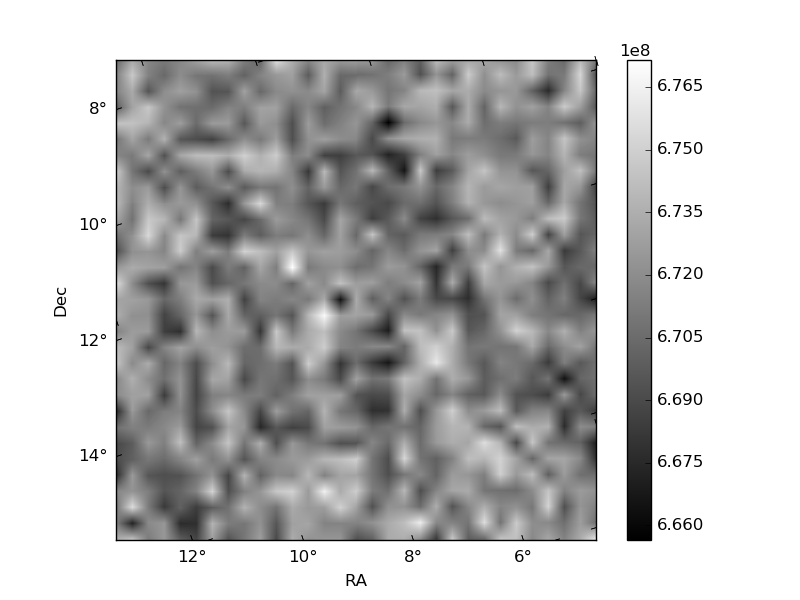
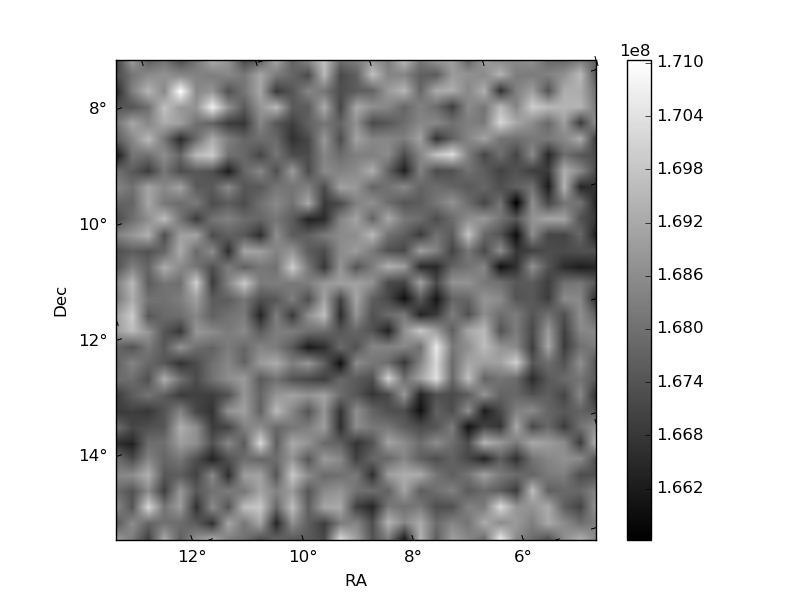
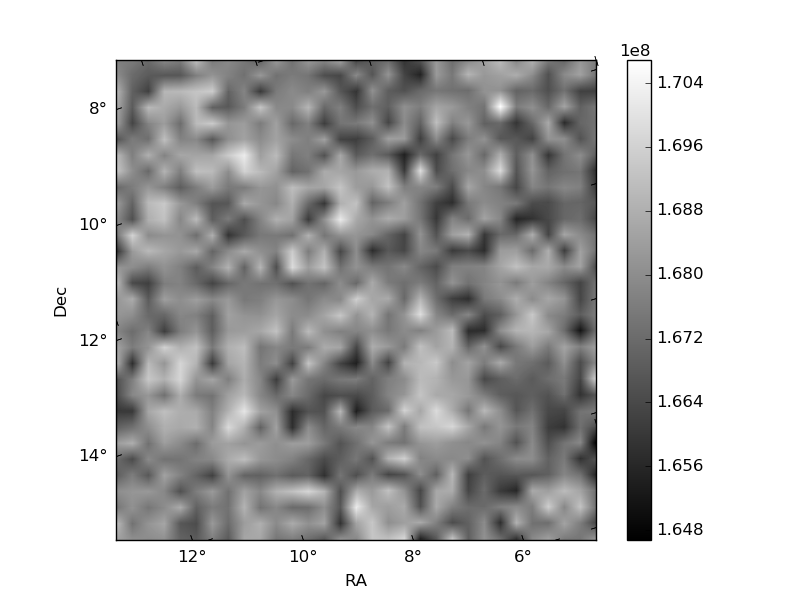
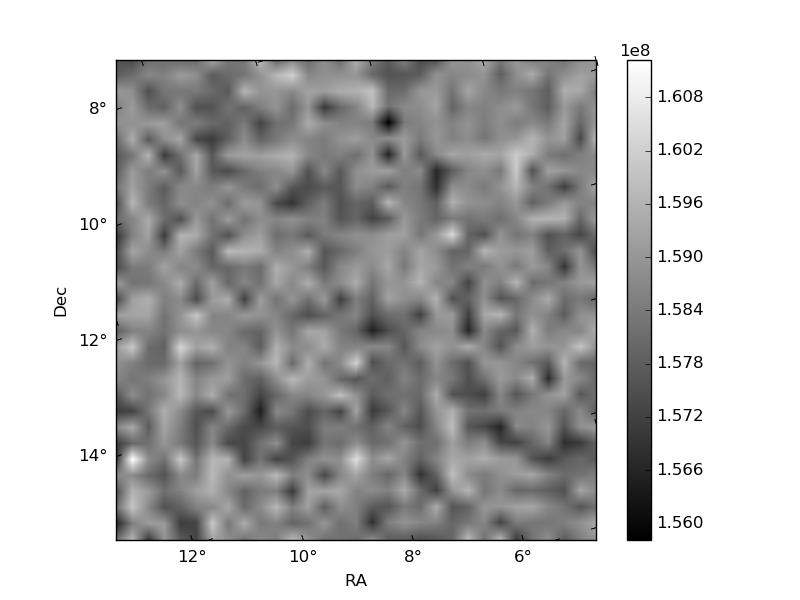
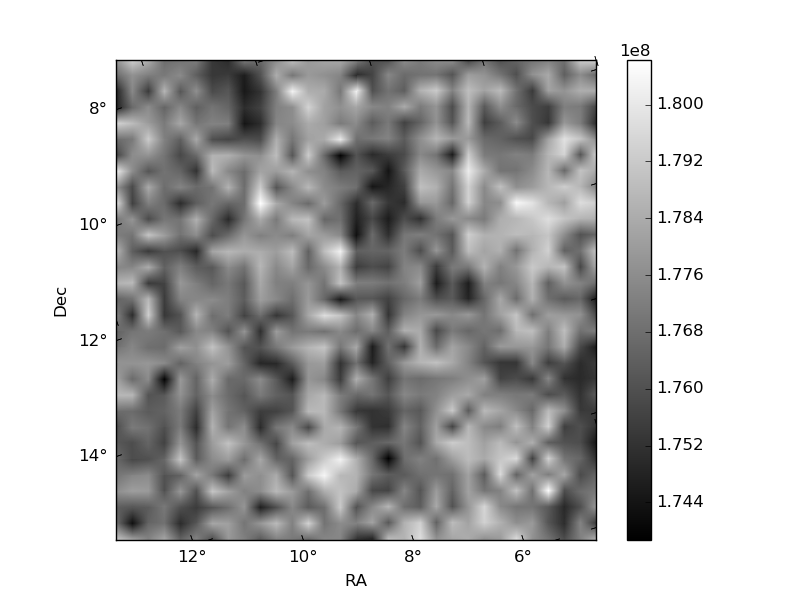
Histogram calculated using DETX and DETY for each event in the final _common_clean file
| Quadrant A | 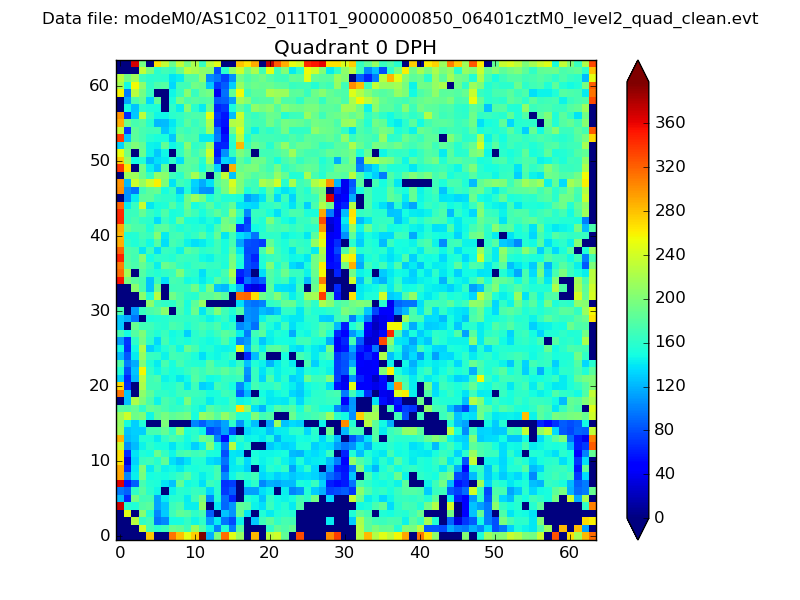 |
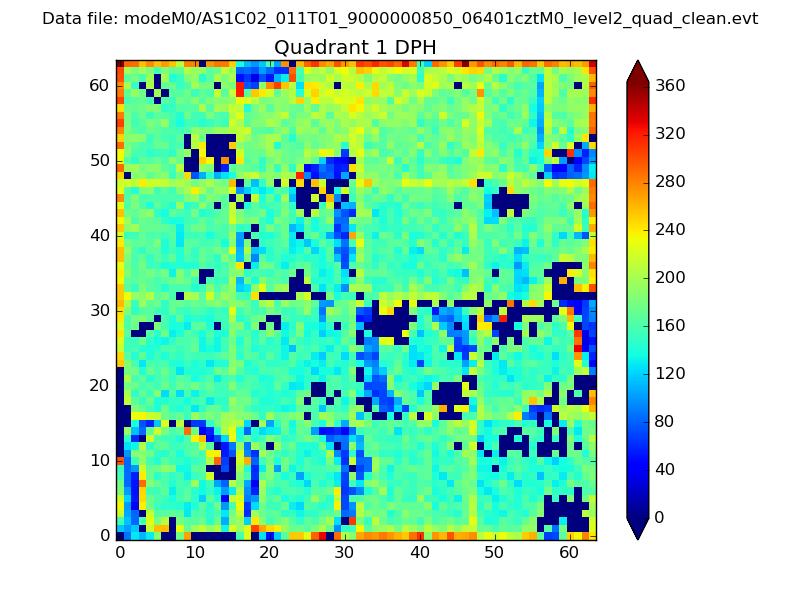 |
Quadrant B |
|---|---|---|---|
| Quadrant D | 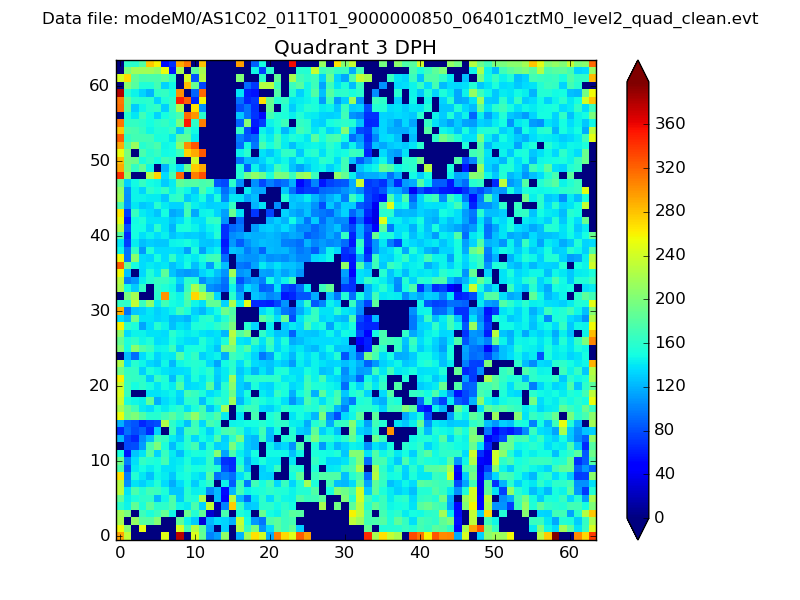 |
 |
Quadrant C |
| Plot type | Count rate plots | Images |
|---|---|---|
| Comparison with Poisson distribution Blue bars denote a histogram of data divided into 1 sec bins. Red curve is a Poisson curve with rate = median count rate of data. |
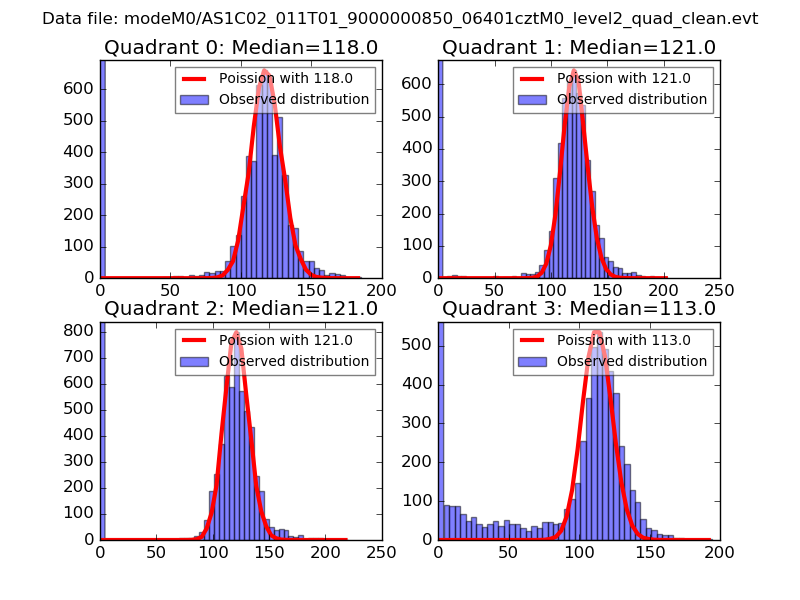 |
 |
| Quadrant-wise count rates Data is divided into 100 sec bins |
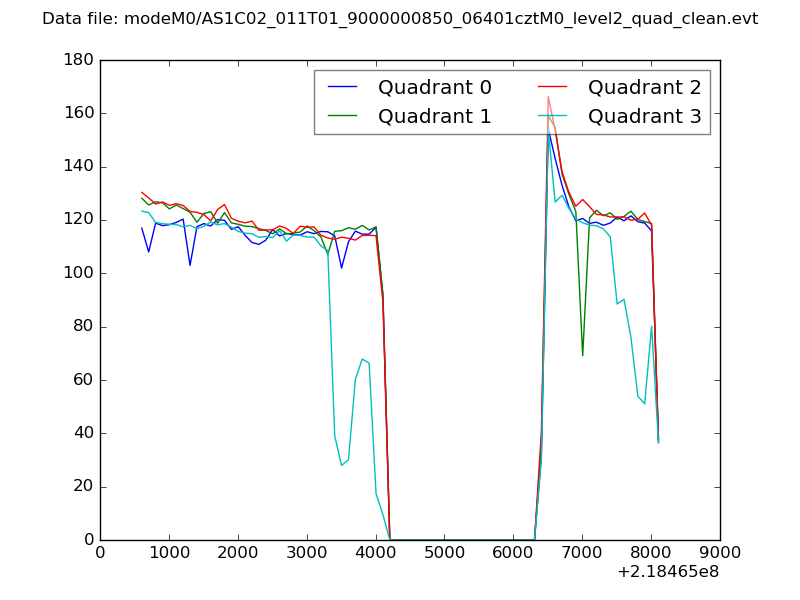 |
|
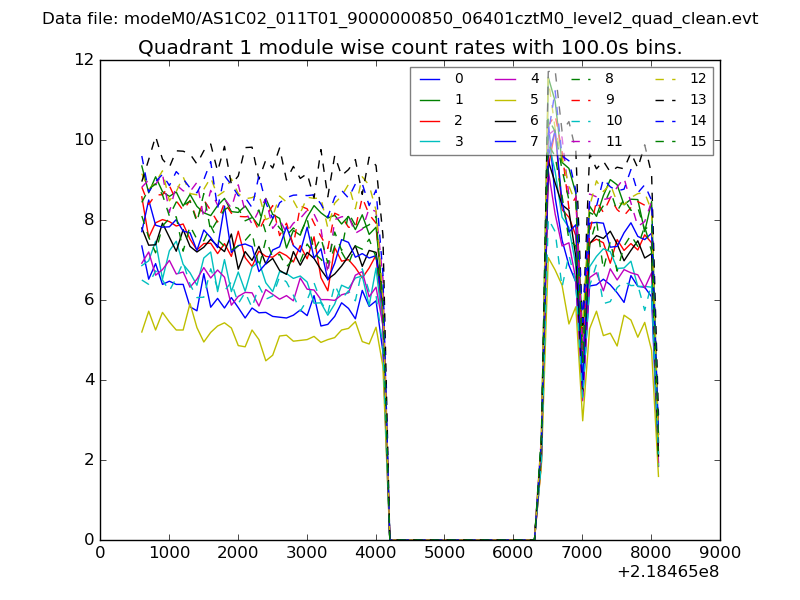
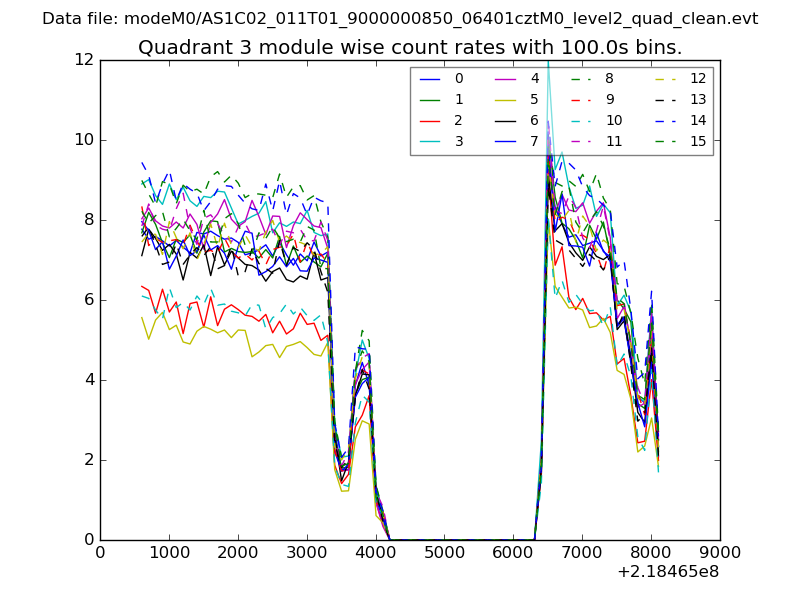
| Module-wise count rates for Quadrant A Data is divided into 100 sec bins |
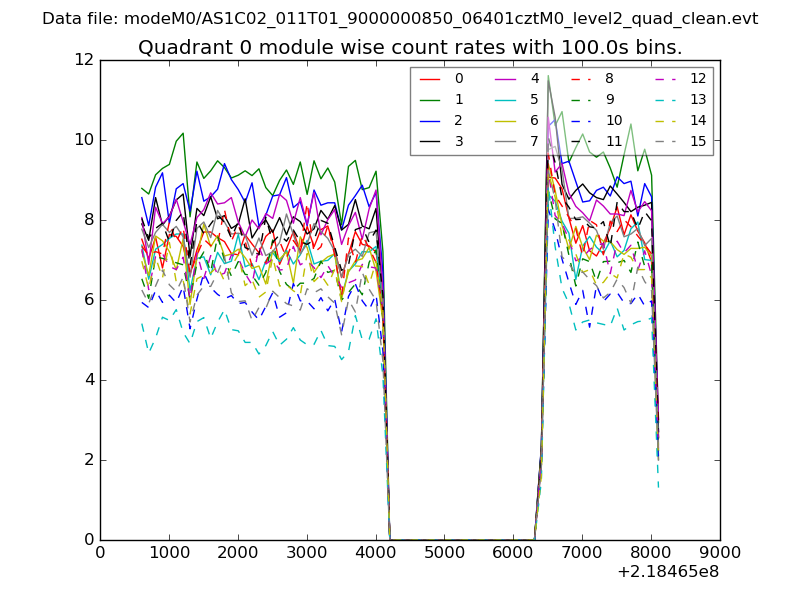 |
 |
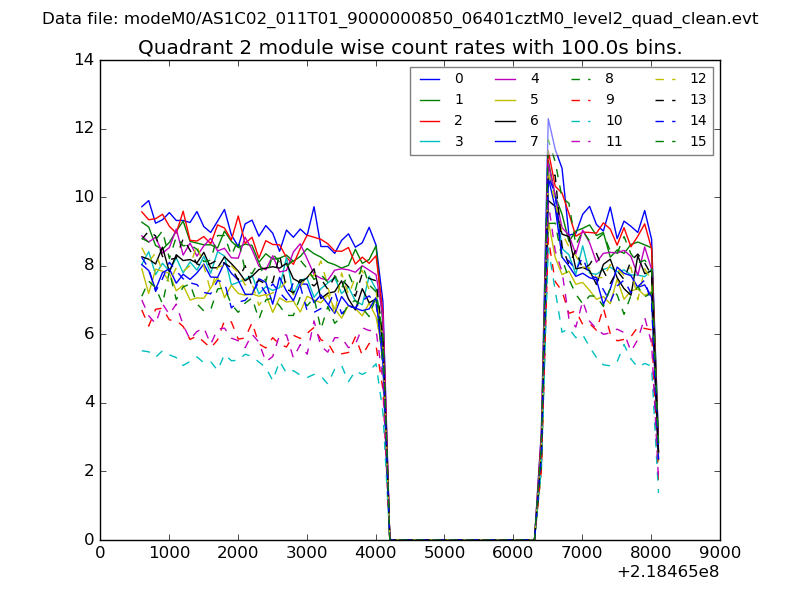
| Module-wise count rates for Quadrant B Data is divided into 100 sec bins |
 |
 |
| Module-wise count rates for Quadrant C Data is divided into 100 sec bins |
 |
 |
| Module-wise count rates for Quadrant D Data is divided into 100 sec bins |
 |
 |
| Parameter | Plot |
|---|---|
| CZT HV Monitor | 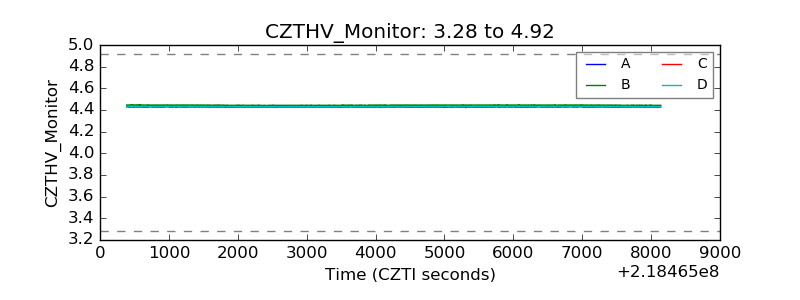 |
| D_VDD | 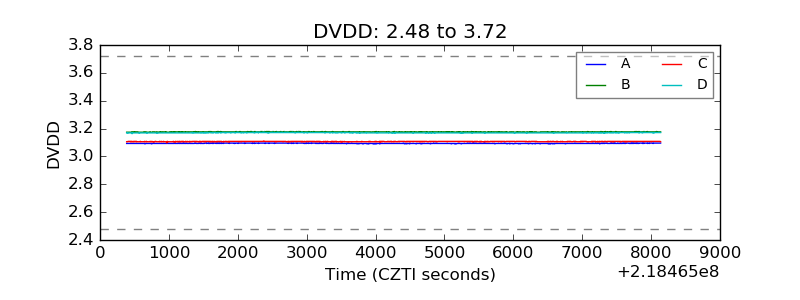 |
| Temperature 1 | 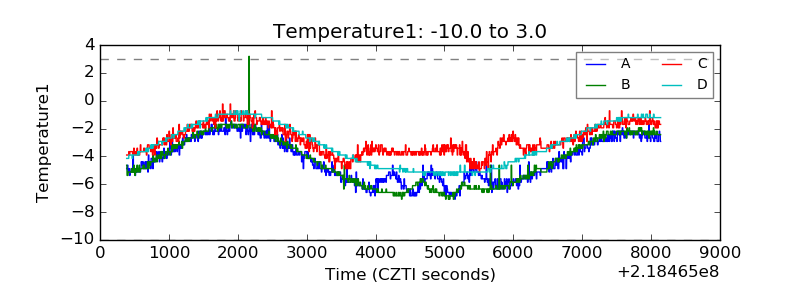 |
| Veto HV Monitor | 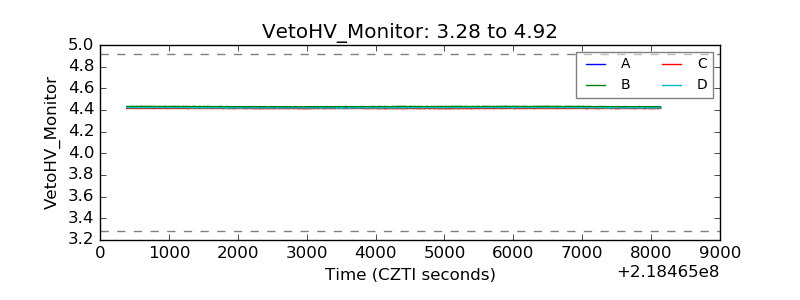 |
| Veto LLD | 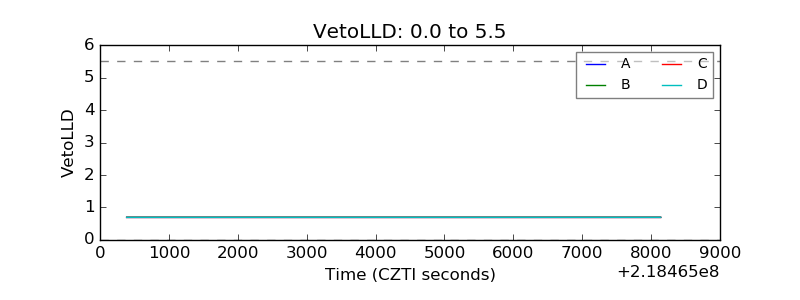 |
| Alpha Counter | 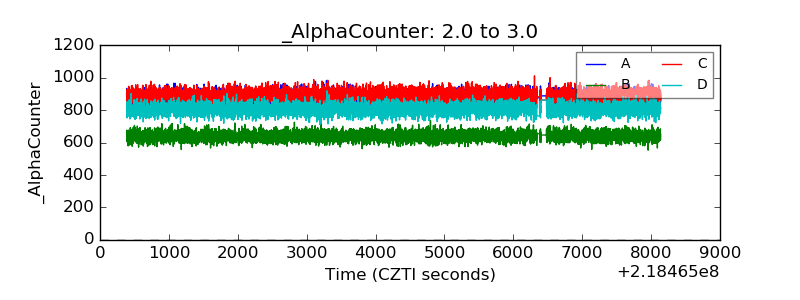 |
| _CPM_Rate | 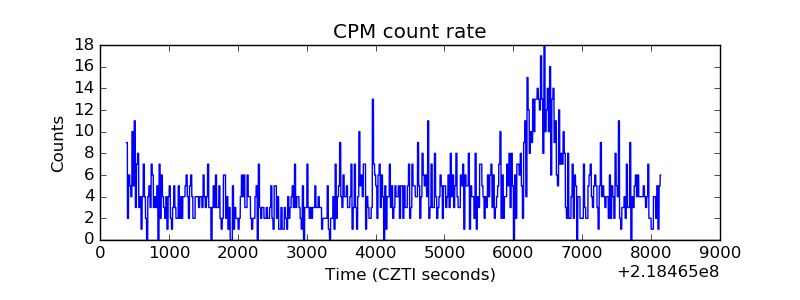 |
| CZT Counter | 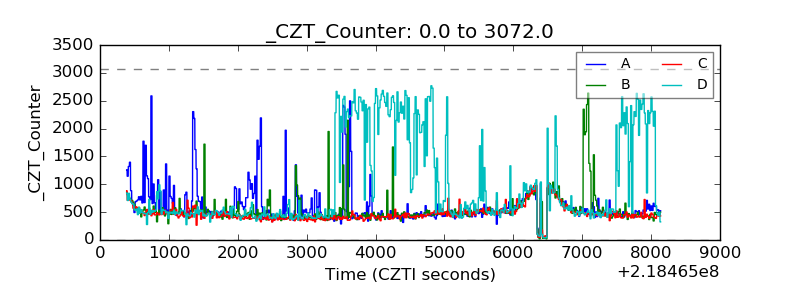 |
| +2.5 Volts monitor |  |
| +5 Volts monitor |  |
| _ROLL_ROT | 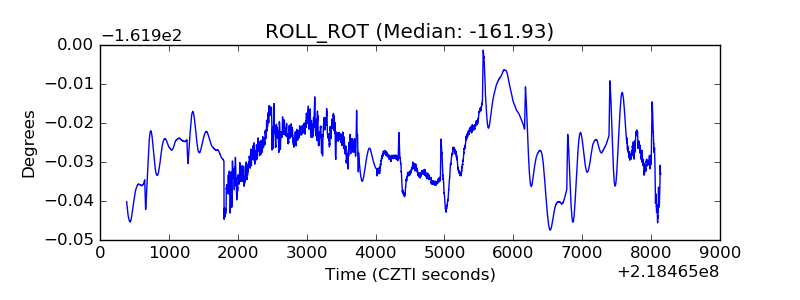 |
| _Roll_DEC | 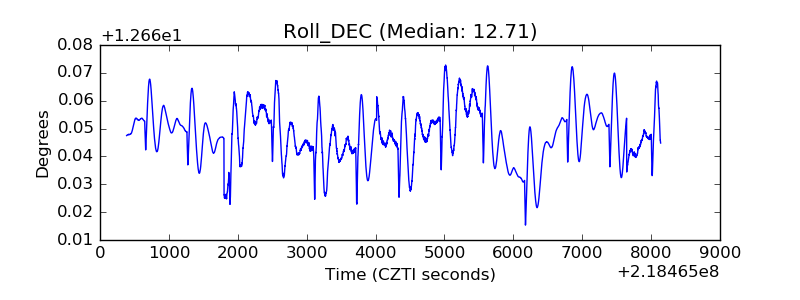 |
| _Roll_RA | 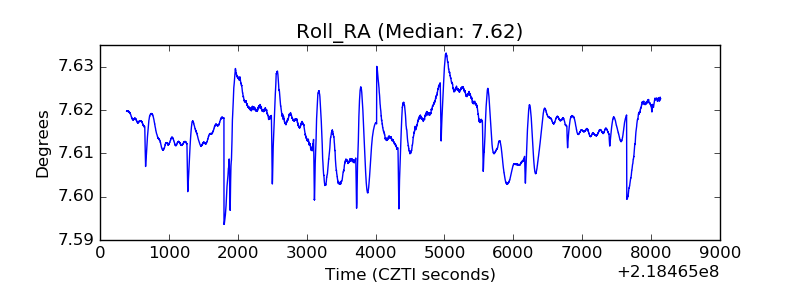 |
| Veto Counter | 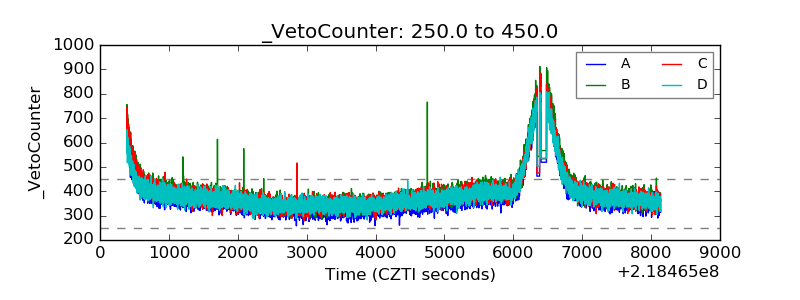 |