| Param | Original file | Final file |
|---|---|---|
| Filename | modeM0/AS1C02_011T01_9000000850_06402cztM0_level2.evt | modeM0/AS1C02_011T01_9000000850_06402cztM0_level2_quad_clean.evt |
| Size (bytes) | 1,870,372,800 | 314,182,080 |
| Size | 1.7 GB | 299.6 MB |
| Events in quadrant A | 14,246,356 | 1,962,906 |
| Events in quadrant B | 12,669,462 | 2,003,853 |
| Events in quadrant C | 11,526,704 | 2,009,204 |
| Events in quadrant D | 16,541,793 | 1,848,242 |
| Mode SS | |||
|---|---|---|---|
| Quadrant | BADHDUFLAG | Total packets | Discarded packets |
| A | 0 | 500 | 0 |
| B | 0 | 500 | 0 |
| C | 0 | 500 | 0 |
| D | 0 | 500 | 0 |
| Mode M0 | |||
|---|---|---|---|
| Quadrant | BADHDUFLAG | Total packets | Discarded packets |
| A | 0 | 58195 | 7 |
| B | 0 | 53649 | 6 |
| C | 0 | 51368 | 6 |
| D | 0 | 65146 | 6 |
| Mode M9 | |||
|---|---|---|---|
| Quadrant | BADHDUFLAG | Total packets | Discarded packets |
| A | 0 | 27 | 0 |
| B | 0 | 27 | 0 |
| C | 0 | 27 | 0 |
| D | 0 | 27 | 0 |
| Quadrant | Total seconds | Saturated seconds | Saturation percentage |
|---|---|---|---|
| A | 24566 | 912 | 3.712448% |
| B | 24566 | 830 | 3.378653% |
| C | 24566 | 300 | 1.221200% |
| D | 24566 | 2162 | 8.800782% |
Noise dominated data is calculated using 1-second bins in cleaned event files. If a bin has >2000 counts, and if more than 50% of those come from <1% of pixels, then it is considered to be noise-dominated and hence unusable.
| Quadrant | # 1 sec bins | Bins with >0 counts | Bins with >2000 counts | High rate bins dominated by noise | Noise dominated (total time) | Noise dominated (detector-on time) | Marked lightcurve |
|---|---|---|---|---|---|---|---|
| A | 26471 | 24571 | 245 | 245 | 0.93% | 1.00% | 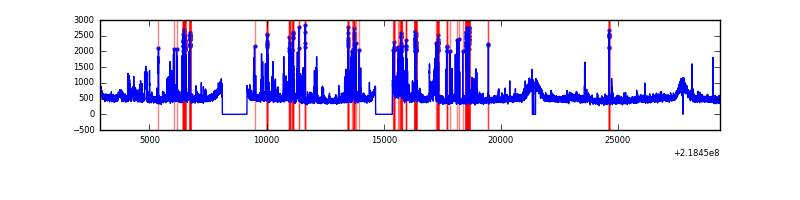 |
| B | 26471 | 24571 | 102 | 102 | 0.39% | 0.42% | 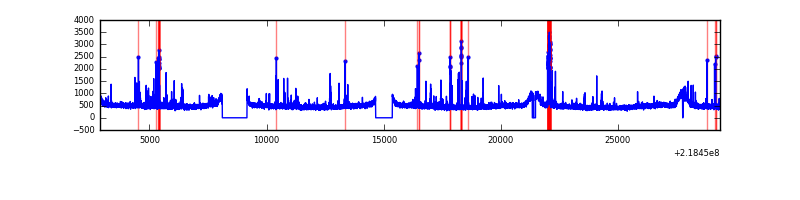 |
| C | 26471 | 24571 | 0 | 0 | 0.00% | 0.00% | 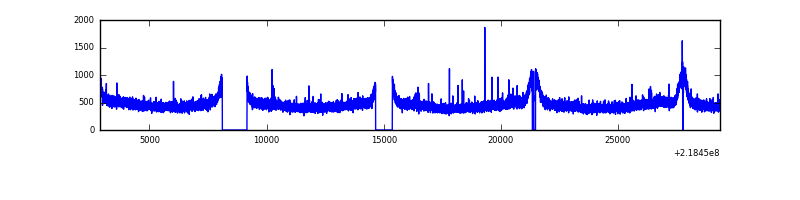 |
| D | 26471 | 24571 | 1484 | 1484 | 5.61% | 6.04% | 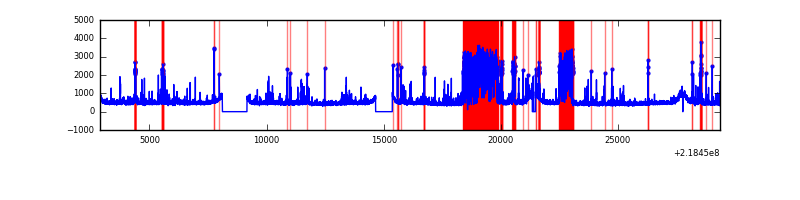 |
Top three noisy pixels from each quadrant. If the there are fewer than three noisy pixels in the level2.evt file, extra rows are filled as -1
| Pixel properties | Quadrant properties | ||||||
|---|---|---|---|---|---|---|---|
| Quadrant | DetID | PixID | Counts | Sigma | Mean | Median | Sigma |
| A | 13 | 251 | 1769170 | 2899.26 | 2999 | 2931 | 609.2 |
| A | 15 | 236 | 483437 | 788.74 | 2999 | 2931 | 609.2 |
| A | 8 | 15 | 347699 | 565.93 | 2999 | 2931 | 609.2 |
| B | 4 | 81 | 450303 | 766.17 | 3029 | 2958 | 583.9 |
| B | 10 | 246 | 120306 | 200.98 | 3029 | 2958 | 583.9 |
| B | 0 | 214 | 94838 | 157.36 | 3029 | 2958 | 583.9 |
| C | 8 | 208 | 37977 | 51.51 | 2929 | 2950 | 680.0 |
| C | 1 | 16 | 28290 | 37.26 | 2929 | 2950 | 680.0 |
| C | 13 | 61 | 23229 | 29.82 | 2929 | 2950 | 680.0 |
| D | 4 | 95 | 4317472 | 6203.01 | 2839 | 2754 | 695.6 |
| D | 2 | 152 | 507284 | 725.33 | 2839 | 2754 | 695.6 |
| D | 11 | 241 | 479490 | 685.37 | 2839 | 2754 | 695.6 |
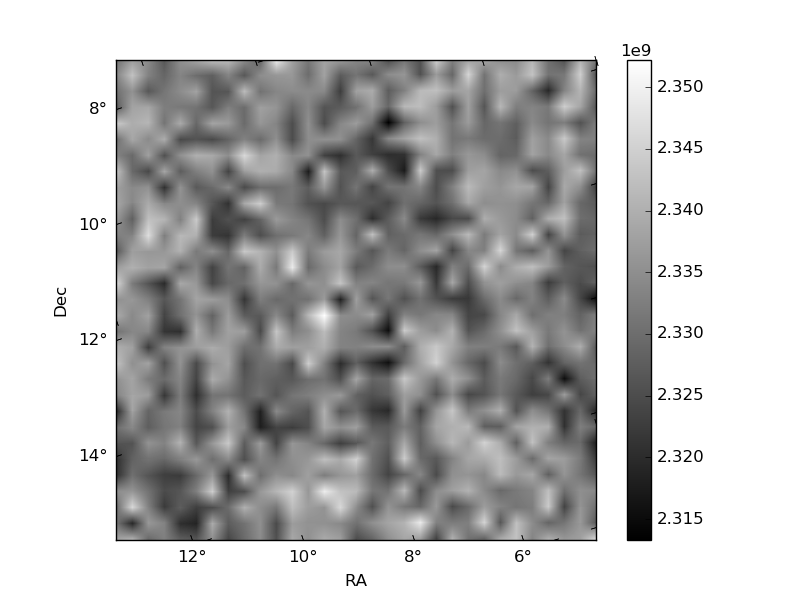
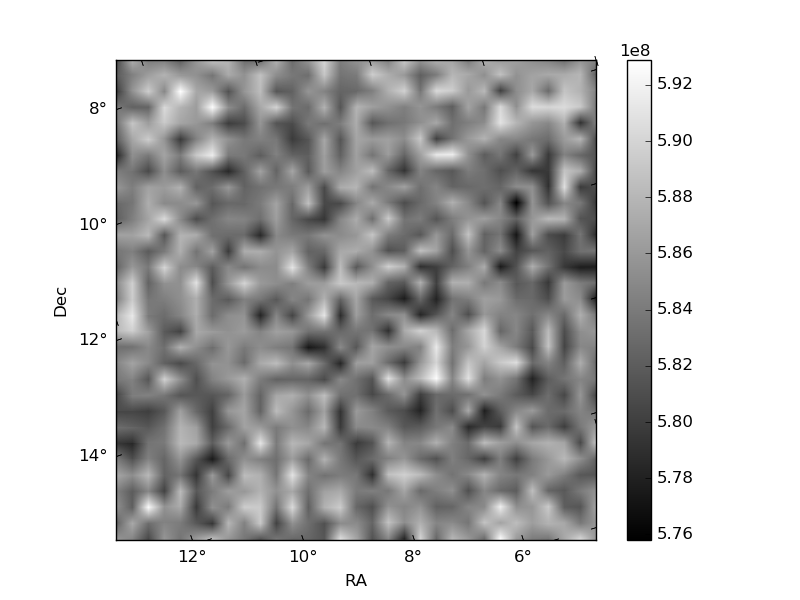
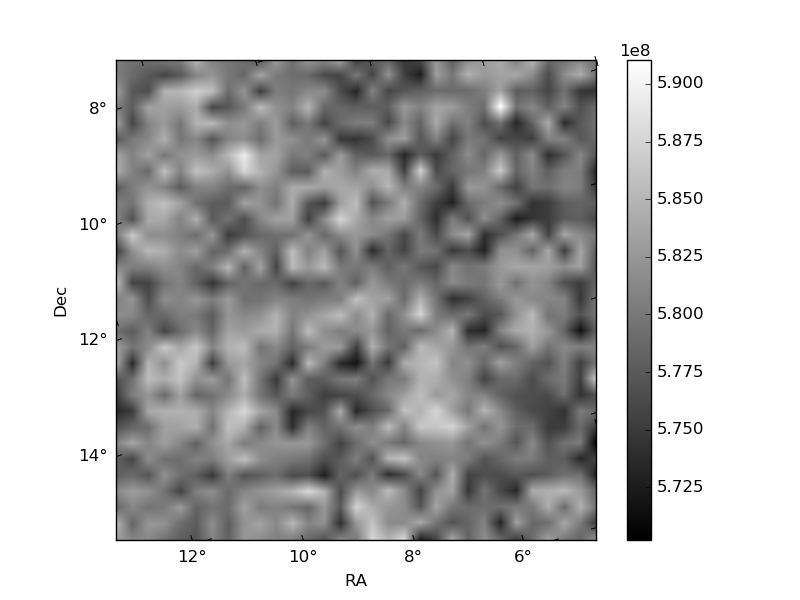
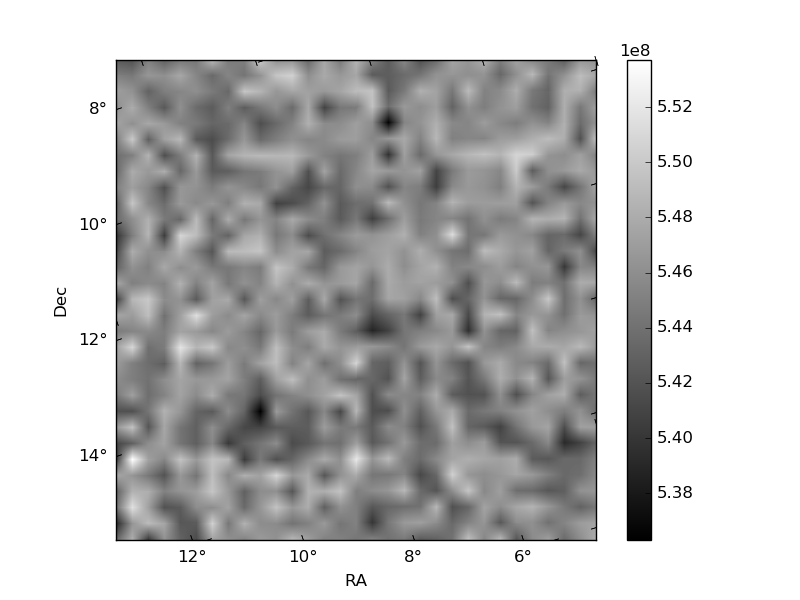
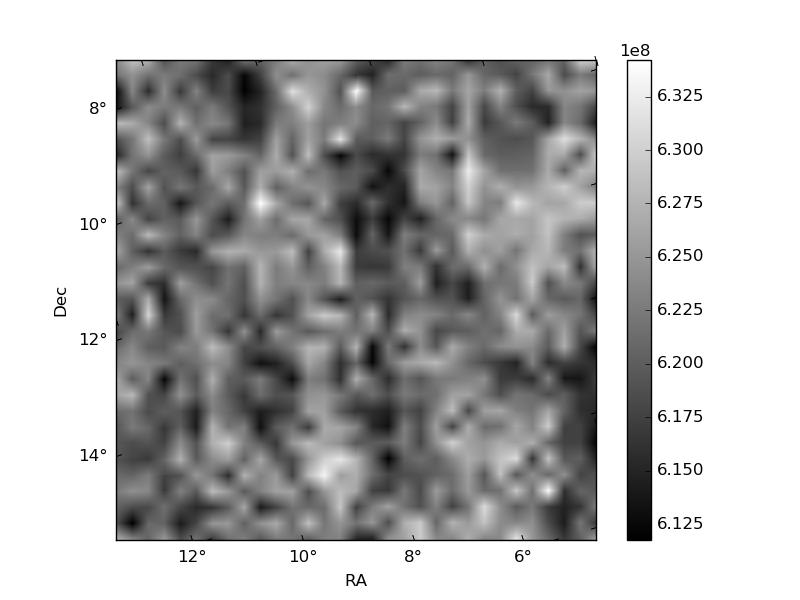
Histogram calculated using DETX and DETY for each event in the final _common_clean file
| Quadrant A | 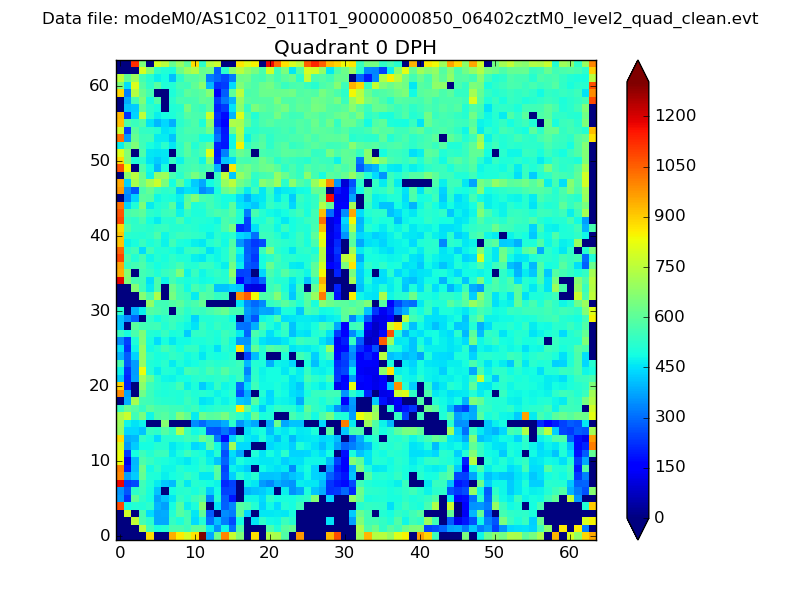 |
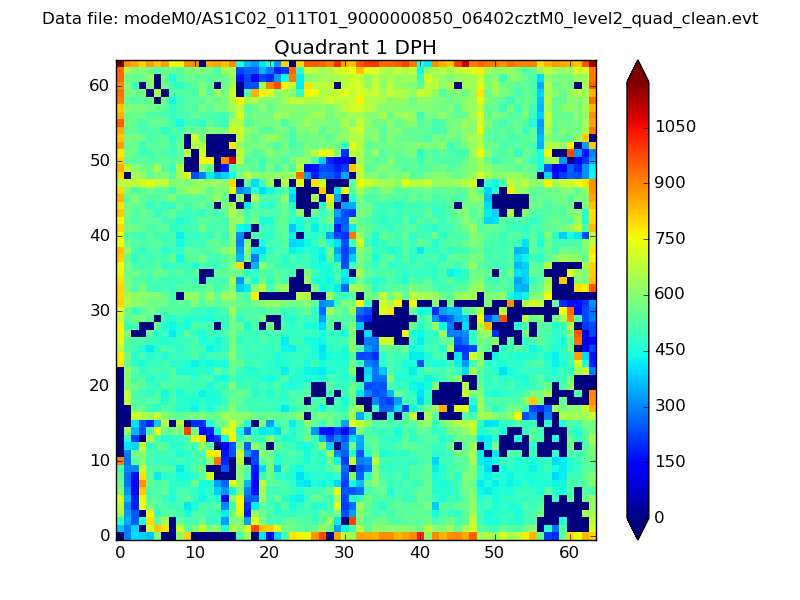 |
Quadrant B |
|---|---|---|---|
| Quadrant D | 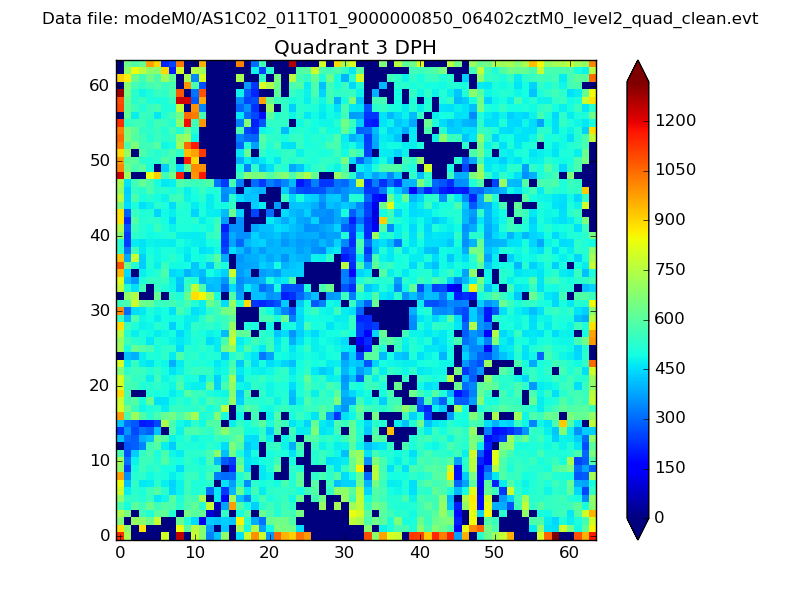 |
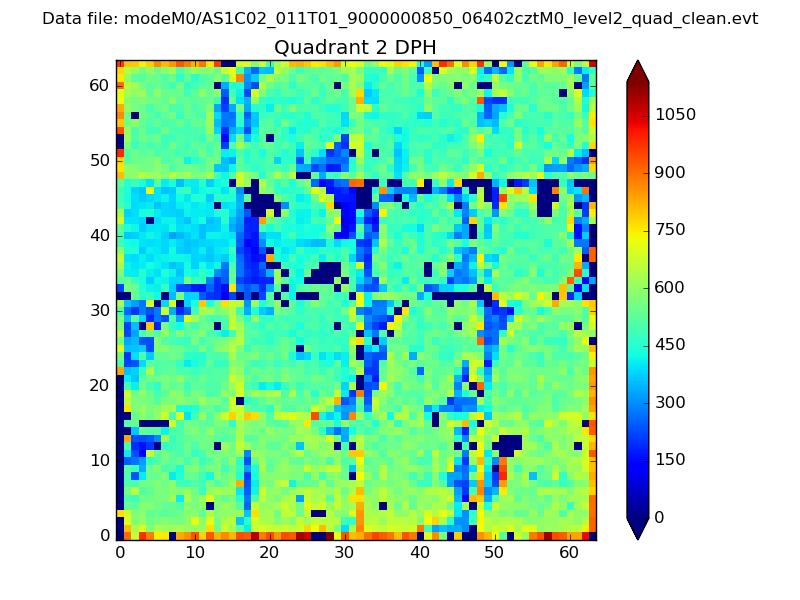 |
Quadrant C |
| Plot type | Count rate plots | Images |
|---|---|---|
| Comparison with Poisson distribution Blue bars denote a histogram of data divided into 1 sec bins. Red curve is a Poisson curve with rate = median count rate of data. |
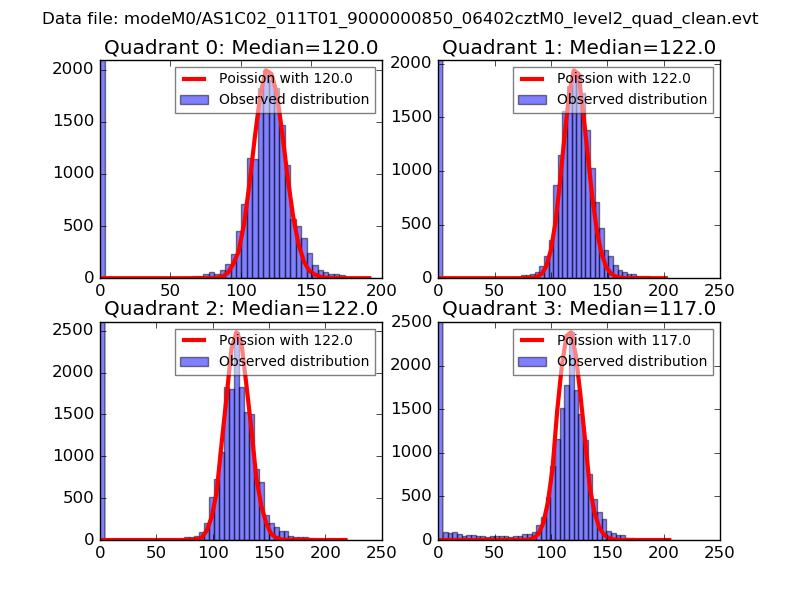 |
 |
| Quadrant-wise count rates Data is divided into 100 sec bins |
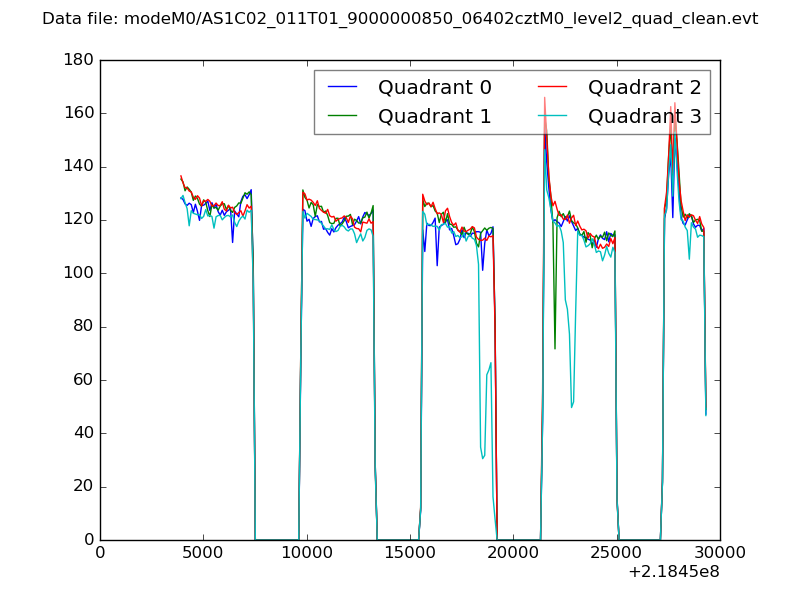 |
|
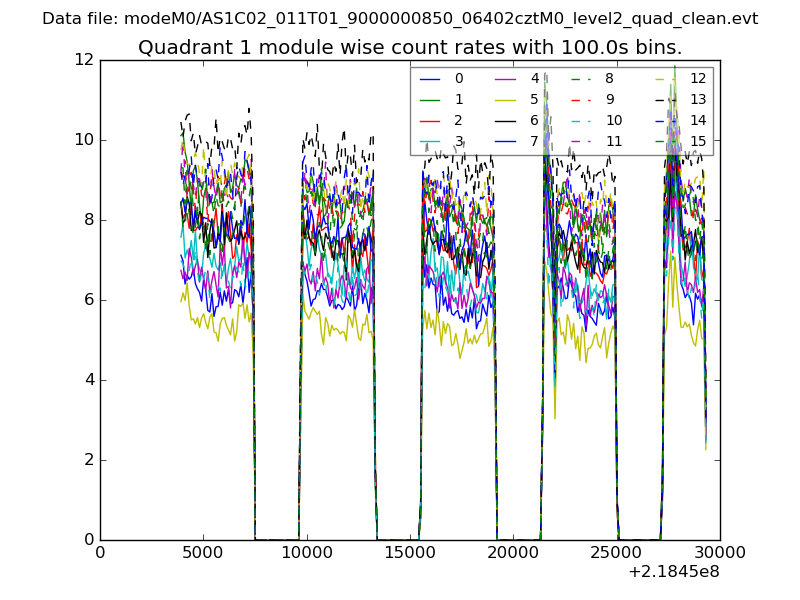
| Module-wise count rates for Quadrant A Data is divided into 100 sec bins |
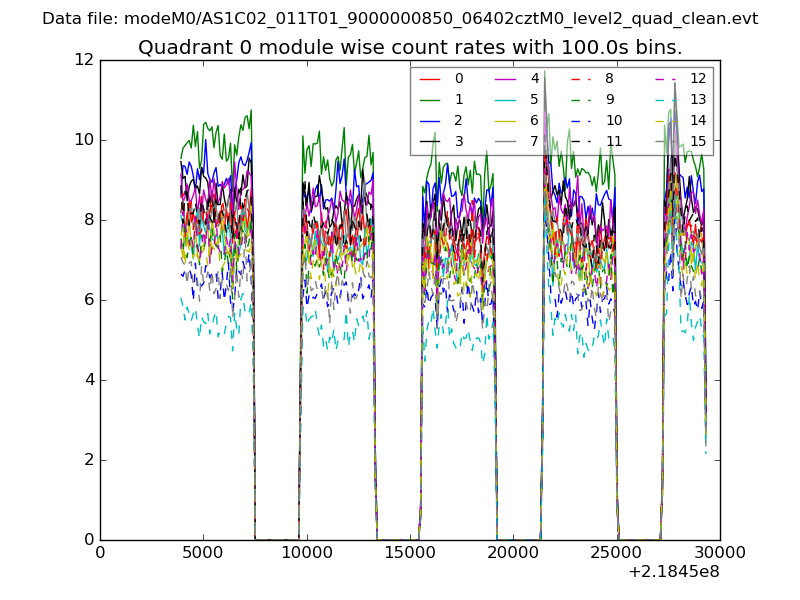 |
 |
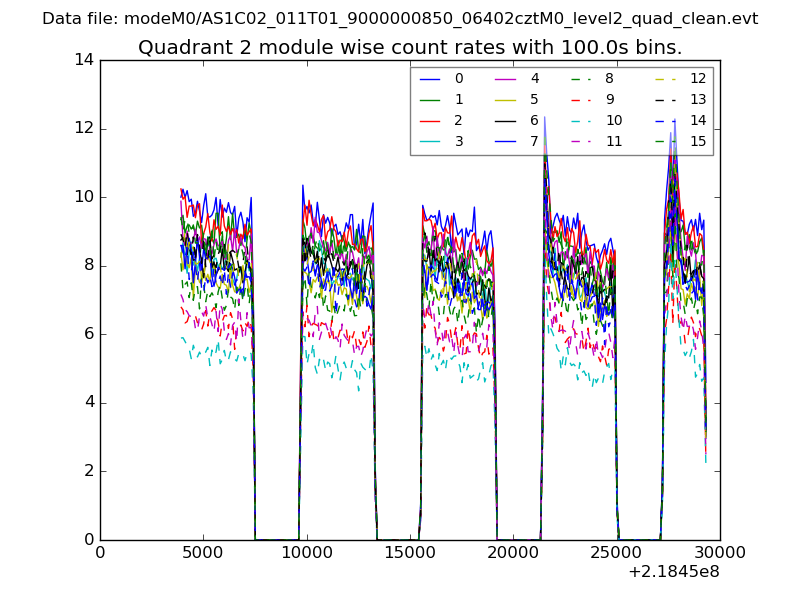
| Module-wise count rates for Quadrant B Data is divided into 100 sec bins |
 |
 |
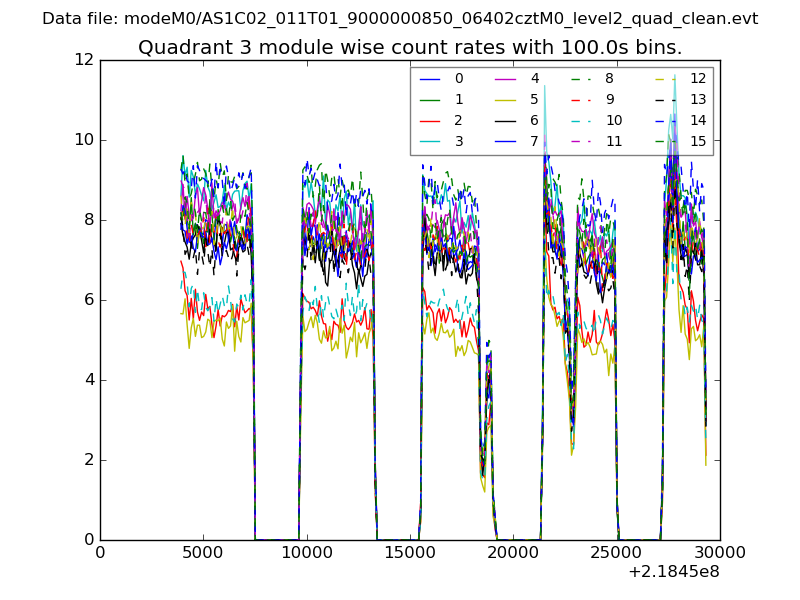
| Module-wise count rates for Quadrant C Data is divided into 100 sec bins |
 |
 |
| Module-wise count rates for Quadrant D Data is divided into 100 sec bins |
 |
 |
| Parameter | Plot |
|---|---|
| CZT HV Monitor | 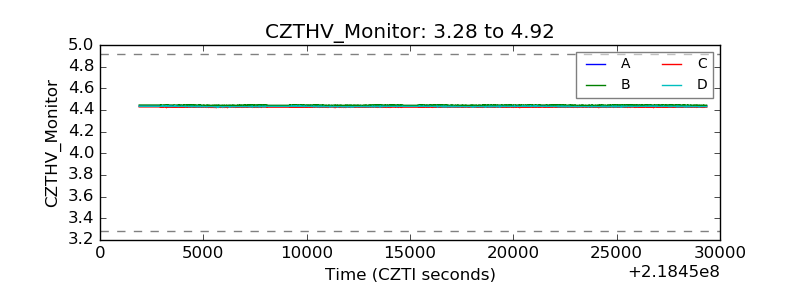 |
| D_VDD | 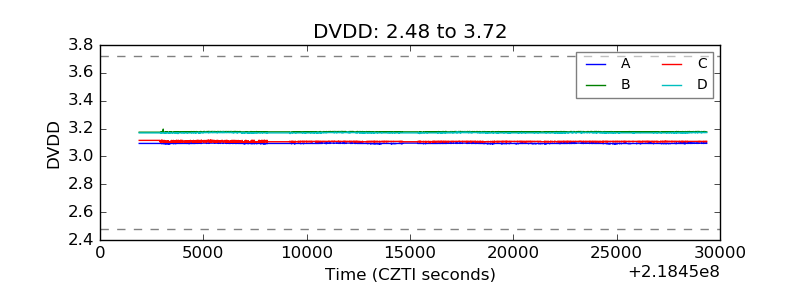 |
| Temperature 1 | 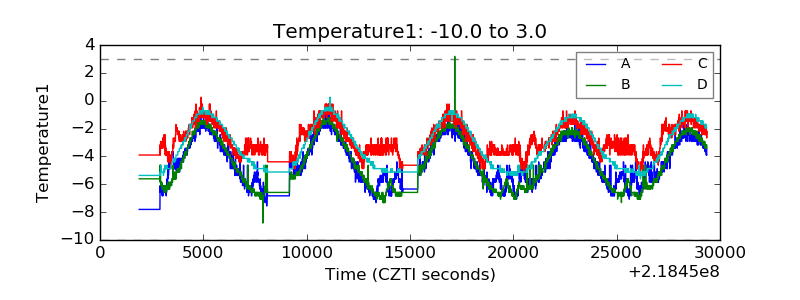 |
| Veto HV Monitor | 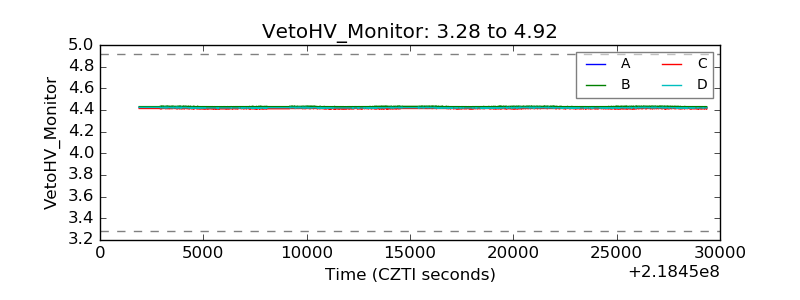 |
| Veto LLD | 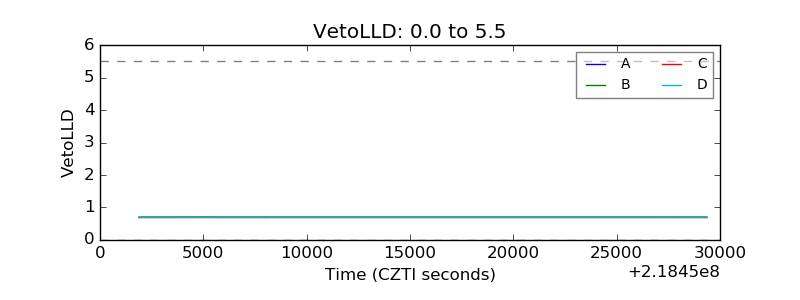 |
| Alpha Counter | 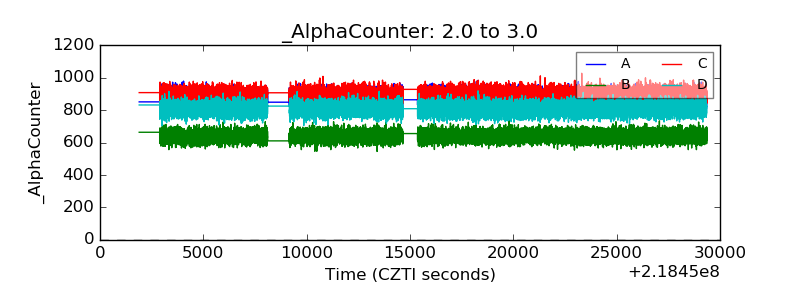 |
| _CPM_Rate | 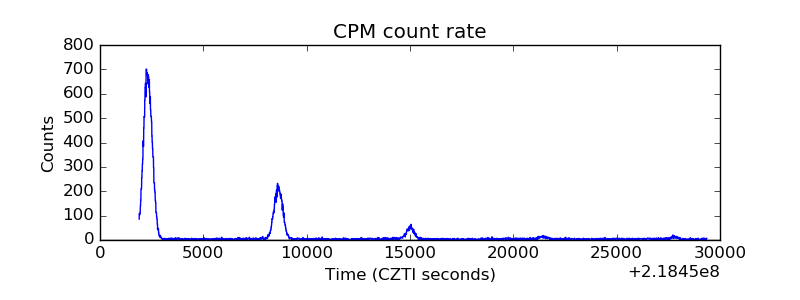 |
| CZT Counter | 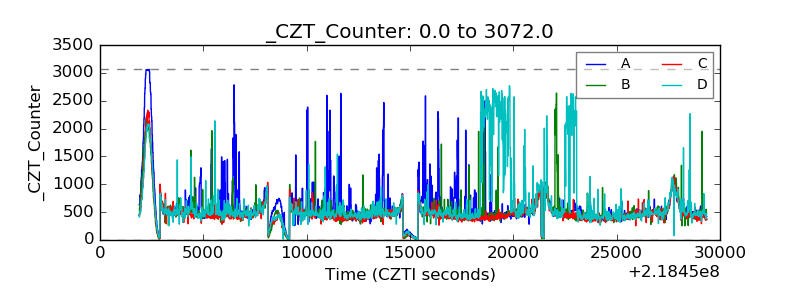 |
| +2.5 Volts monitor | 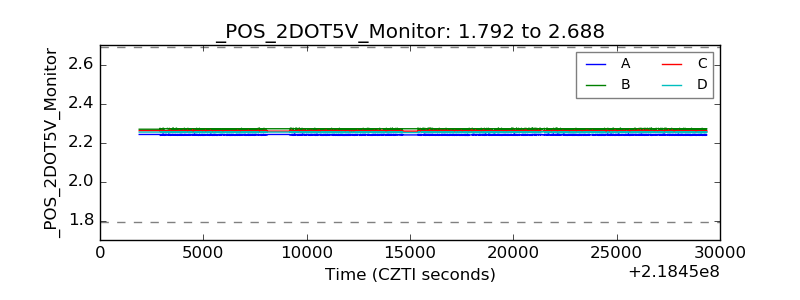 |
| +5 Volts monitor |  |
| _ROLL_ROT | 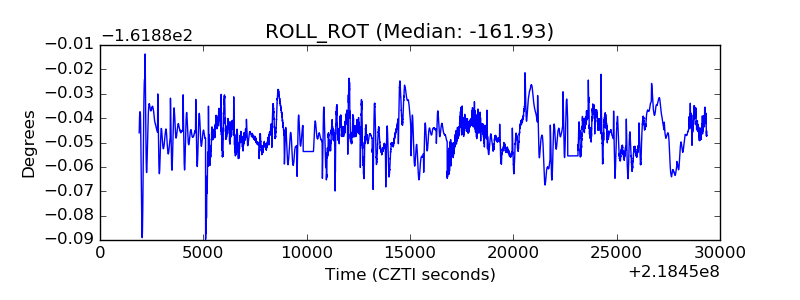 |
| _Roll_DEC | 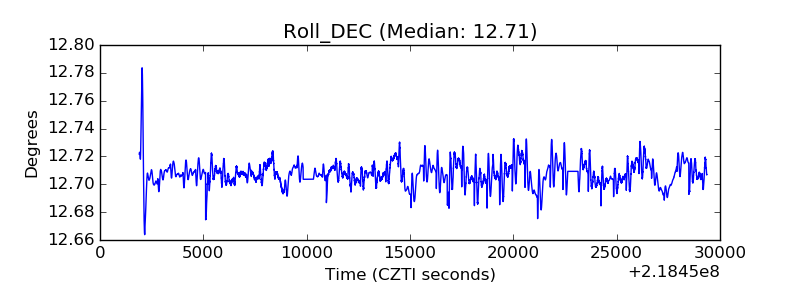 |
| _Roll_RA | 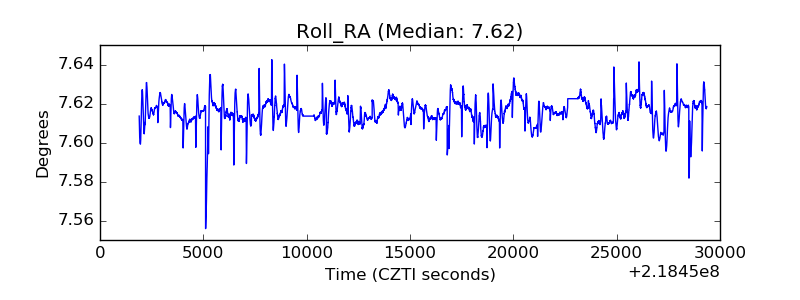 |
| Veto Counter | 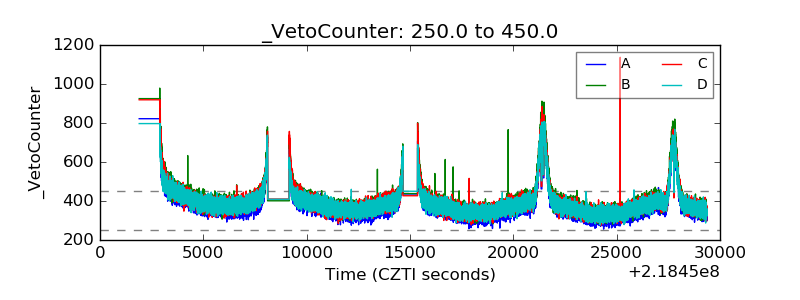 |