| Param | Original file | Final file |
|---|---|---|
| Filename | modeM0/AS1C02_011T01_9000000850_06403cztM0_level2.evt | modeM0/AS1C02_011T01_9000000850_06403cztM0_level2_quad_clean.evt |
| Size (bytes) | 531,498,240 | 104,411,520 |
| Size | 506.9 MB | 99.6 MB |
| Events in quadrant A | 3,897,070 | 654,262 |
| Events in quadrant B | 3,827,018 | 664,888 |
| Events in quadrant C | 3,747,164 | 666,613 |
| Events in quadrant D | 4,101,438 | 639,786 |
| Mode SS | |||
|---|---|---|---|
| Quadrant | BADHDUFLAG | Total packets | Discarded packets |
| A | 0 | 154 | 0 |
| B | 0 | 154 | 0 |
| C | 0 | 154 | 0 |
| D | 0 | 154 | 0 |
| Mode M0 | |||
|---|---|---|---|
| Quadrant | BADHDUFLAG | Total packets | Discarded packets |
| A | 0 | 16715 | 3 |
| B | 0 | 16584 | 2 |
| C | 0 | 16605 | 2 |
| D | 0 | 17357 | 2 |
| Mode M9 | |||
|---|---|---|---|
| Quadrant | BADHDUFLAG | Total packets | Discarded packets |
| A | 0 | 4 | 0 |
| B | 0 | 4 | 0 |
| C | 0 | 4 | 0 |
| D | 0 | 4 | 0 |
| Quadrant | Total seconds | Saturated seconds | Saturation percentage |
|---|---|---|---|
| A | 7721 | 222 | 2.875275% |
| B | 7721 | 236 | 3.056599% |
| C | 7721 | 86 | 1.113845% |
| D | 7721 | 123 | 1.593058% |
Noise dominated data is calculated using 1-second bins in cleaned event files. If a bin has >2000 counts, and if more than 50% of those come from <1% of pixels, then it is considered to be noise-dominated and hence unusable.
| Quadrant | # 1 sec bins | Bins with >0 counts | Bins with >2000 counts | High rate bins dominated by noise | Noise dominated (total time) | Noise dominated (detector-on time) | Marked lightcurve |
|---|---|---|---|---|---|---|---|
| A | 8061 | 7723 | 1 | 1 | 0.01% | 0.01% | 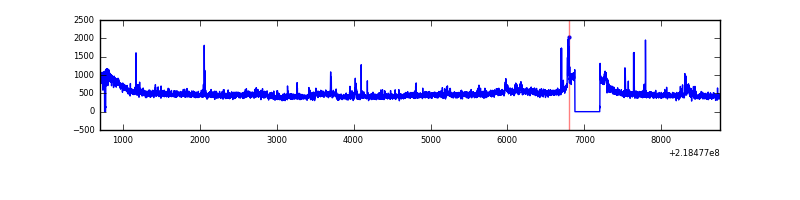 |
| B | 8061 | 7723 | 8 | 8 | 0.10% | 0.10% | 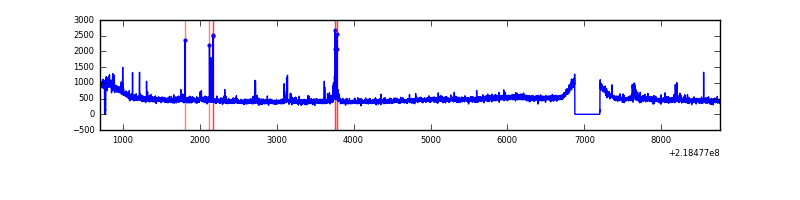 |
| C | 8061 | 7723 | 2 | 2 | 0.02% | 0.03% | 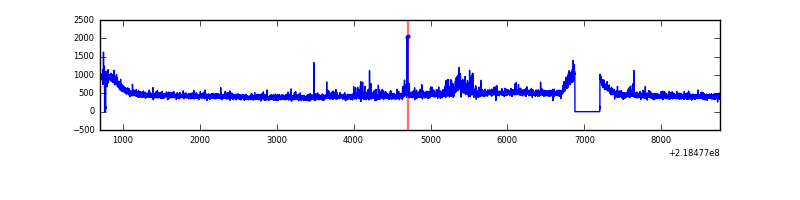 |
| D | 8061 | 7723 | 37 | 37 | 0.46% | 0.48% | 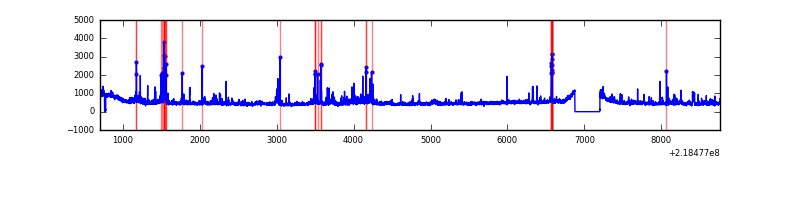 |
Top three noisy pixels from each quadrant. If the there are fewer than three noisy pixels in the level2.evt file, extra rows are filled as -1
| Pixel properties | Quadrant properties | ||||||
|---|---|---|---|---|---|---|---|
| Quadrant | DetID | PixID | Counts | Sigma | Mean | Median | Sigma |
| A | 8 | 15 | 99951 | 513.56 | 940 | 918 | 192.8 |
| A | 15 | 174 | 65854 | 336.74 | 940 | 918 | 192.8 |
| A | 15 | 236 | 52487 | 267.43 | 940 | 918 | 192.8 |
| B | 15 | 204 | 33171 | 174.32 | 943 | 920 | 185.0 |
| B | 15 | 35 | 28997 | 151.76 | 943 | 920 | 185.0 |
| B | 4 | 81 | 26660 | 139.13 | 943 | 920 | 185.0 |
| C | 9 | 16 | 117168 | 542.26 | 912 | 915 | 214.4 |
| C | 8 | 208 | 52128 | 238.88 | 912 | 915 | 214.4 |
| C | 8 | 128 | 9208 | 38.68 | 912 | 915 | 214.4 |
| D | 2 | 152 | 210548 | 932.49 | 916 | 885 | 224.8 |
| D | 4 | 95 | 131749 | 582.02 | 916 | 885 | 224.8 |
| D | 14 | 173 | 84791 | 373.17 | 916 | 885 | 224.8 |
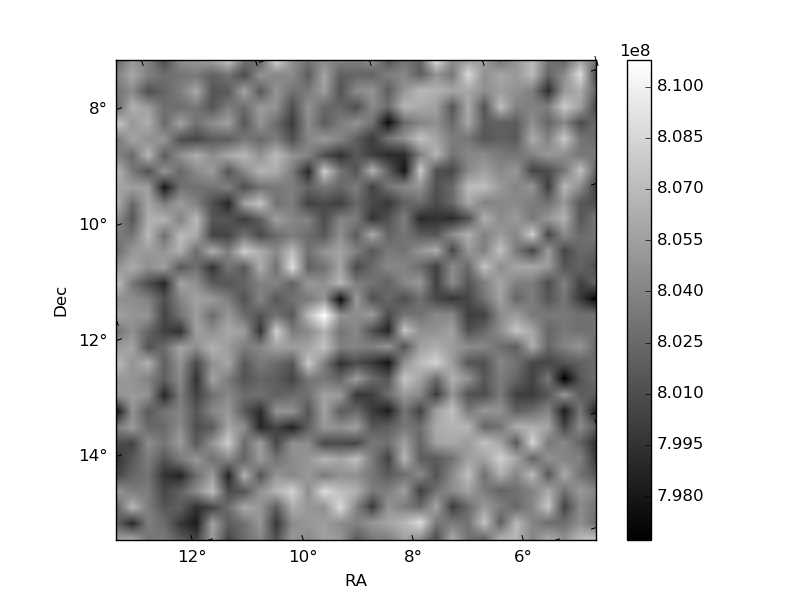
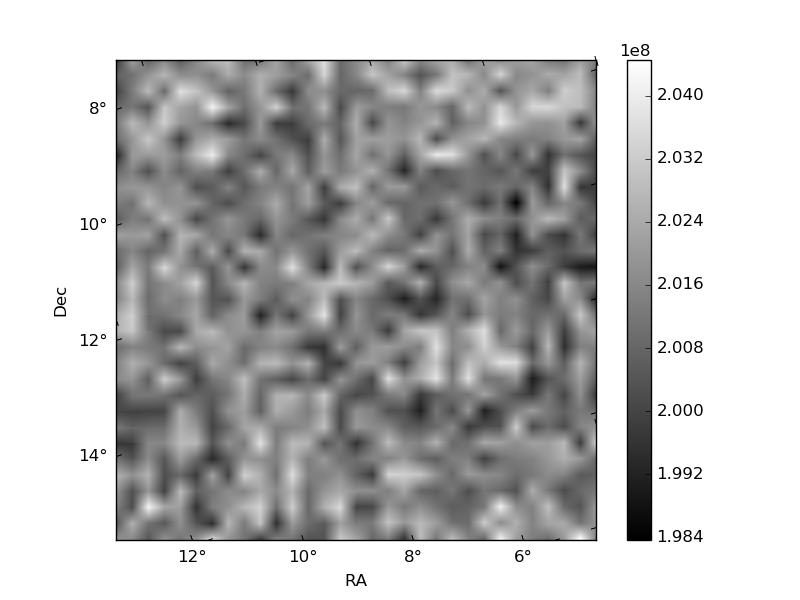
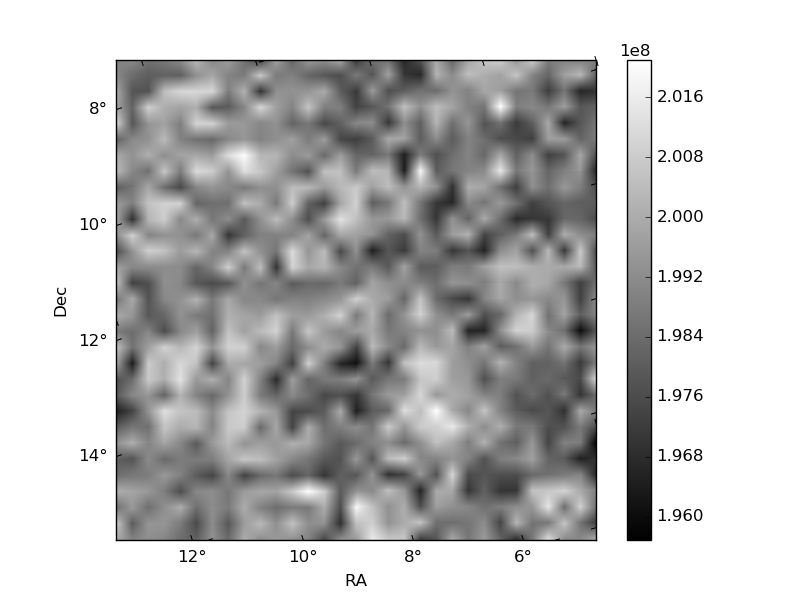
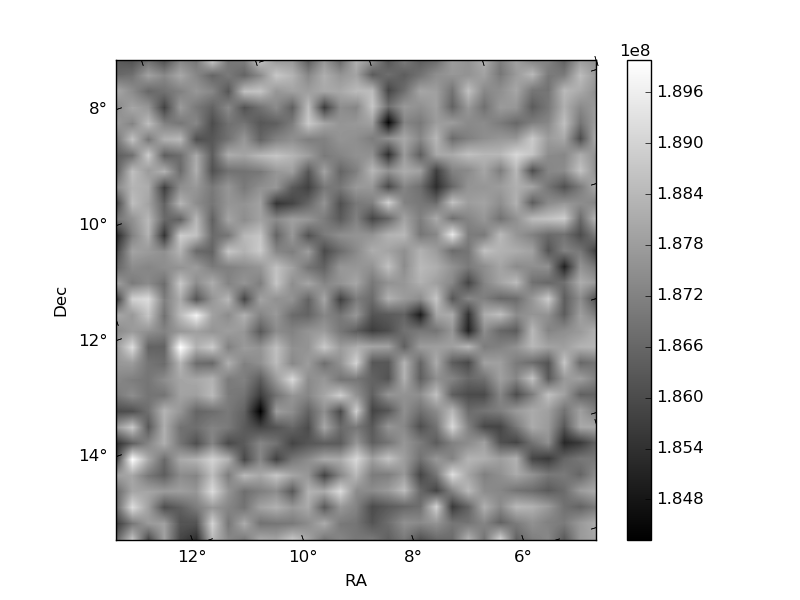
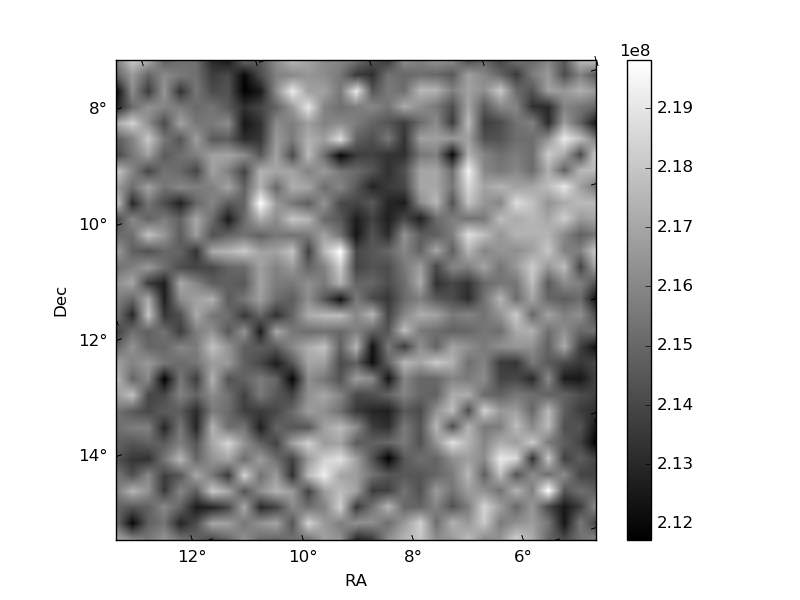
Histogram calculated using DETX and DETY for each event in the final _common_clean file
| Quadrant A | 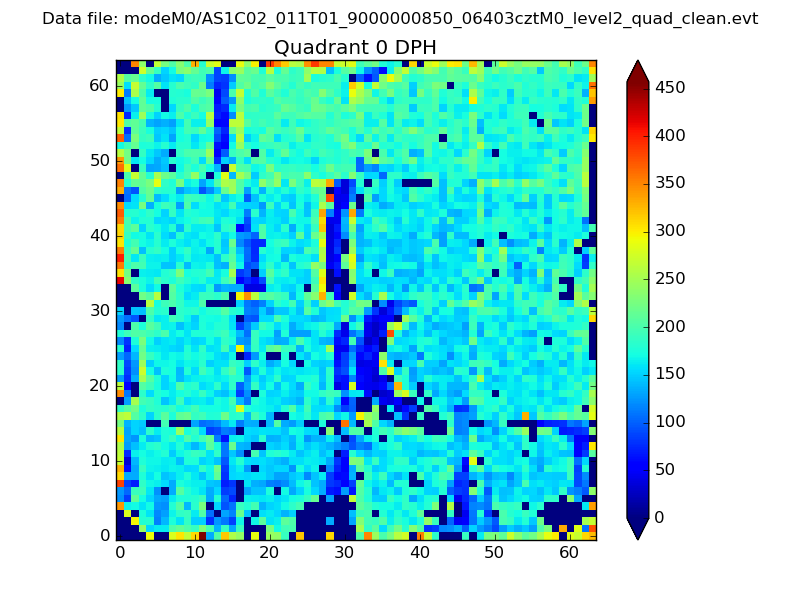 |
 |
Quadrant B |
|---|---|---|---|
| Quadrant D | 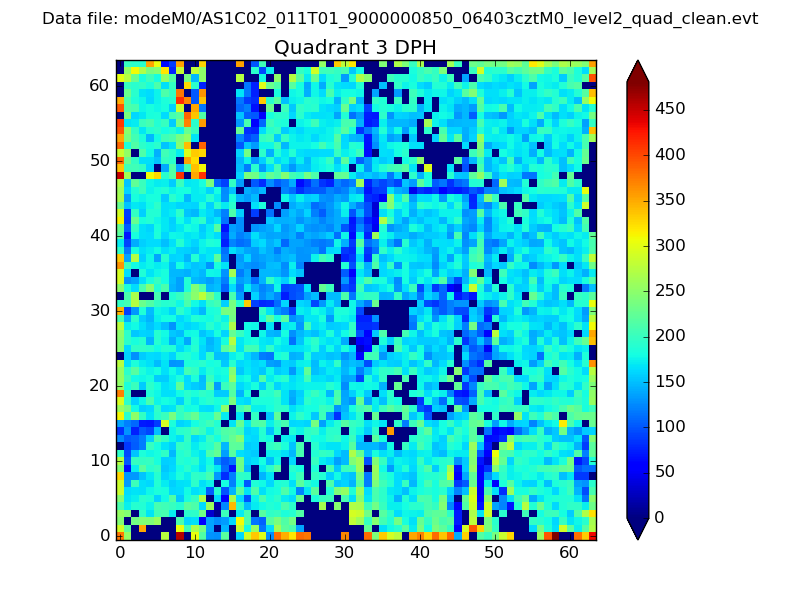 |
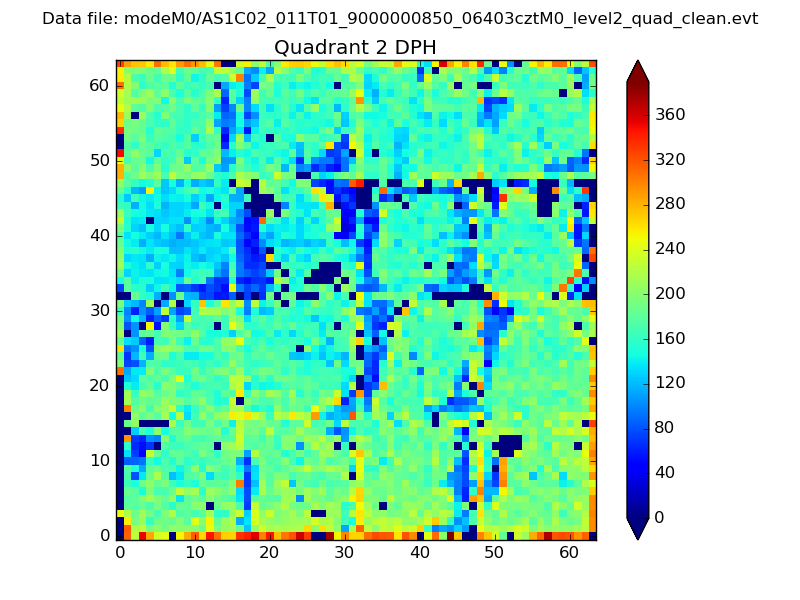 |
Quadrant C |
| Plot type | Count rate plots | Images |
|---|---|---|
| Comparison with Poisson distribution Blue bars denote a histogram of data divided into 1 sec bins. Red curve is a Poisson curve with rate = median count rate of data. |
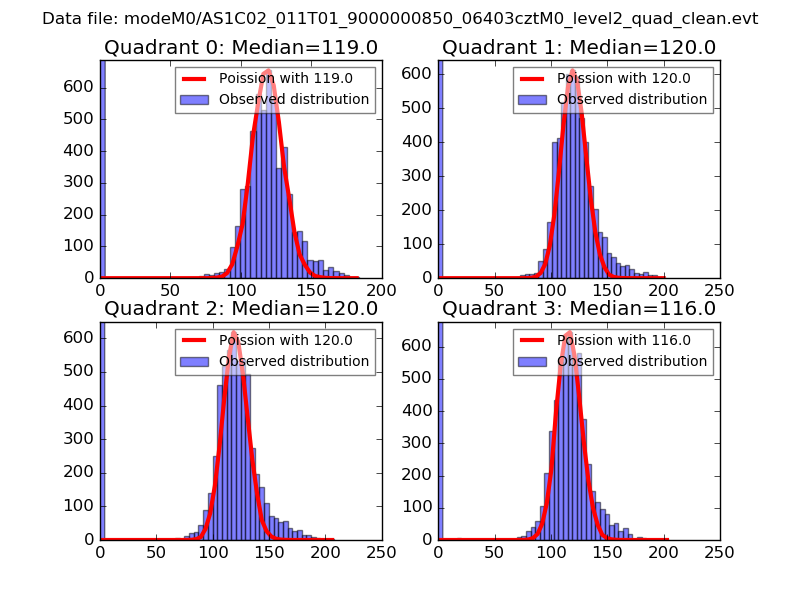 |
 |
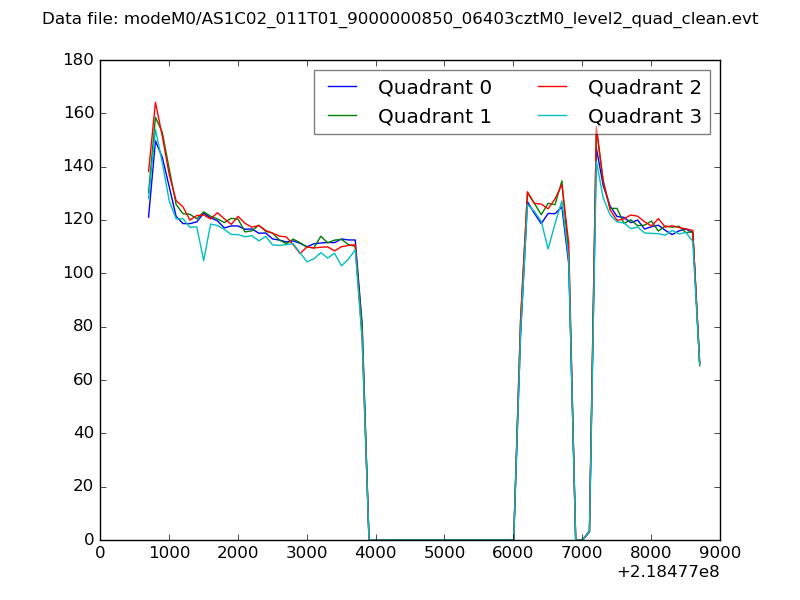
| Quadrant-wise count rates Data is divided into 100 sec bins |
 |
|
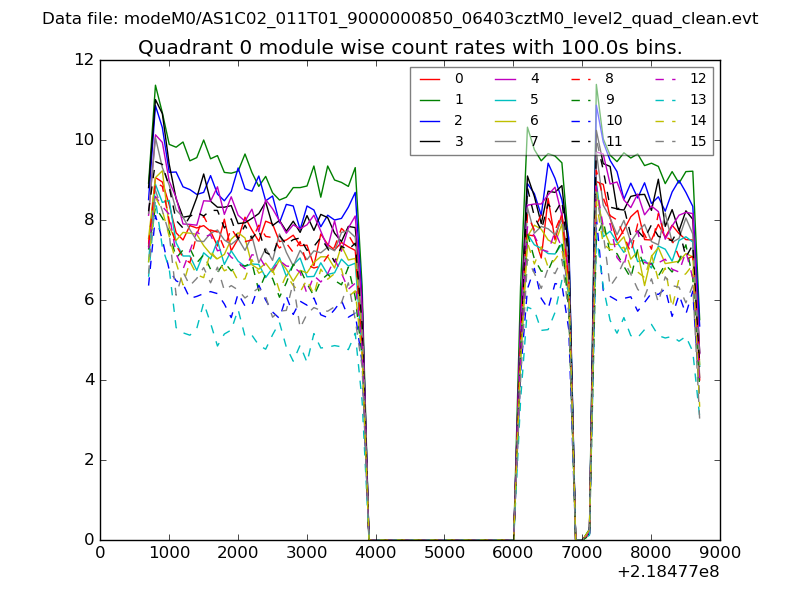
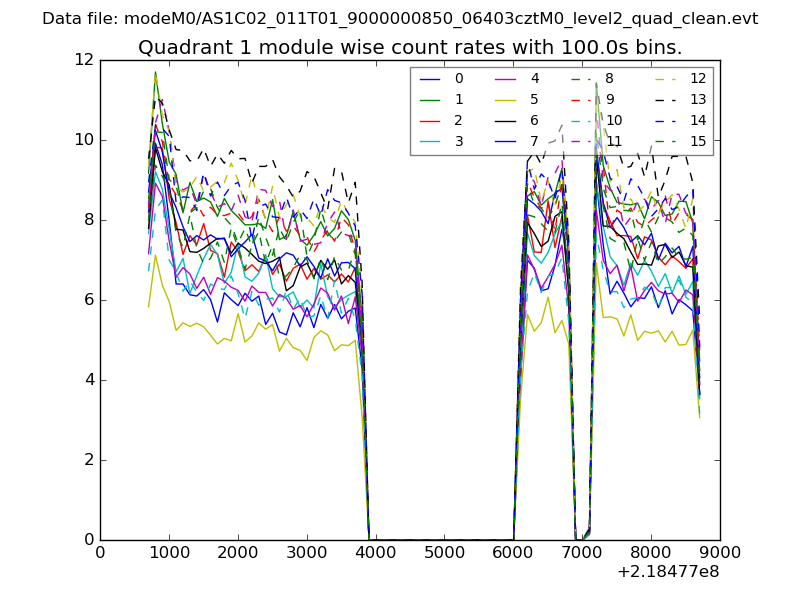
| Module-wise count rates for Quadrant A Data is divided into 100 sec bins |
 |
 |
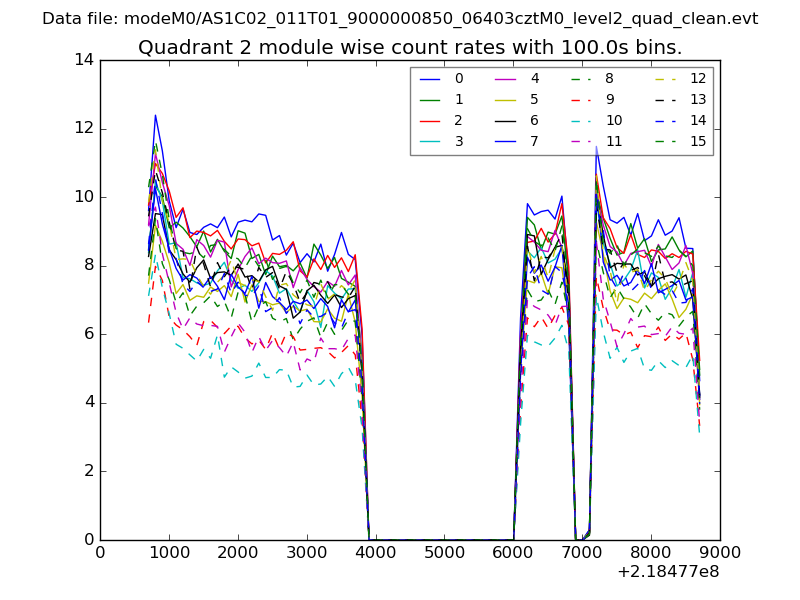
| Module-wise count rates for Quadrant B Data is divided into 100 sec bins |
 |
 |
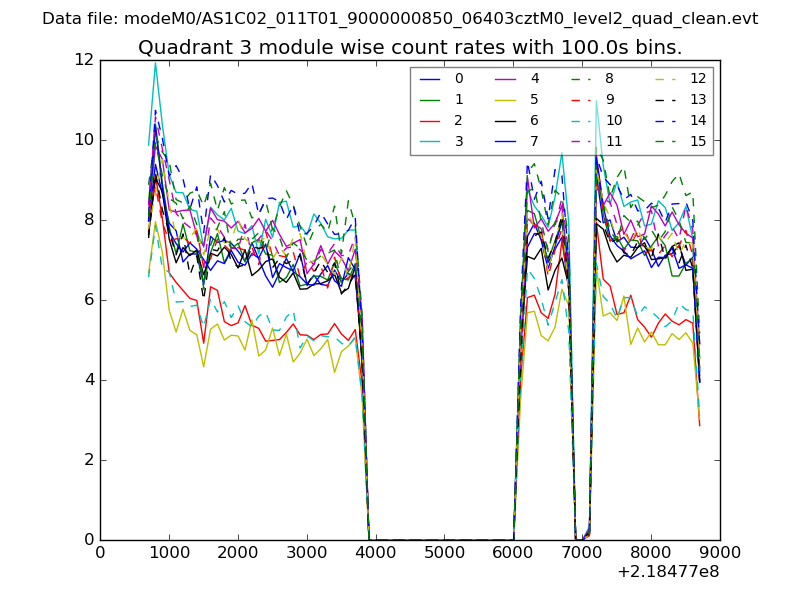
| Module-wise count rates for Quadrant C Data is divided into 100 sec bins |
 |
 |
| Module-wise count rates for Quadrant D Data is divided into 100 sec bins |
 |
 |
| Parameter | Plot |
|---|---|
| CZT HV Monitor | 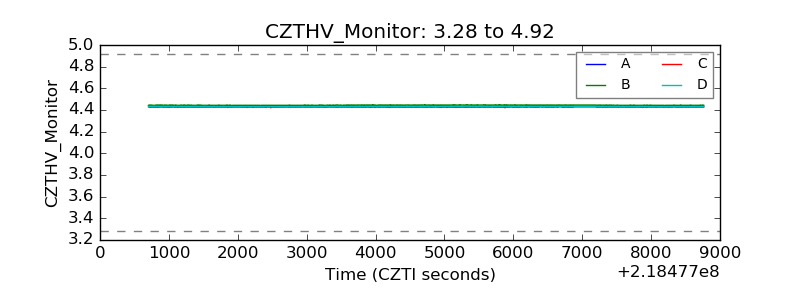 |
| D_VDD | 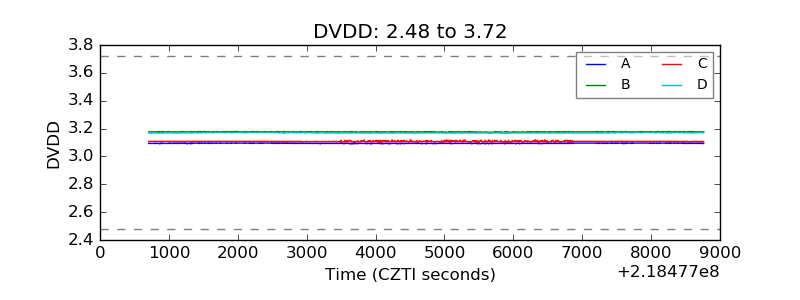 |
| Temperature 1 | 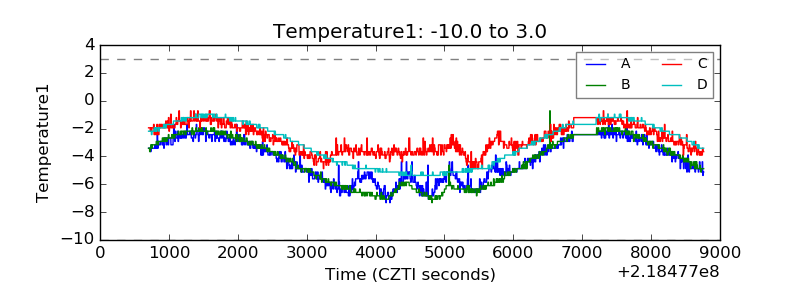 |
| Veto HV Monitor | 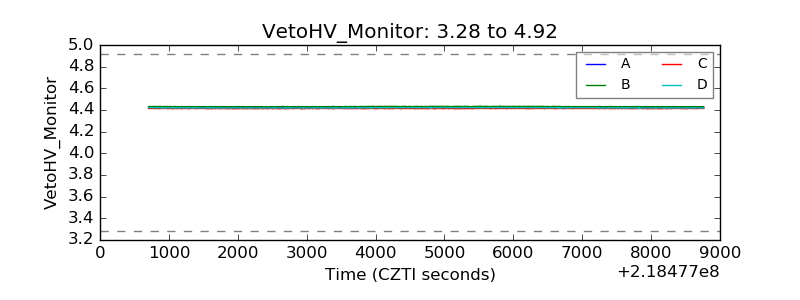 |
| Veto LLD | 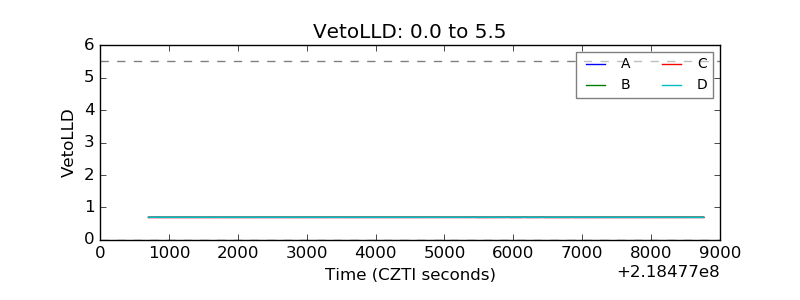 |
| Alpha Counter | 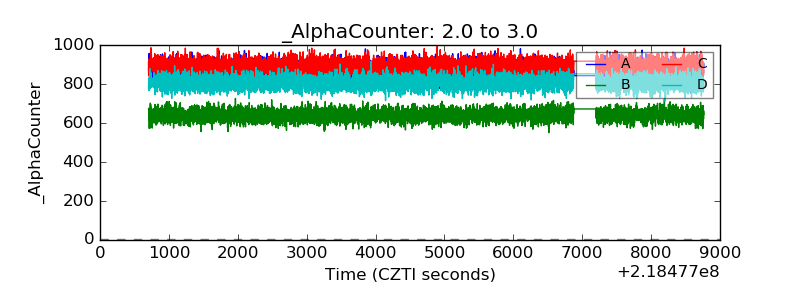 |
| _CPM_Rate | 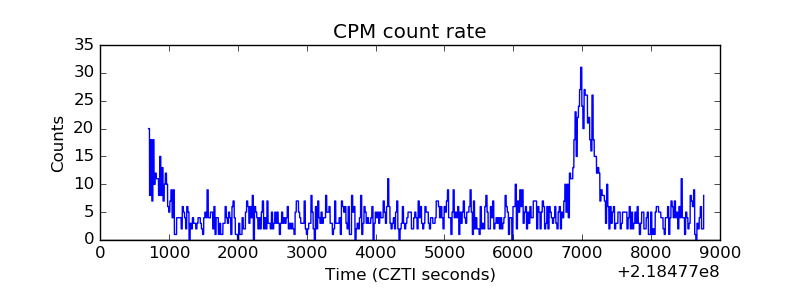 |
| CZT Counter | 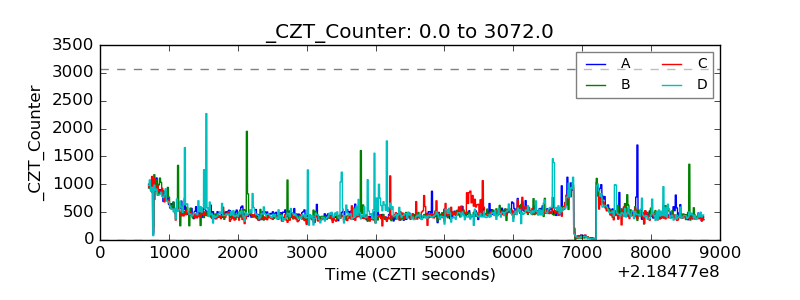 |
| +2.5 Volts monitor |  |
| +5 Volts monitor |  |
| _ROLL_ROT | 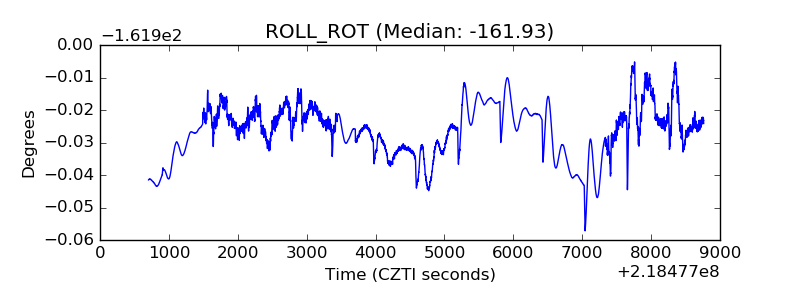 |
| _Roll_DEC | 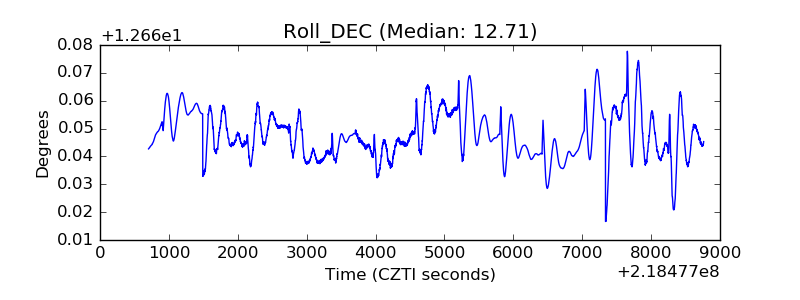 |
| _Roll_RA | 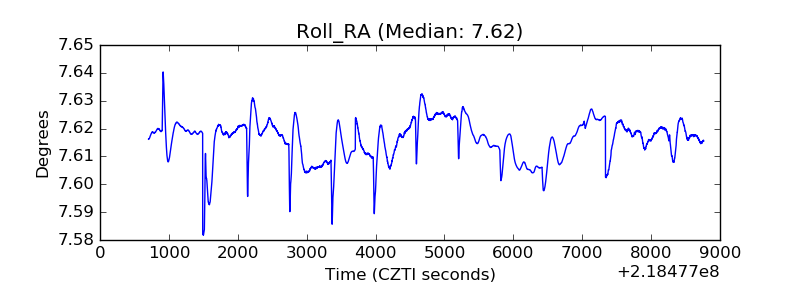 |
| Veto Counter |  |