| Param | Original file | Final file |
|---|---|---|
| Filename | modeM0/AS1C02_011T01_9000000850_06405cztM0_level2.evt | modeM0/AS1C02_011T01_9000000850_06405cztM0_level2_quad_clean.evt |
| Size (bytes) | 304,652,160 | 49,190,400 |
| Size | 290.5 MB | 46.9 MB |
| Events in quadrant A | 2,044,348 | 295,439 |
| Events in quadrant B | 2,168,550 | 295,682 |
| Events in quadrant C | 2,550,199 | 294,991 |
| Events in quadrant D | 2,156,363 | 286,590 |
| Mode SS | |||
|---|---|---|---|
| Quadrant | BADHDUFLAG | Total packets | Discarded packets |
| A | 0 | 90 | 0 |
| B | 0 | 90 | 0 |
| C | 0 | 90 | 0 |
| D | 0 | 90 | 0 |
| Mode M0 | |||
|---|---|---|---|
| Quadrant | BADHDUFLAG | Total packets | Discarded packets |
| A | 0 | 9373 | 2 |
| B | 0 | 9596 | 1 |
| C | 0 | 10920 | 1 |
| D | 0 | 9672 | 1 |
| Mode M9 | |||
|---|---|---|---|
| Quadrant | BADHDUFLAG | Total packets | Discarded packets |
| A | 0 | 1 | 0 |
| B | 0 | 1 | 0 |
| C | 0 | 1 | 0 |
| D | 0 | 2 | 0 |
| Quadrant | Total seconds | Saturated seconds | Saturation percentage |
|---|---|---|---|
| A | 4497 | 35 | 0.778297% |
| B | 4497 | 49 | 1.089615% |
| C | 4497 | 37 | 0.822771% |
| D | 4497 | 22 | 0.489215% |
Noise dominated data is calculated using 1-second bins in cleaned event files. If a bin has >2000 counts, and if more than 50% of those come from <1% of pixels, then it is considered to be noise-dominated and hence unusable.
| Quadrant | # 1 sec bins | Bins with >0 counts | Bins with >2000 counts | High rate bins dominated by noise | Noise dominated (total time) | Noise dominated (detector-on time) | Marked lightcurve |
|---|---|---|---|---|---|---|---|
| A | 4497 | 4497 | 8 | 8 | 0.18% | 0.18% | 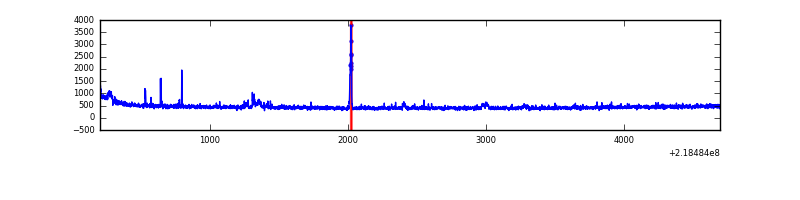 |
| B | 4497 | 4497 | 16 | 16 | 0.36% | 0.36% | 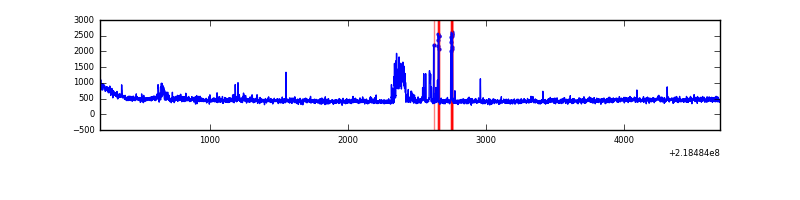 |
| C | 4497 | 4497 | 30 | 30 | 0.67% | 0.67% | 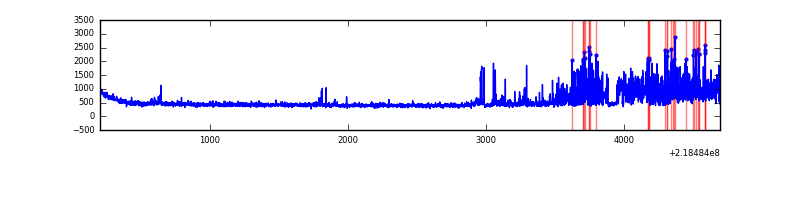 |
| D | 4497 | 4497 | 13 | 13 | 0.29% | 0.29% | 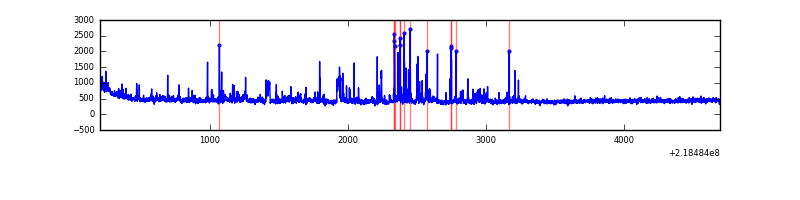 |
Top three noisy pixels from each quadrant. If the there are fewer than three noisy pixels in the level2.evt file, extra rows are filled as -1
| Pixel properties | Quadrant properties | ||||||
|---|---|---|---|---|---|---|---|
| Quadrant | DetID | PixID | Counts | Sigma | Mean | Median | Sigma |
| A | 15 | 174 | 40755 | 389.14 | 501 | 490 | 103.5 |
| A | 15 | 236 | 21190 | 200.06 | 501 | 490 | 103.5 |
| A | 13 | 251 | 20530 | 193.68 | 501 | 490 | 103.5 |
| B | 0 | 228 | 135744 | 1369.49 | 506 | 494 | 98.8 |
| B | 15 | 204 | 24950 | 247.63 | 506 | 494 | 98.8 |
| B | 4 | 81 | 23077 | 228.67 | 506 | 494 | 98.8 |
| C | 8 | 208 | 559390 | 4820.41 | 490 | 492 | 115.9 |
| C | 9 | 16 | 74608 | 639.24 | 490 | 492 | 115.9 |
| C | 13 | 61 | 3922 | 29.58 | 490 | 492 | 115.9 |
| D | 2 | 152 | 132987 | 1099.74 | 490 | 475 | 120.5 |
| D | 11 | 241 | 38428 | 314.98 | 490 | 475 | 120.5 |
| D | 13 | 105 | 36924 | 302.5 | 490 | 475 | 120.5 |
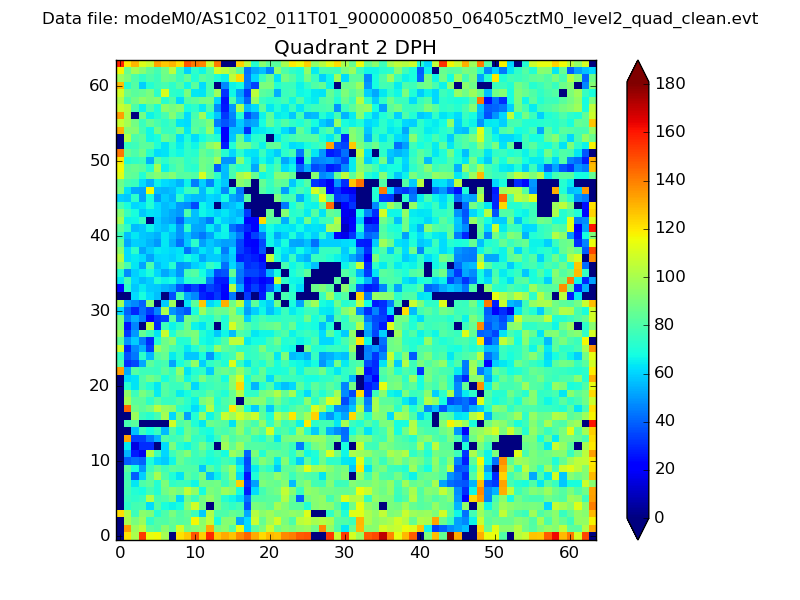
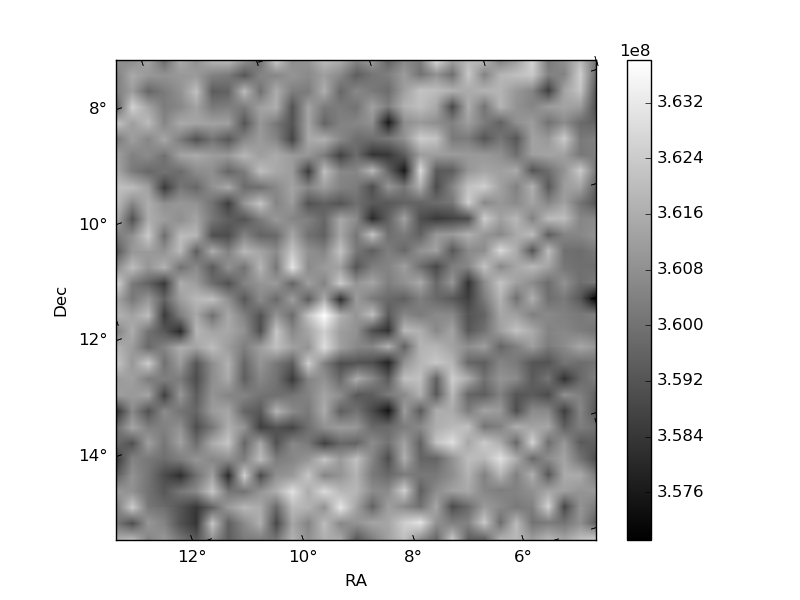
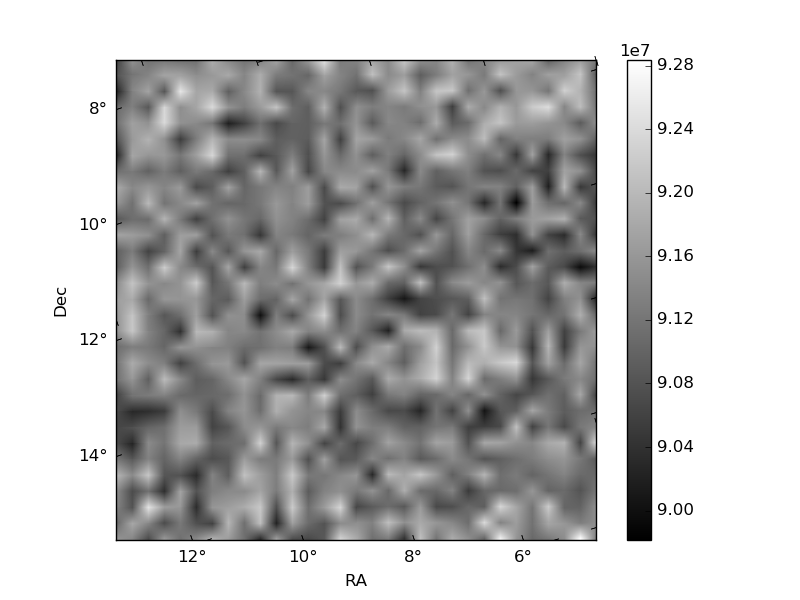
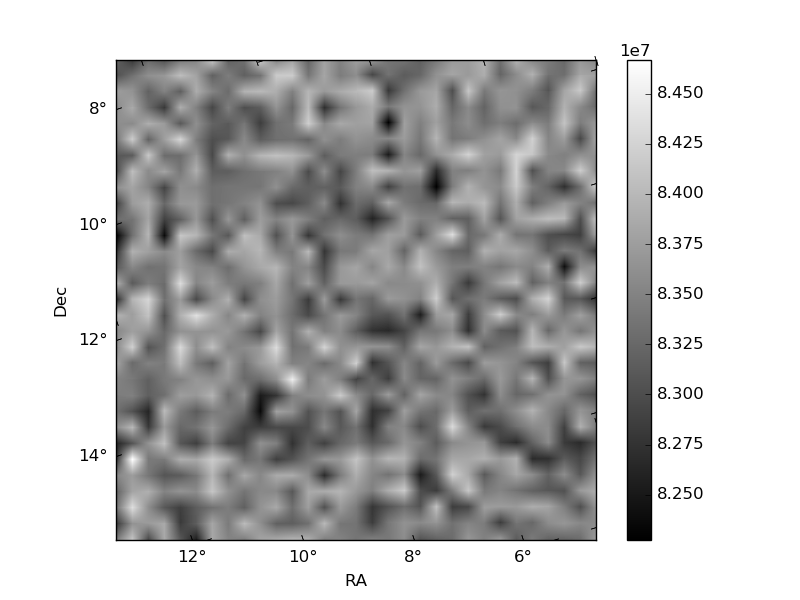
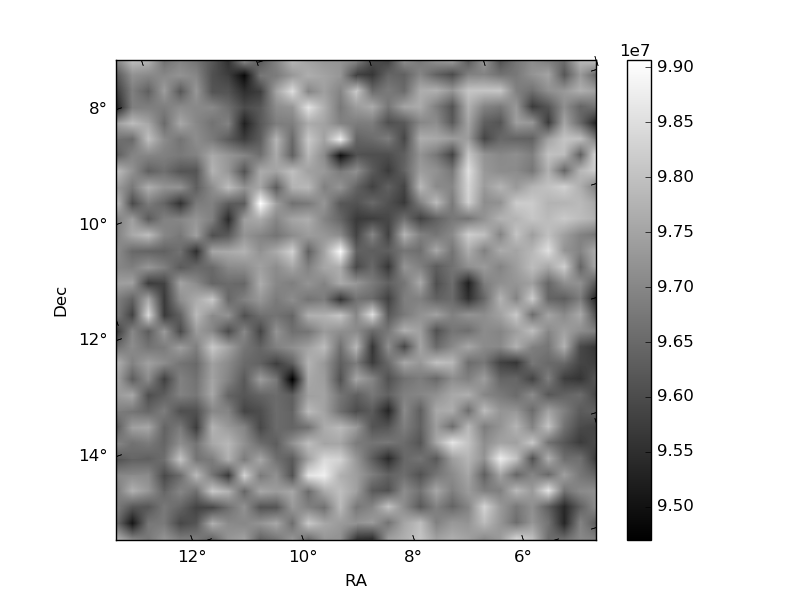
Histogram calculated using DETX and DETY for each event in the final _common_clean file
| Quadrant A | 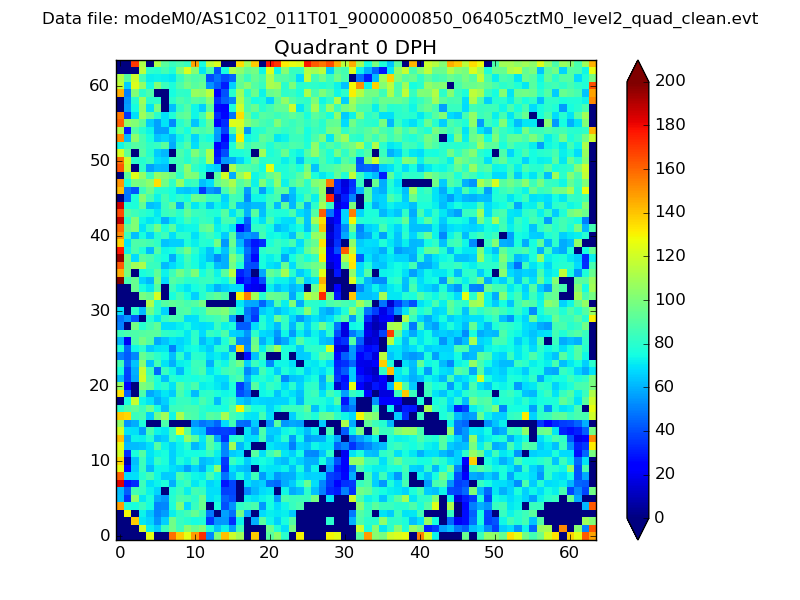 |
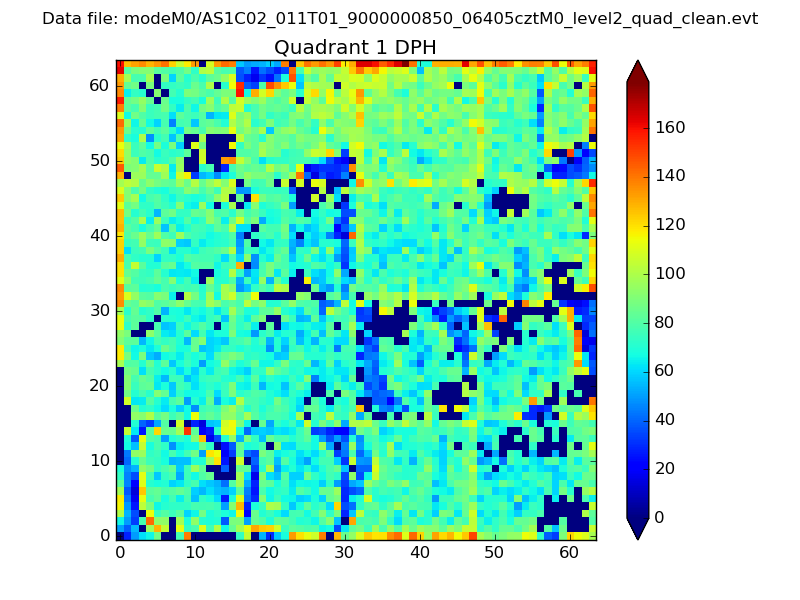 |
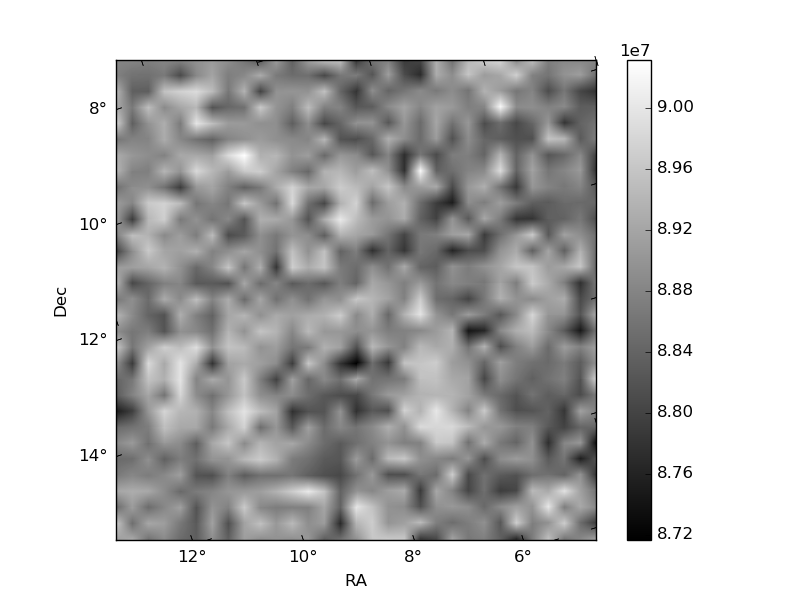
Quadrant B |
|---|---|---|---|
| Quadrant D | 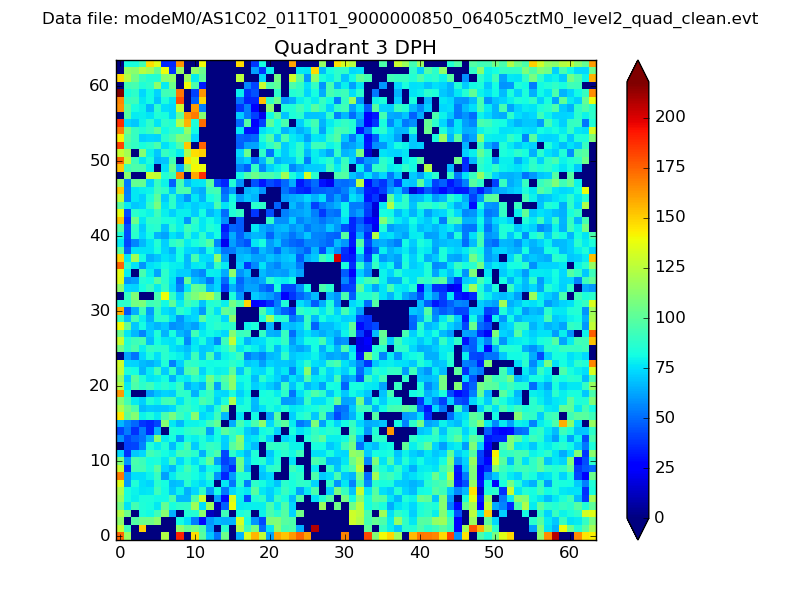 |
 |
Quadrant C |
| Plot type | Count rate plots | Images |
|---|---|---|
| Comparison with Poisson distribution Blue bars denote a histogram of data divided into 1 sec bins. Red curve is a Poisson curve with rate = median count rate of data. |
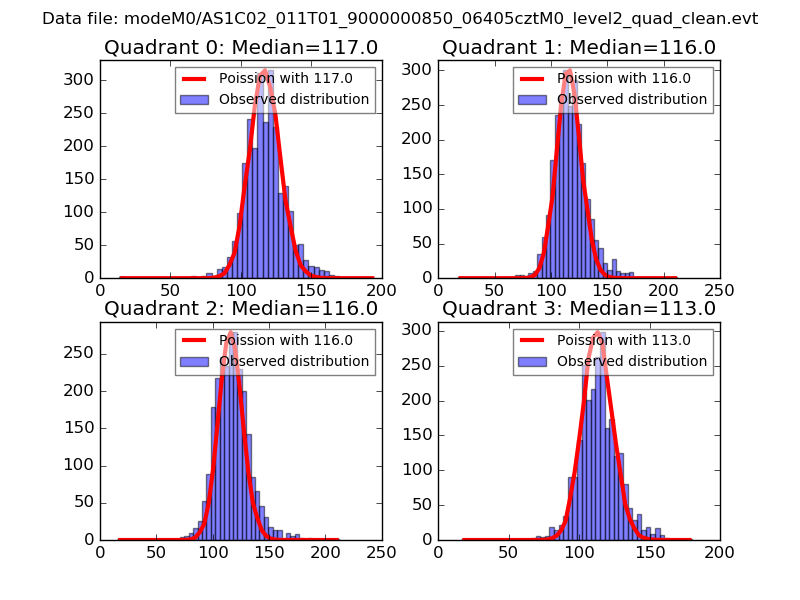 |
 |
| Quadrant-wise count rates Data is divided into 100 sec bins |
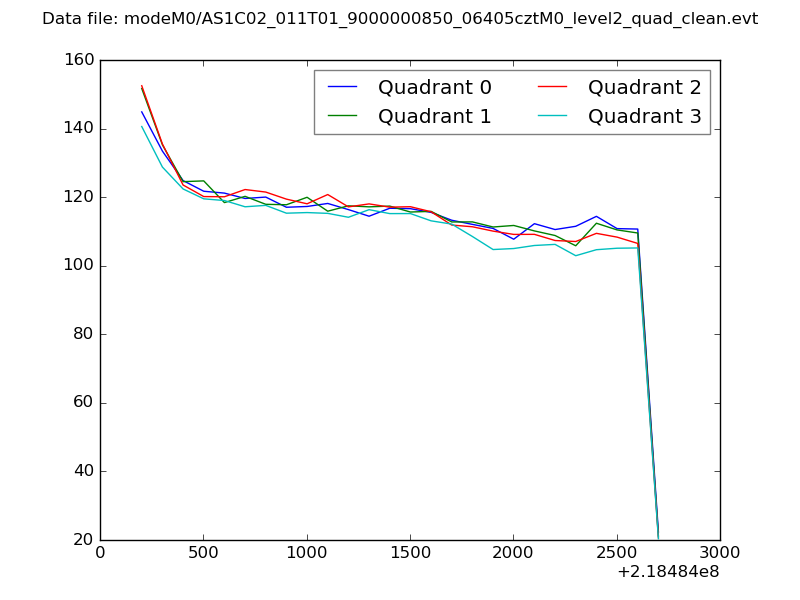 |
|
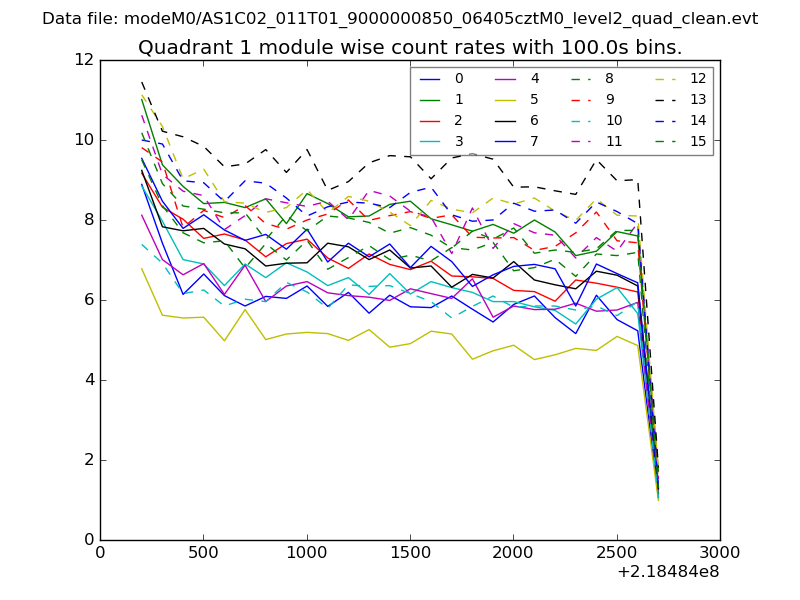
| Module-wise count rates for Quadrant A Data is divided into 100 sec bins |
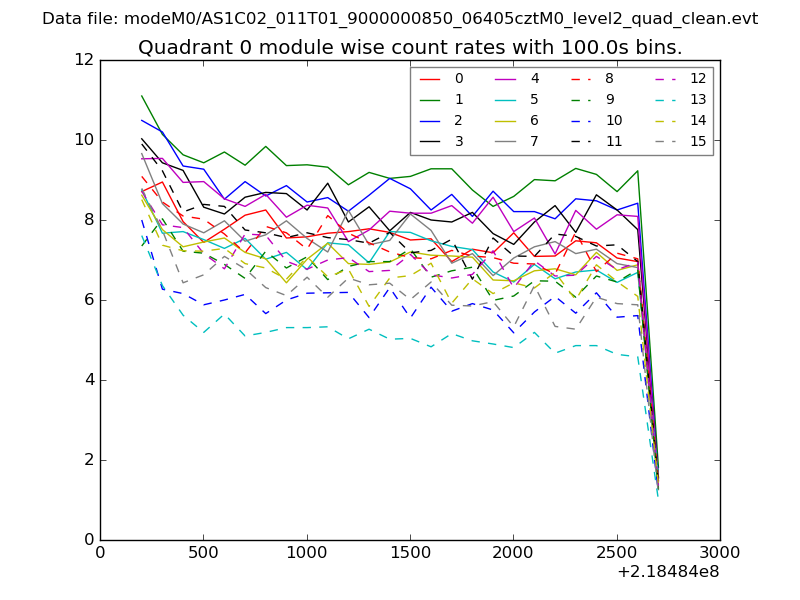 |
 |
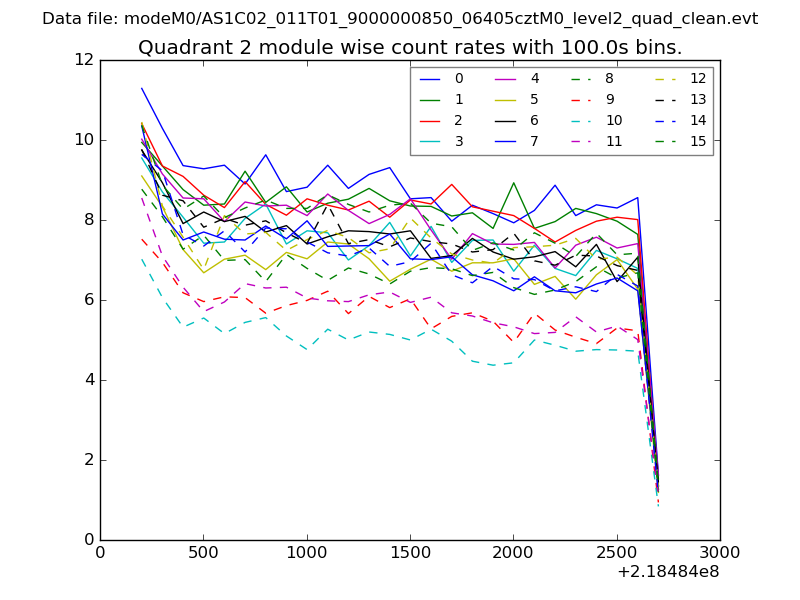
| Module-wise count rates for Quadrant B Data is divided into 100 sec bins |
 |
 |
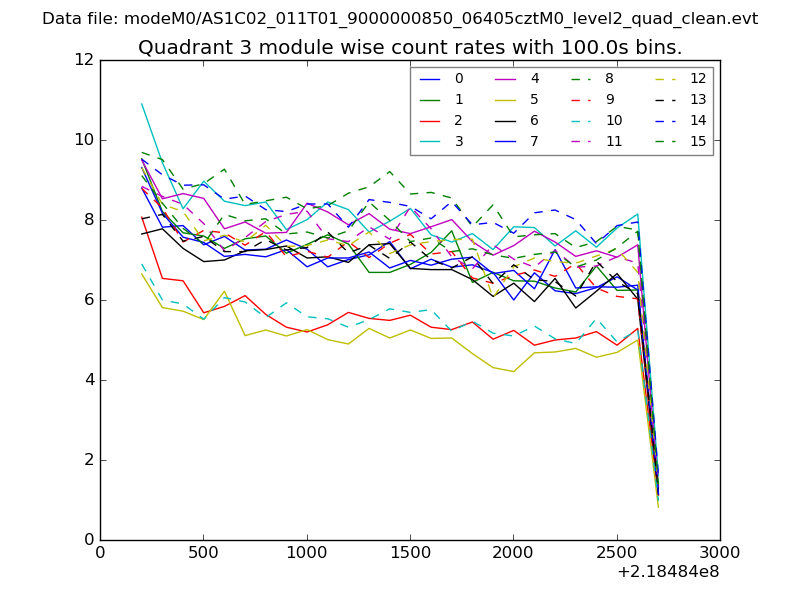
| Module-wise count rates for Quadrant C Data is divided into 100 sec bins |
 |
 |
| Module-wise count rates for Quadrant D Data is divided into 100 sec bins |
 |
 |
| Parameter | Plot |
|---|---|
| CZT HV Monitor | 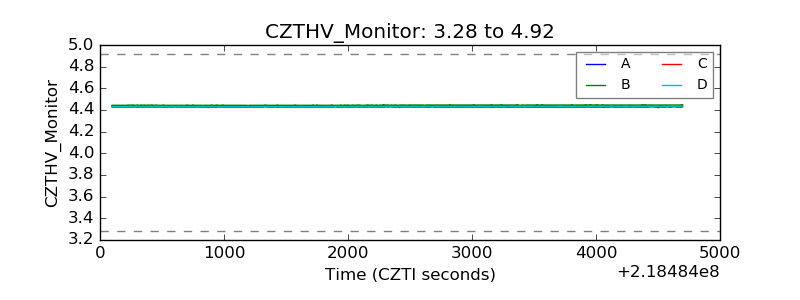 |
| D_VDD | 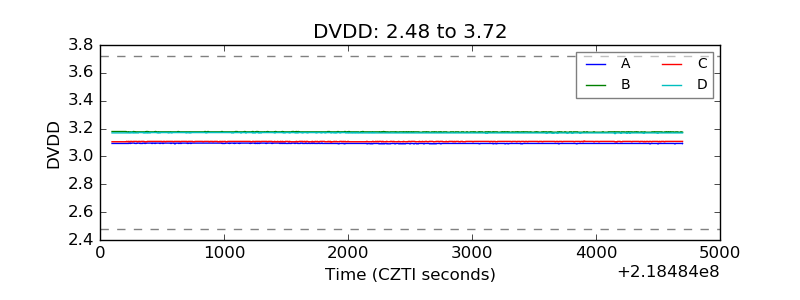 |
| Temperature 1 | 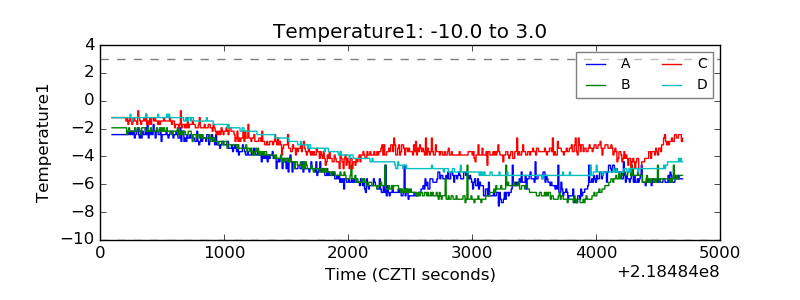 |
| Veto HV Monitor | 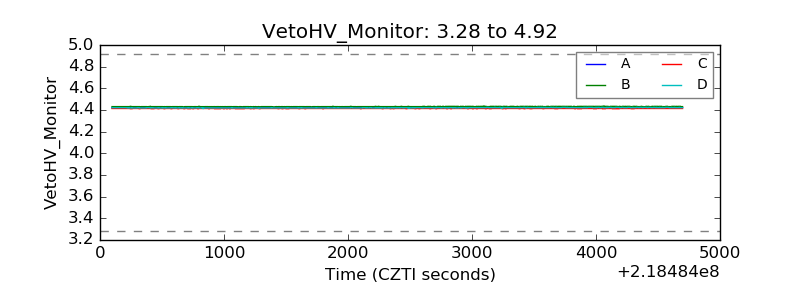 |
| Veto LLD | 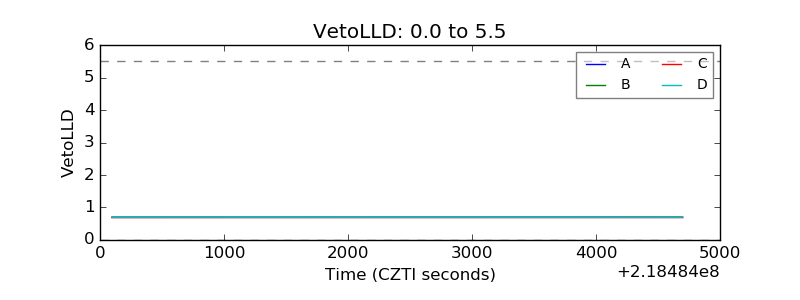 |
| Alpha Counter | 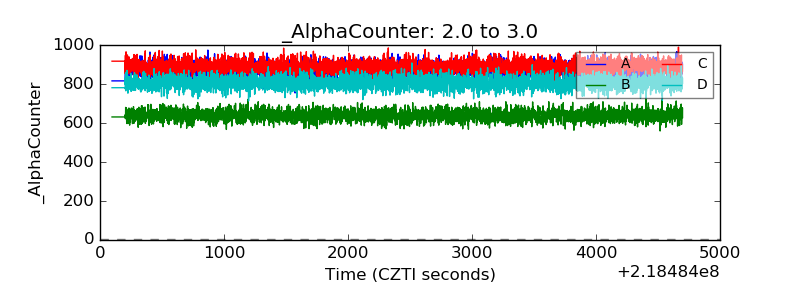 |
| _CPM_Rate | 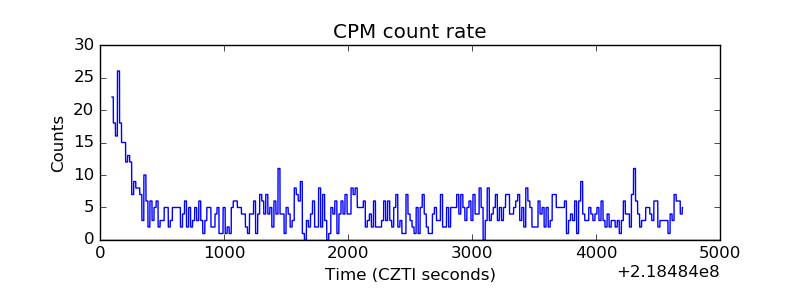 |
| CZT Counter | 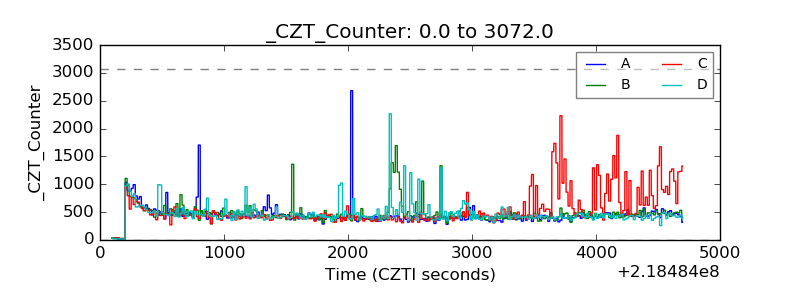 |
| +2.5 Volts monitor |  |
| +5 Volts monitor |  |
| _ROLL_ROT | 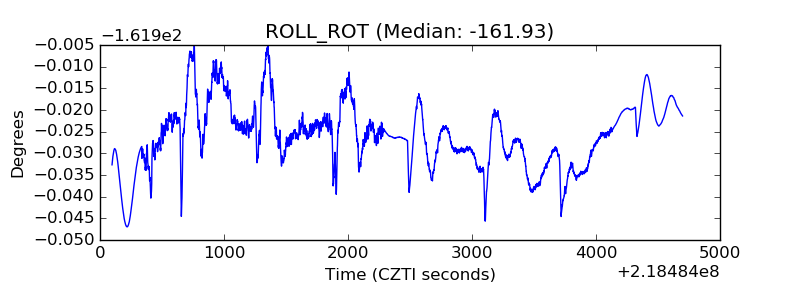 |
| _Roll_DEC | 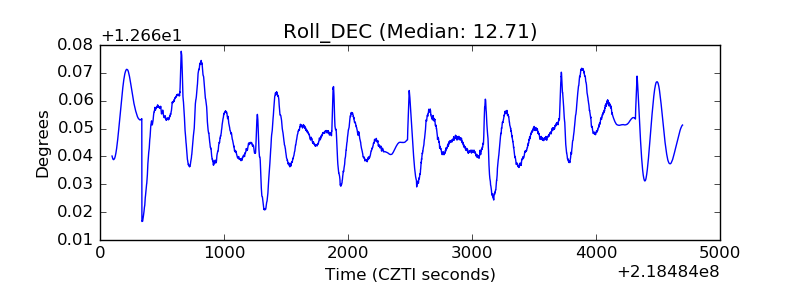 |
| _Roll_RA | 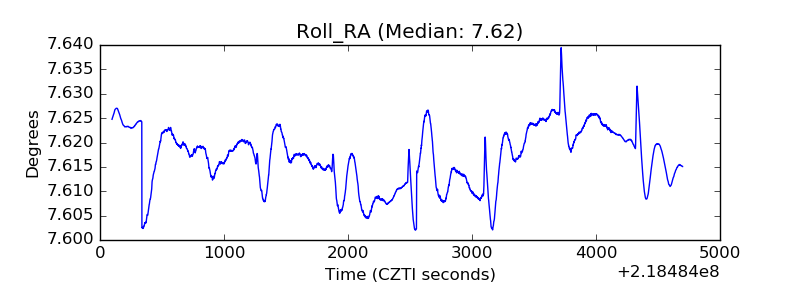 |
| Veto Counter | 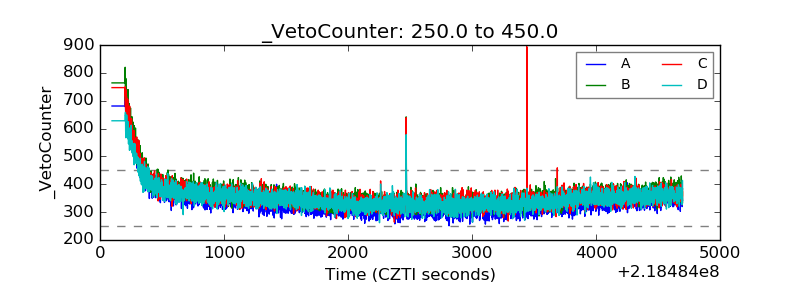 |