| Param | Original file | Final file |
|---|---|---|
| Filename | modeM0/AS1C02_011T01_9000000850_06412cztM0_level2.evt | modeM0/AS1C02_011T01_9000000850_06412cztM0_level2_quad_clean.evt |
| Size (bytes) | 443,586,240 | 72,846,720 |
| Size | 423.0 MB | 69.5 MB |
| Events in quadrant A | 3,278,753 | 441,138 |
| Events in quadrant B | 3,359,949 | 452,049 |
| Events in quadrant C | 3,129,896 | 445,803 |
| Events in quadrant D | 3,237,225 | 427,028 |
| Mode SS | |||
|---|---|---|---|
| Quadrant | BADHDUFLAG | Total packets | Discarded packets |
| A | 0 | 128 | 0 |
| B | 0 | 128 | 0 |
| C | 0 | 128 | 0 |
| D | 0 | 128 | 0 |
| Mode M0 | |||
|---|---|---|---|
| Quadrant | BADHDUFLAG | Total packets | Discarded packets |
| A | 0 | 13457 | 3 |
| B | 0 | 13749 | 2 |
| C | 0 | 13194 | 2 |
| D | 0 | 13539 | 2 |
| Mode M9 | |||
|---|---|---|---|
| Quadrant | BADHDUFLAG | Total packets | Discarded packets |
| A | 0 | 15 | 0 |
| B | 0 | 15 | 0 |
| C | 0 | 15 | 0 |
| D | 0 | 16 | 0 |
| Quadrant | Total seconds | Saturated seconds | Saturation percentage |
|---|---|---|---|
| A | 6300 | 59 | 0.936508% |
| B | 6300 | 93 | 1.476190% |
| C | 6300 | 29 | 0.460317% |
| D | 6300 | 51 | 0.809524% |
Noise dominated data is calculated using 1-second bins in cleaned event files. If a bin has >2000 counts, and if more than 50% of those come from <1% of pixels, then it is considered to be noise-dominated and hence unusable.
| Quadrant | # 1 sec bins | Bins with >0 counts | Bins with >2000 counts | High rate bins dominated by noise | Noise dominated (total time) | Noise dominated (detector-on time) | Marked lightcurve |
|---|---|---|---|---|---|---|---|
| A | 7615 | 6301 | 0 | 0 | 0.00% | 0.00% | 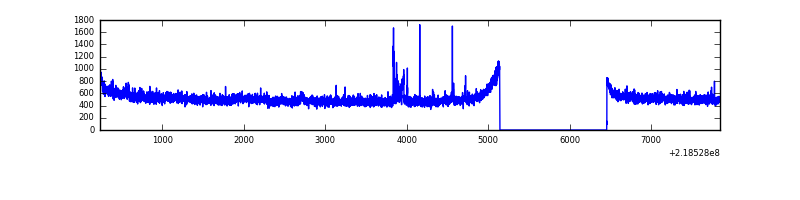 |
| B | 7615 | 6301 | 12 | 12 | 0.16% | 0.19% | 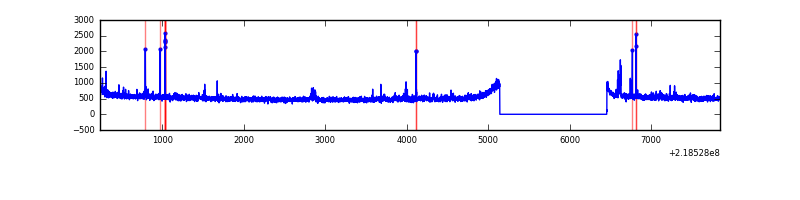 |
| C | 7615 | 6301 | 0 | 0 | 0.00% | 0.00% | 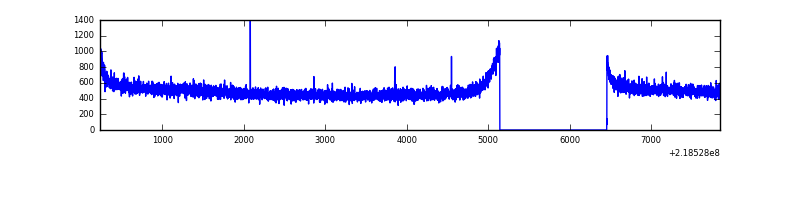 |
| D | 7615 | 6301 | 7 | 7 | 0.09% | 0.11% | 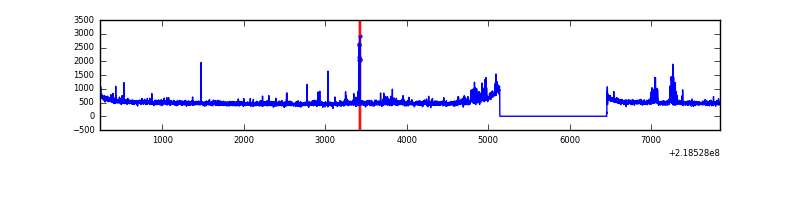 |
Top three noisy pixels from each quadrant. If the there are fewer than three noisy pixels in the level2.evt file, extra rows are filled as -1
| Pixel properties | Quadrant properties | ||||||
|---|---|---|---|---|---|---|---|
| Quadrant | DetID | PixID | Counts | Sigma | Mean | Median | Sigma |
| A | 15 | 236 | 47501 | 280.22 | 823 | 807 | 166.6 |
| A | 15 | 174 | 42902 | 252.62 | 823 | 807 | 166.6 |
| A | 8 | 15 | 12417 | 69.67 | 823 | 807 | 166.6 |
| B | 15 | 204 | 36218 | 224.16 | 831 | 815 | 157.9 |
| B | 0 | 229 | 32969 | 203.59 | 831 | 815 | 157.9 |
| B | 0 | 219 | 29499 | 181.62 | 831 | 815 | 157.9 |
| C | 1 | 16 | 19112 | 99.34 | 797 | 804 | 184.3 |
| C | 13 | 61 | 6410 | 30.42 | 797 | 804 | 184.3 |
| C | 8 | 222 | 2396 | 8.64 | 797 | 804 | 184.3 |
| D | 11 | 241 | 73089 | 373.62 | 795 | 771 | 193.6 |
| D | 2 | 152 | 57989 | 295.61 | 795 | 771 | 193.6 |
| D | 2 | 136 | 47314 | 240.46 | 795 | 771 | 193.6 |
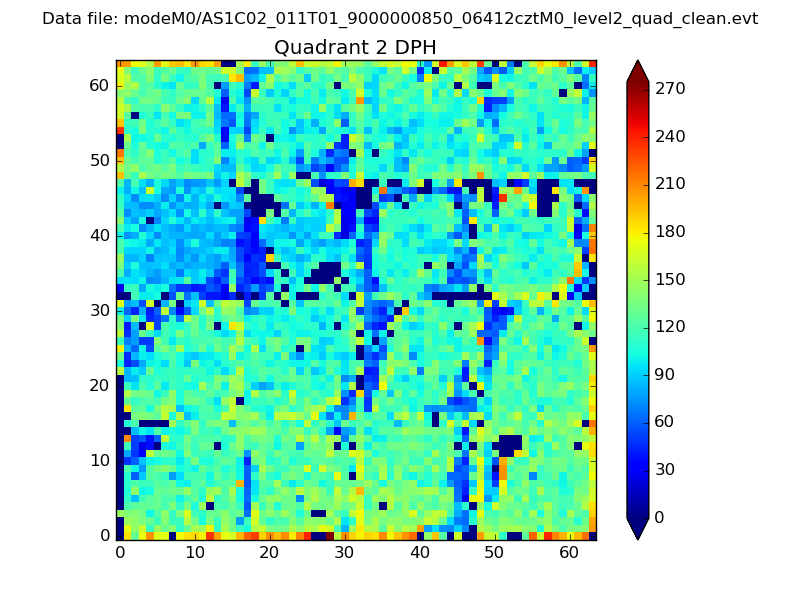
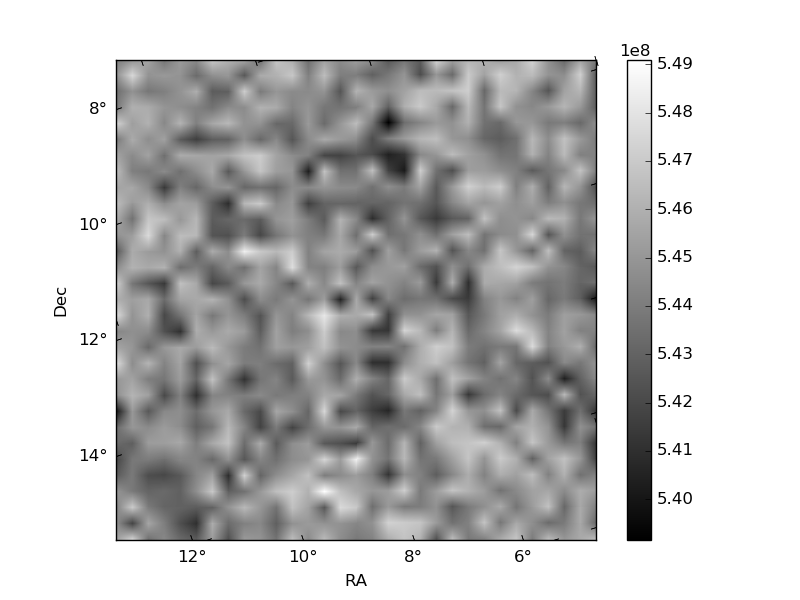
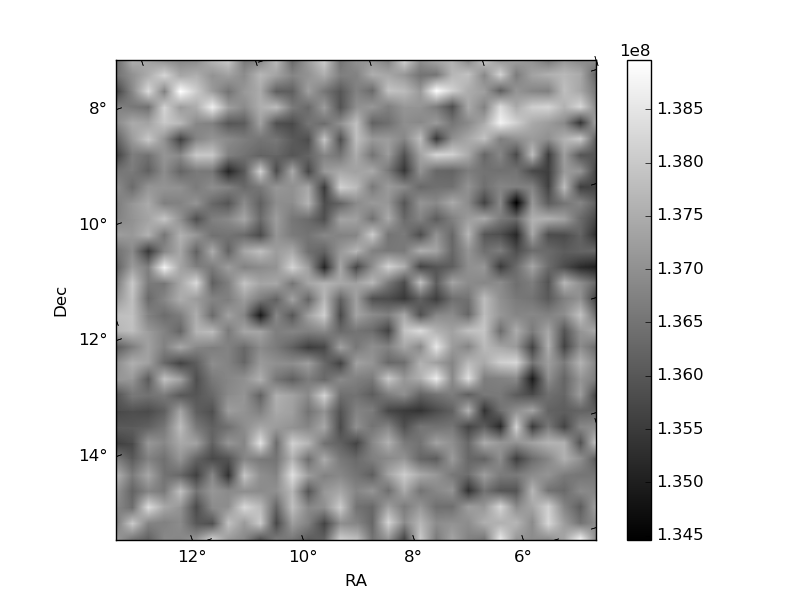
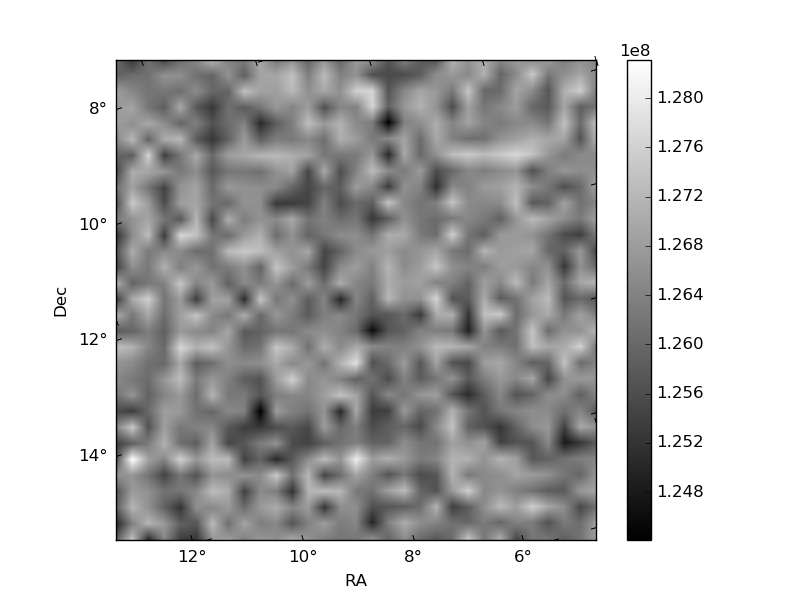
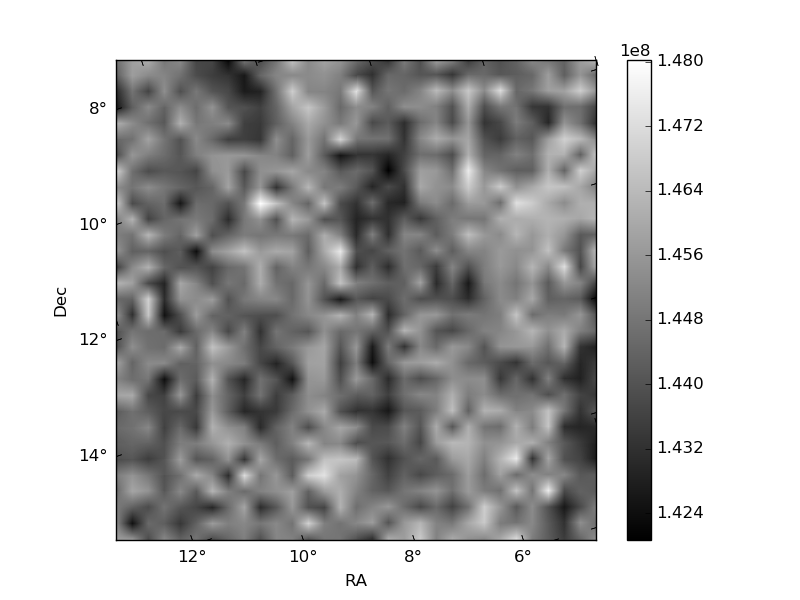
Histogram calculated using DETX and DETY for each event in the final _common_clean file
| Quadrant A | 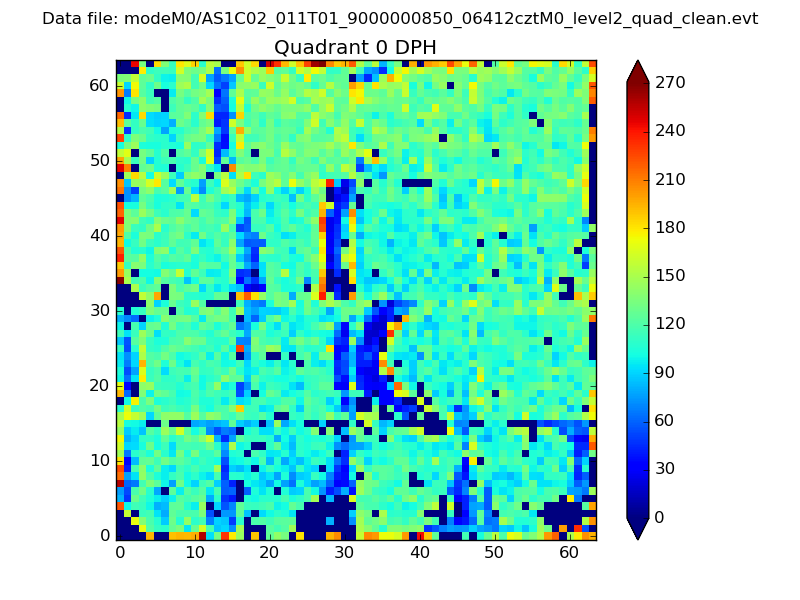 |
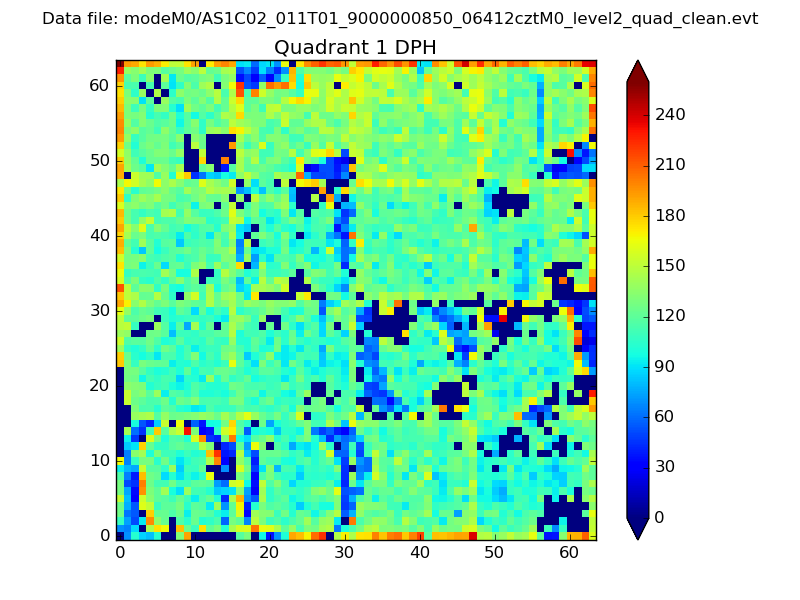 |
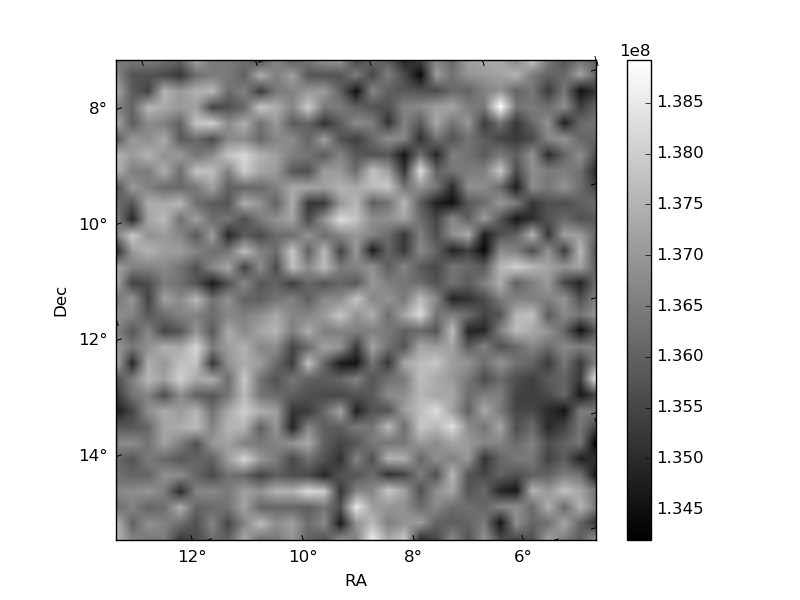
Quadrant B |
|---|---|---|---|
| Quadrant D | 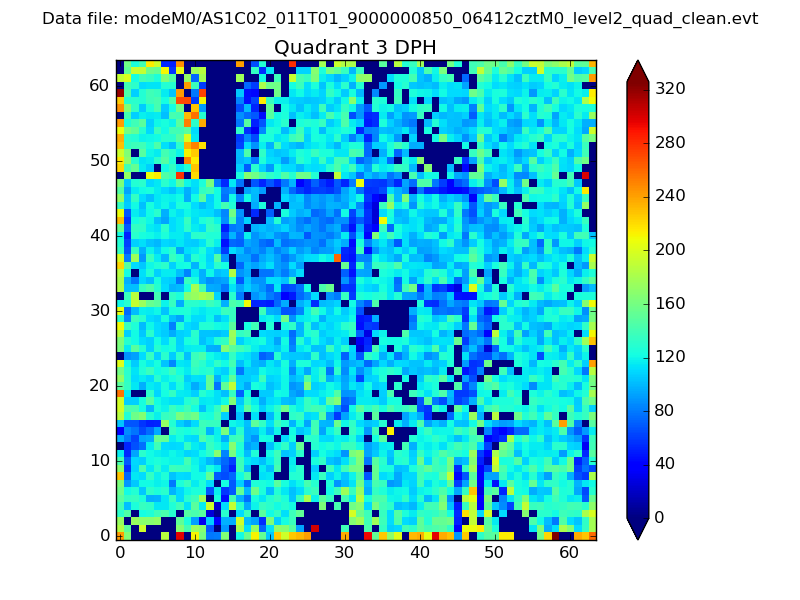 |
 |
Quadrant C |
| Plot type | Count rate plots | Images |
|---|---|---|
| Comparison with Poisson distribution Blue bars denote a histogram of data divided into 1 sec bins. Red curve is a Poisson curve with rate = median count rate of data. |
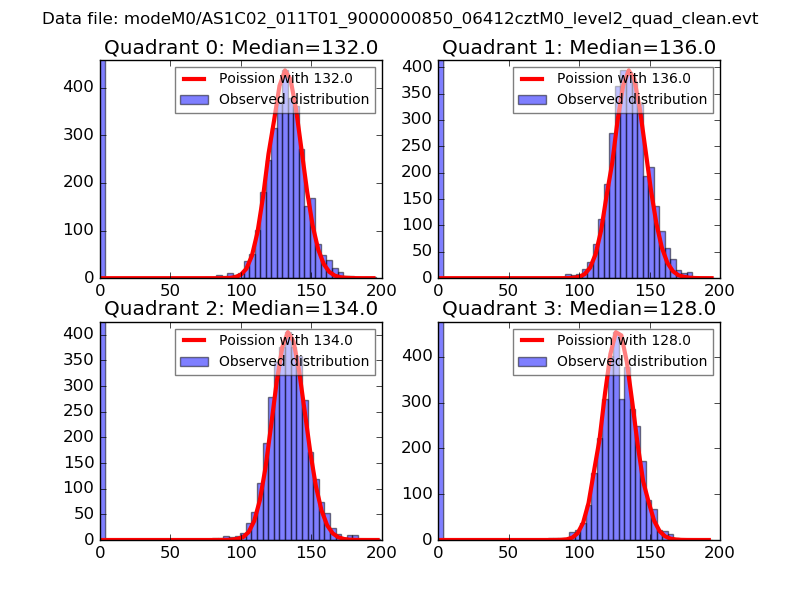 |
 |
| Quadrant-wise count rates Data is divided into 100 sec bins |
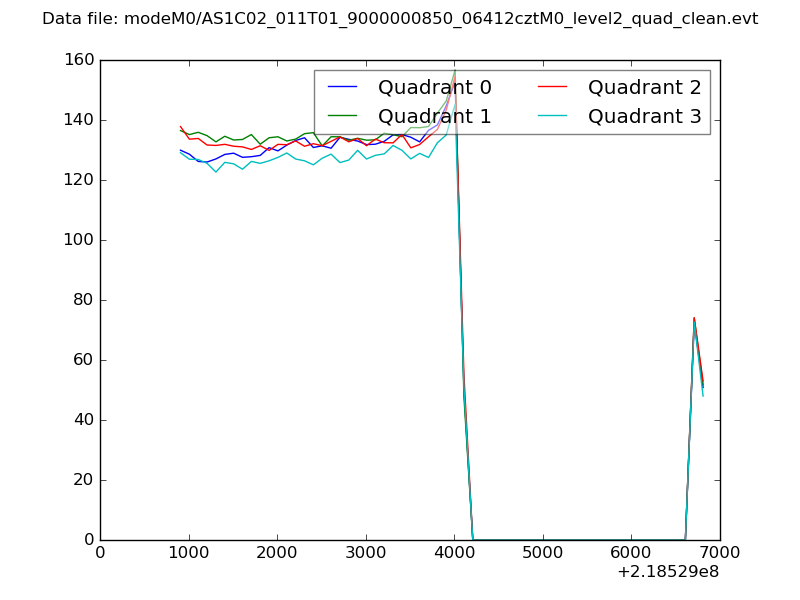 |
|
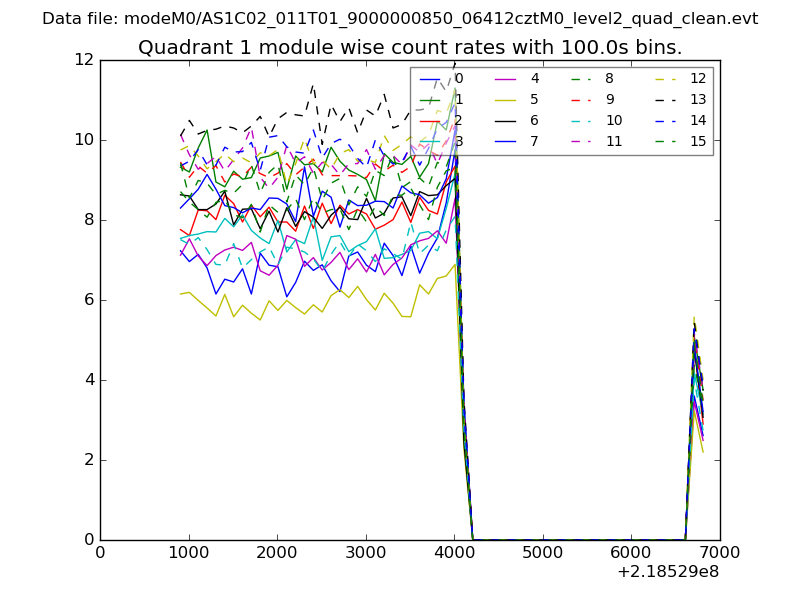
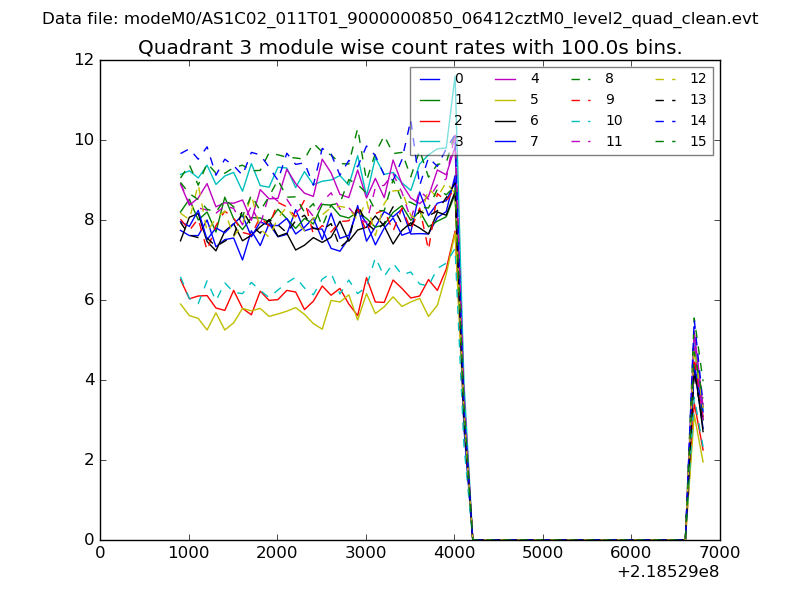
| Module-wise count rates for Quadrant A Data is divided into 100 sec bins |
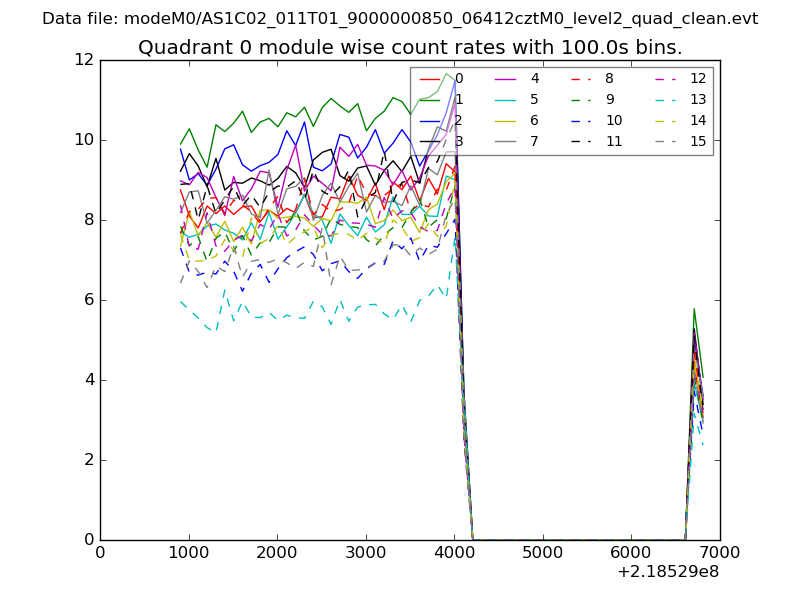 |
 |
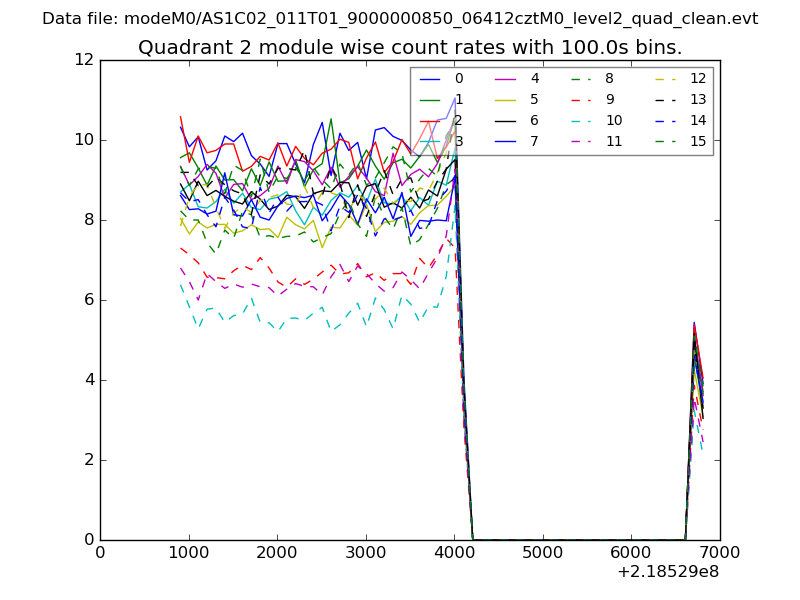
| Module-wise count rates for Quadrant B Data is divided into 100 sec bins |
 |
 |
| Module-wise count rates for Quadrant C Data is divided into 100 sec bins |
 |
 |
| Module-wise count rates for Quadrant D Data is divided into 100 sec bins |
 |
 |
| Parameter | Plot |
|---|---|
| CZT HV Monitor | 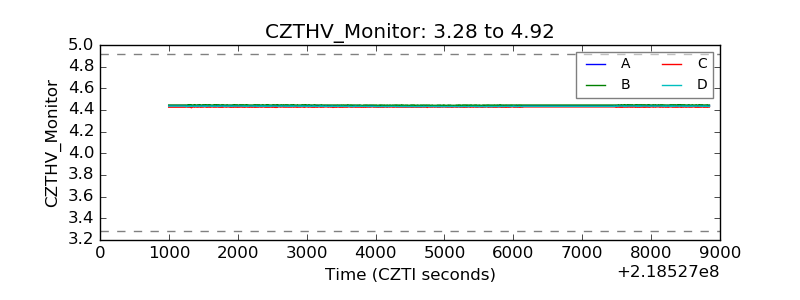 |
| D_VDD | 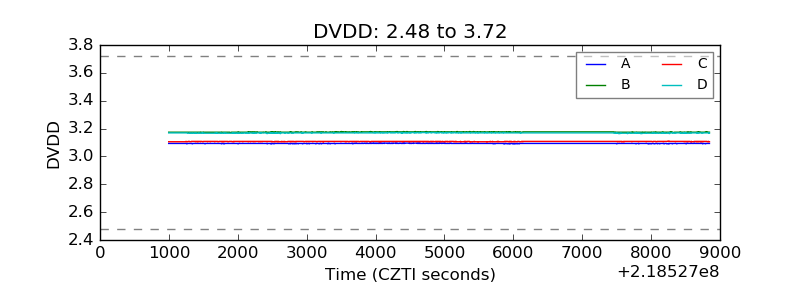 |
| Temperature 1 | 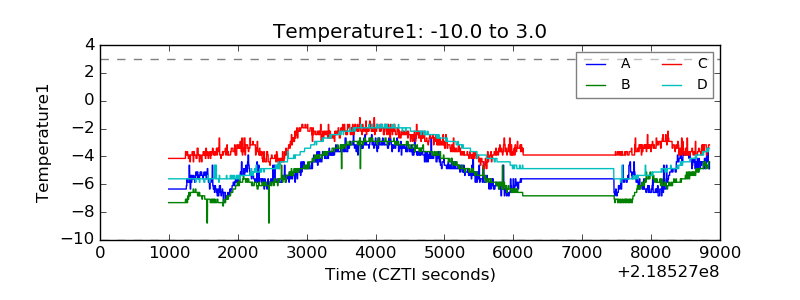 |
| Veto HV Monitor | 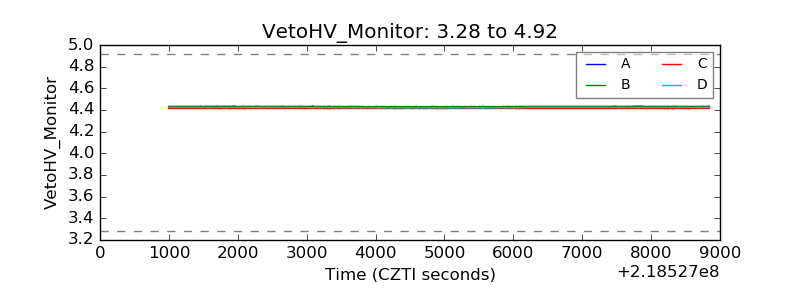 |
| Veto LLD | 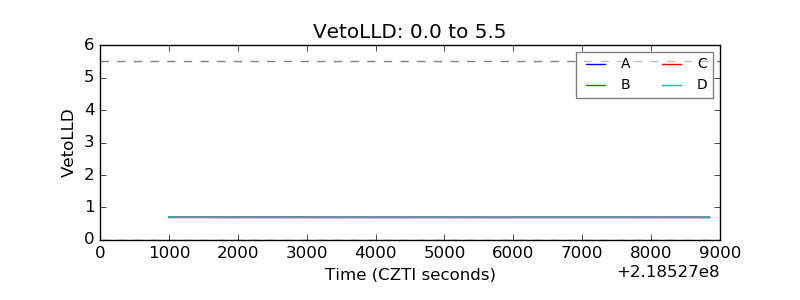 |
| Alpha Counter | 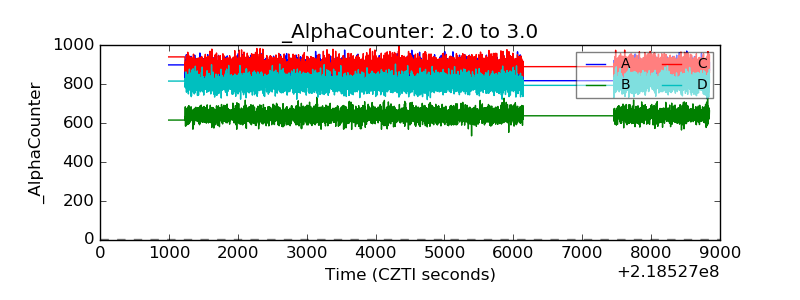 |
| _CPM_Rate | 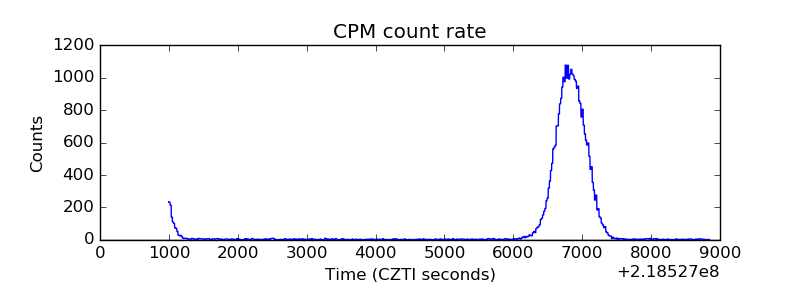 |
| CZT Counter | 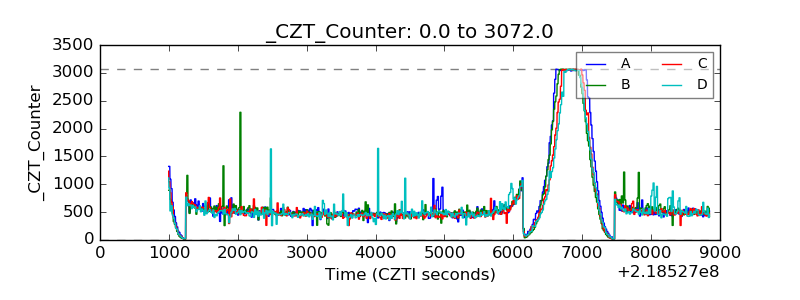 |
| +2.5 Volts monitor | 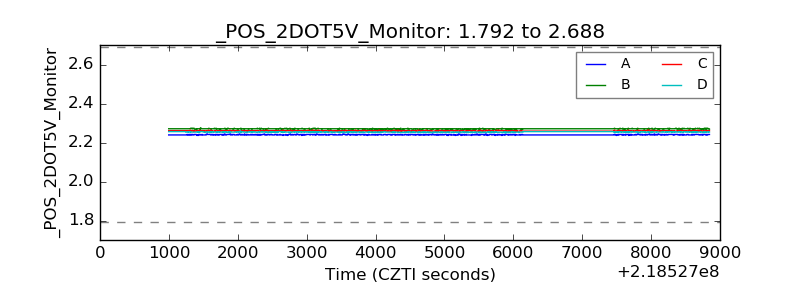 |
| +5 Volts monitor |  |
| _ROLL_ROT | 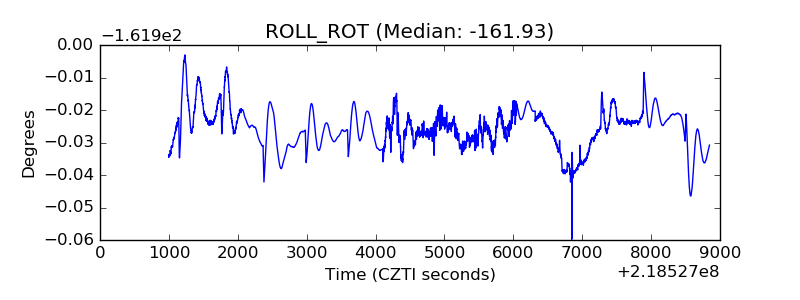 |
| _Roll_DEC | 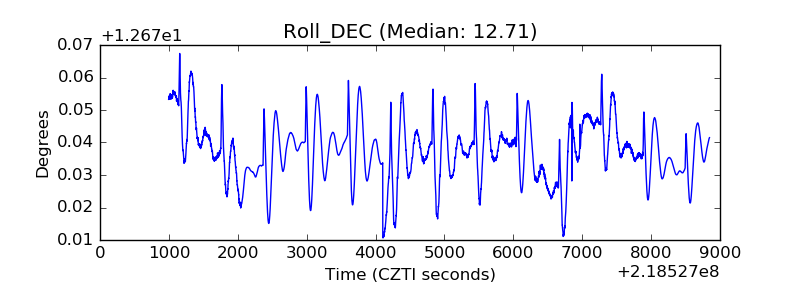 |
| _Roll_RA | 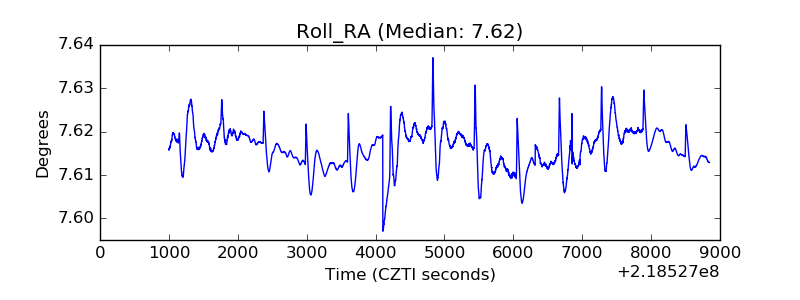 |
| Veto Counter | 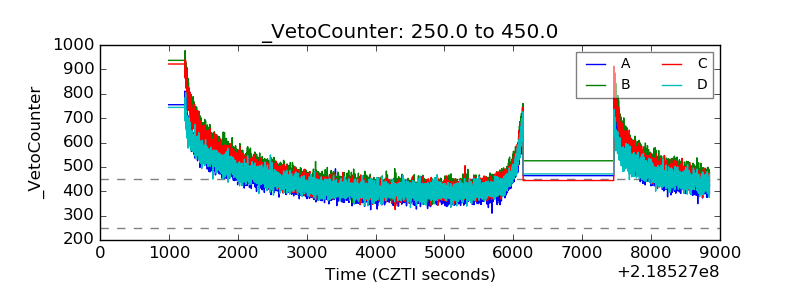 |