| Param | Original file | Final file |
|---|---|---|
| Filename | modeM0/AS1C02_011T01_9000000850_06413cztM0_level2.evt | modeM0/AS1C02_011T01_9000000850_06413cztM0_level2_quad_clean.evt |
| Size (bytes) | 446,469,120 | 82,964,160 |
| Size | 425.8 MB | 79.1 MB |
| Events in quadrant A | 3,281,069 | 518,025 |
| Events in quadrant B | 3,375,819 | 529,321 |
| Events in quadrant C | 3,120,202 | 519,808 |
| Events in quadrant D | 3,307,812 | 497,293 |
| Mode SS | |||
|---|---|---|---|
| Quadrant | BADHDUFLAG | Total packets | Discarded packets |
| A | 0 | 130 | 0 |
| B | 0 | 130 | 0 |
| C | 0 | 130 | 0 |
| D | 0 | 130 | 0 |
| Mode M0 | |||
|---|---|---|---|
| Quadrant | BADHDUFLAG | Total packets | Discarded packets |
| A | 0 | 13638 | 3 |
| B | 0 | 13946 | 2 |
| C | 0 | 13404 | 2 |
| D | 0 | 13893 | 2 |
| Mode M9 | |||
|---|---|---|---|
| Quadrant | BADHDUFLAG | Total packets | Discarded packets |
| A | 0 | 23 | 0 |
| B | 0 | 23 | 0 |
| C | 0 | 23 | 0 |
| D | 0 | 24 | 0 |
| Quadrant | Total seconds | Saturated seconds | Saturation percentage |
|---|---|---|---|
| A | 6419 | 144 | 2.243340% |
| B | 6419 | 154 | 2.399128% |
| C | 6419 | 91 | 1.417666% |
| D | 6419 | 109 | 1.698084% |
Noise dominated data is calculated using 1-second bins in cleaned event files. If a bin has >2000 counts, and if more than 50% of those come from <1% of pixels, then it is considered to be noise-dominated and hence unusable.
| Quadrant | # 1 sec bins | Bins with >0 counts | Bins with >2000 counts | High rate bins dominated by noise | Noise dominated (total time) | Noise dominated (detector-on time) | Marked lightcurve |
|---|---|---|---|---|---|---|---|
| A | 7579 | 6420 | 3 | 3 | 0.04% | 0.05% | 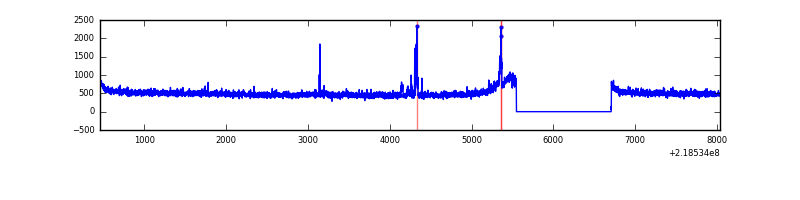 |
| B | 7579 | 6420 | 3 | 3 | 0.04% | 0.05% | 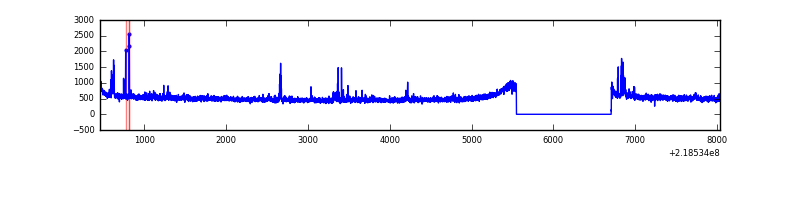 |
| C | 7579 | 6420 | 0 | 0 | 0.00% | 0.00% | 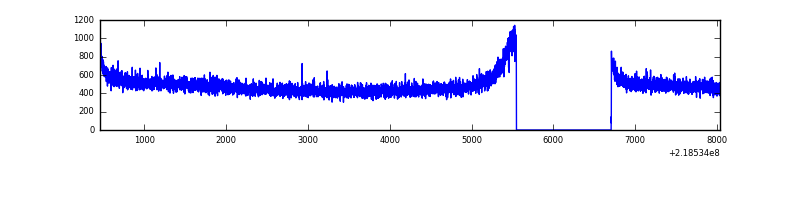 |
| D | 7579 | 6420 | 3 | 3 | 0.04% | 0.05% | 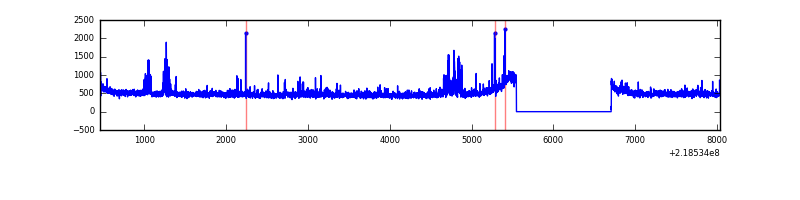 |
Top three noisy pixels from each quadrant. If the there are fewer than three noisy pixels in the level2.evt file, extra rows are filled as -1
| Pixel properties | Quadrant properties | ||||||
|---|---|---|---|---|---|---|---|
| Quadrant | DetID | PixID | Counts | Sigma | Mean | Median | Sigma |
| A | 15 | 174 | 80977 | 481.32 | 822 | 806 | 166.6 |
| A | 15 | 236 | 17953 | 102.95 | 822 | 806 | 166.6 |
| A | 8 | 15 | 10054 | 55.52 | 822 | 806 | 166.6 |
| B | 4 | 81 | 46926 | 289.12 | 829 | 812 | 159.5 |
| B | 0 | 229 | 43508 | 267.69 | 829 | 812 | 159.5 |
| B | 15 | 204 | 28184 | 171.61 | 829 | 812 | 159.5 |
| C | 13 | 61 | 6256 | 29.31 | 798 | 804 | 186.0 |
| C | 1 | 16 | 5131 | 23.26 | 798 | 804 | 186.0 |
| C | 8 | 222 | 2059 | 6.75 | 798 | 804 | 186.0 |
| D | 11 | 241 | 94572 | 478.74 | 799 | 775 | 195.9 |
| D | 2 | 152 | 61219 | 308.51 | 799 | 775 | 195.9 |
| D | 2 | 136 | 47096 | 236.42 | 799 | 775 | 195.9 |
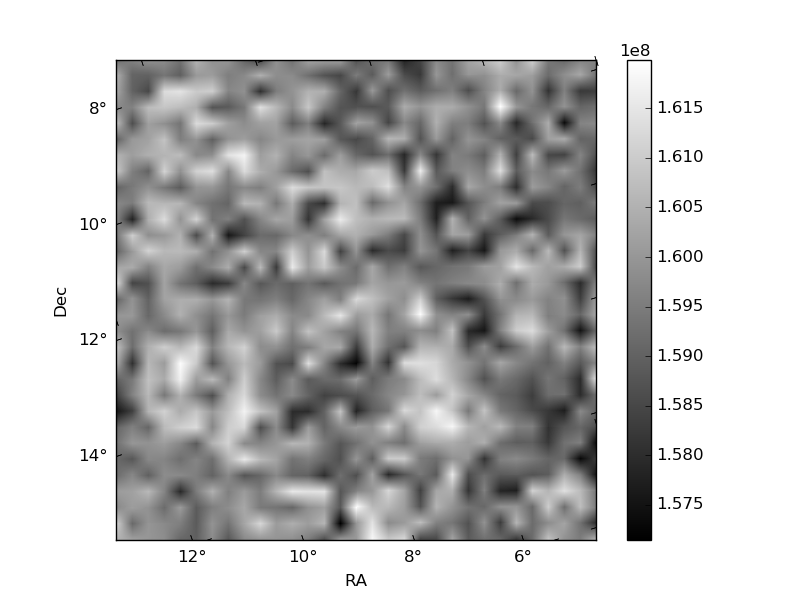
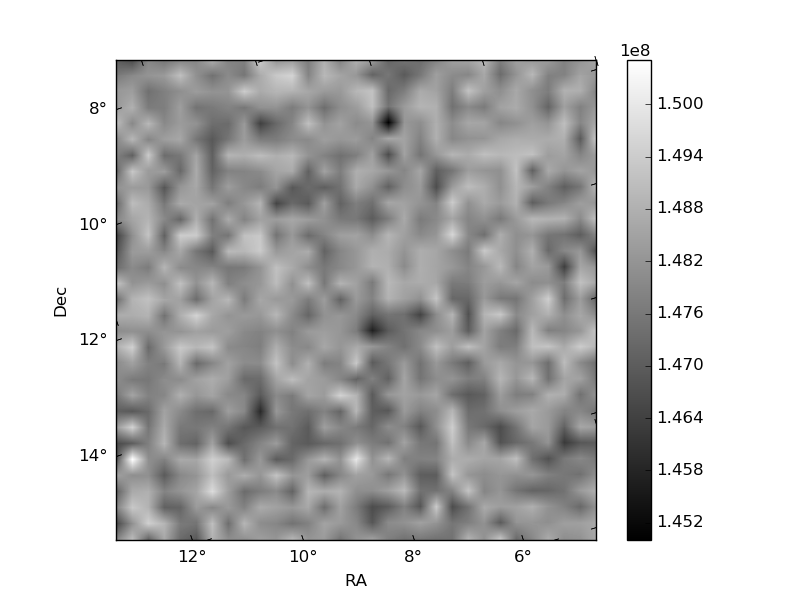
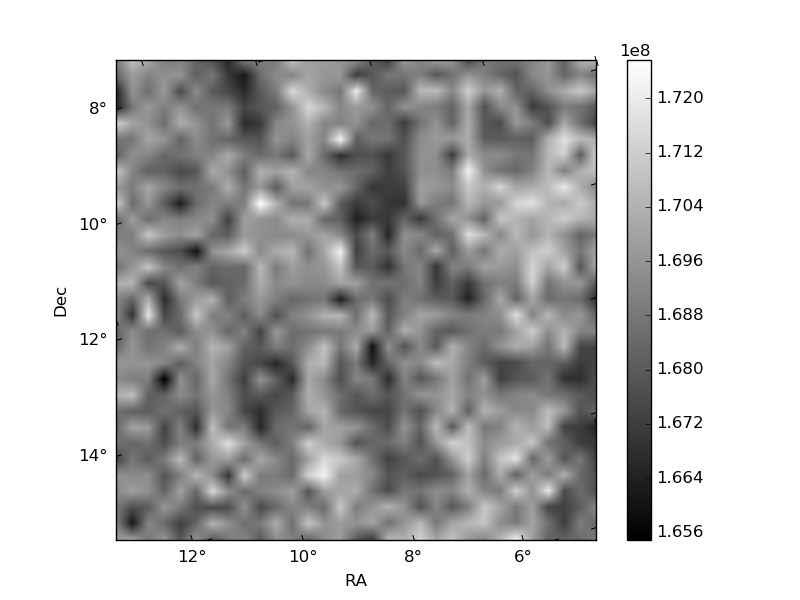
Histogram calculated using DETX and DETY for each event in the final _common_clean file
| Quadrant A | 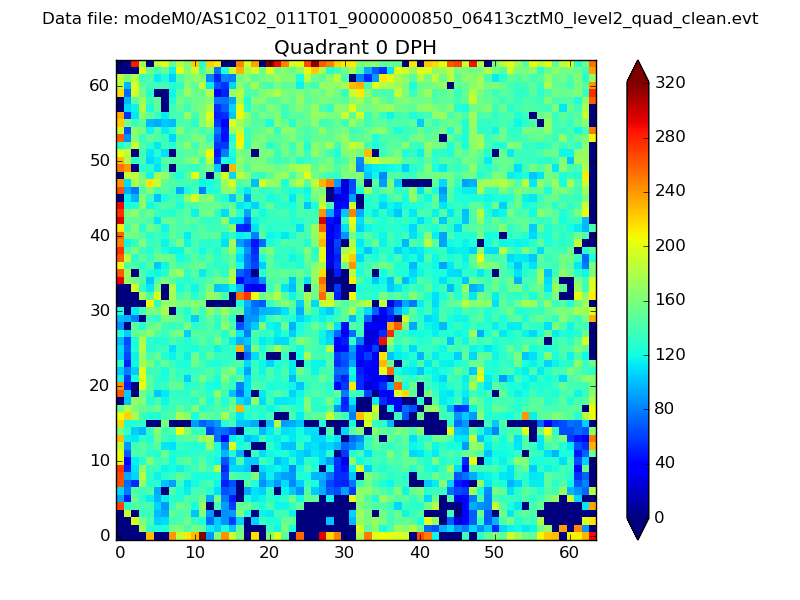 |
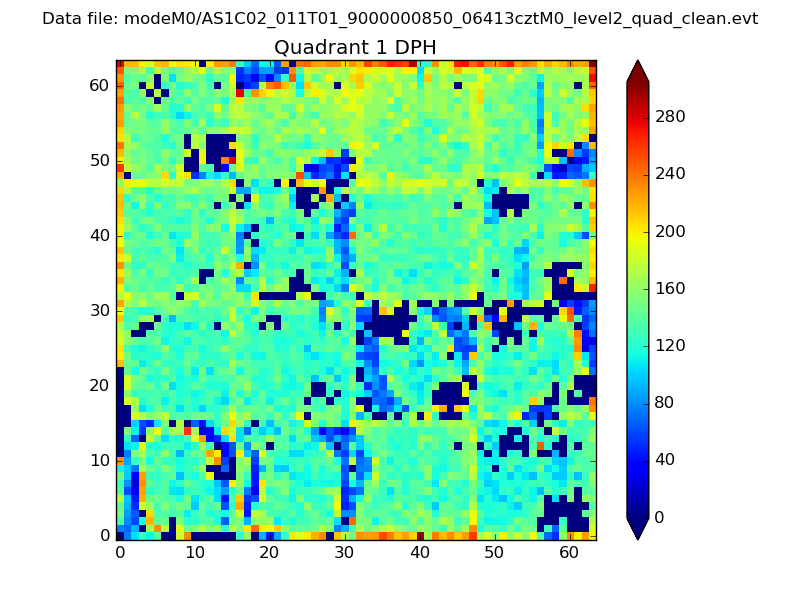 |
Quadrant B |
|---|---|---|---|
| Quadrant D | 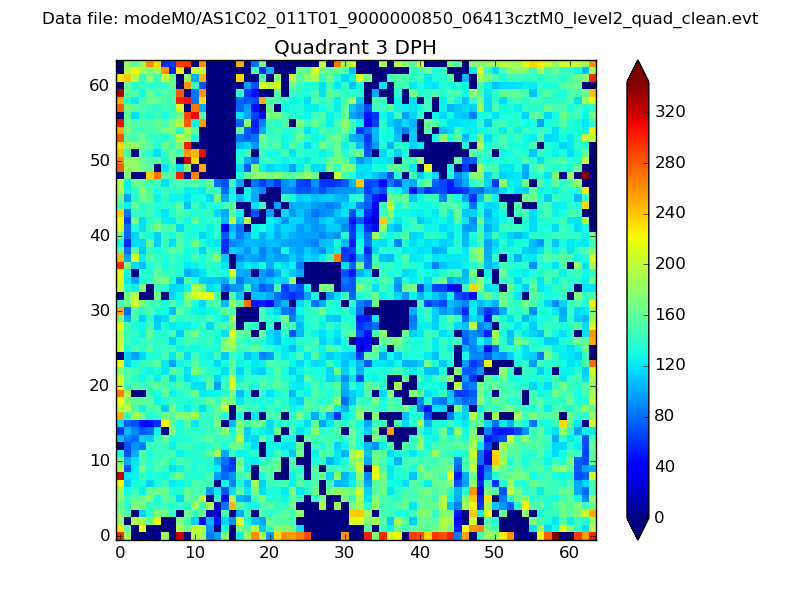 |
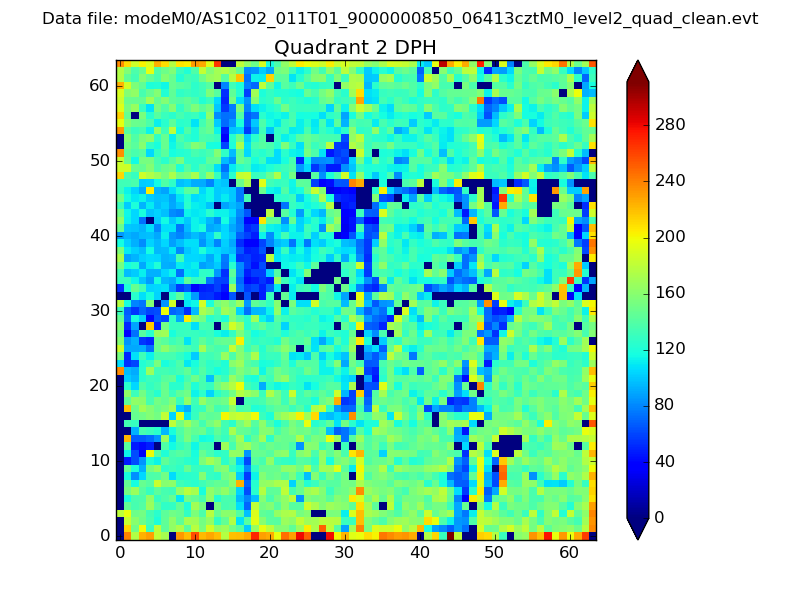 |
Quadrant C |
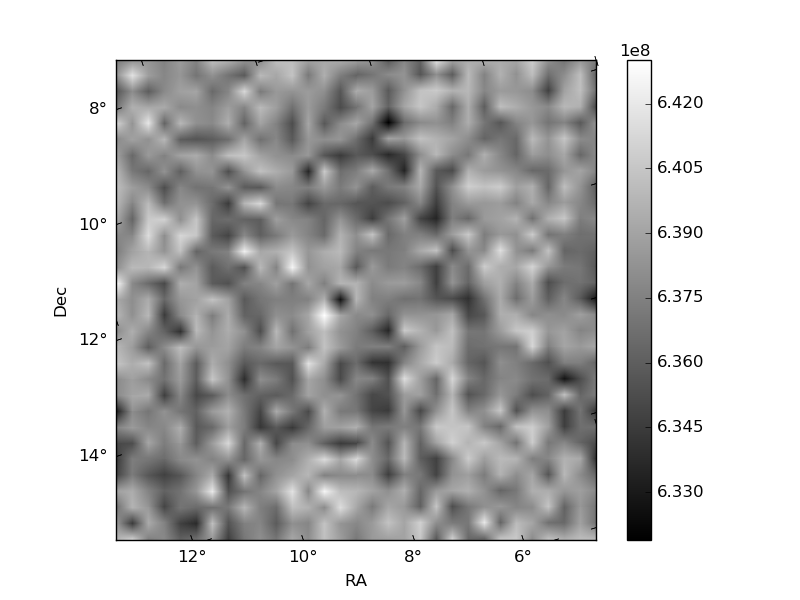
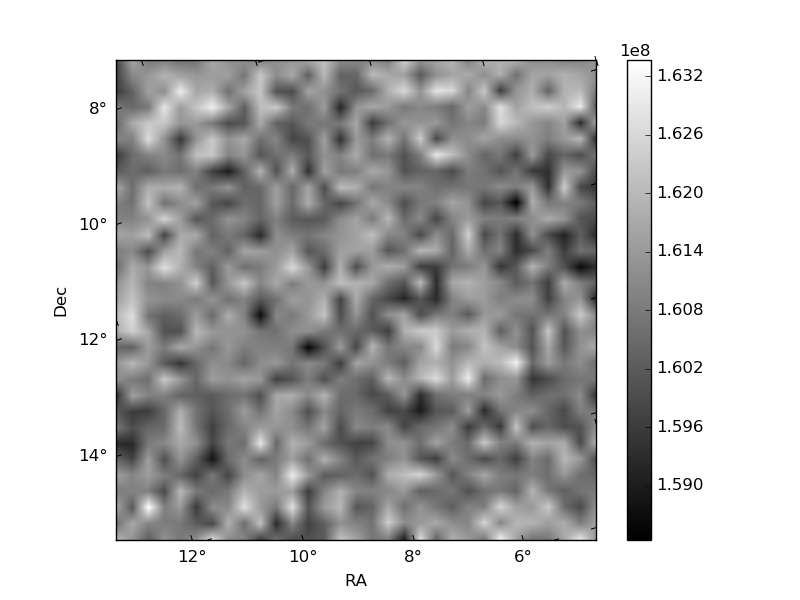
| Plot type | Count rate plots | Images |
|---|---|---|
| Comparison with Poisson distribution Blue bars denote a histogram of data divided into 1 sec bins. Red curve is a Poisson curve with rate = median count rate of data. |
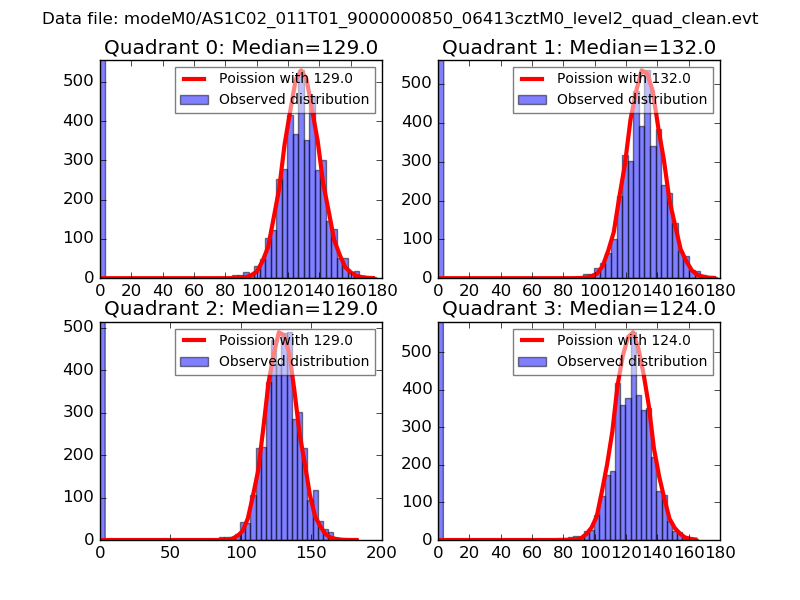 |
 |
| Quadrant-wise count rates Data is divided into 100 sec bins |
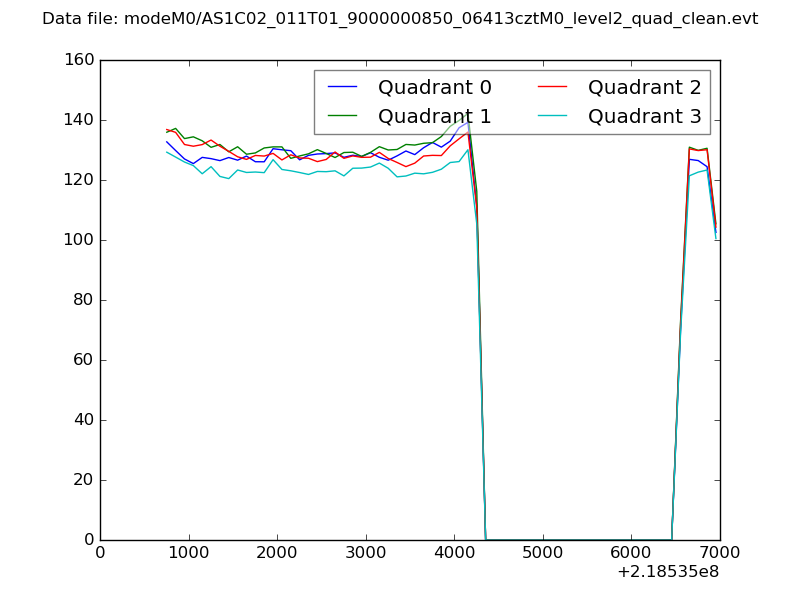 |
|
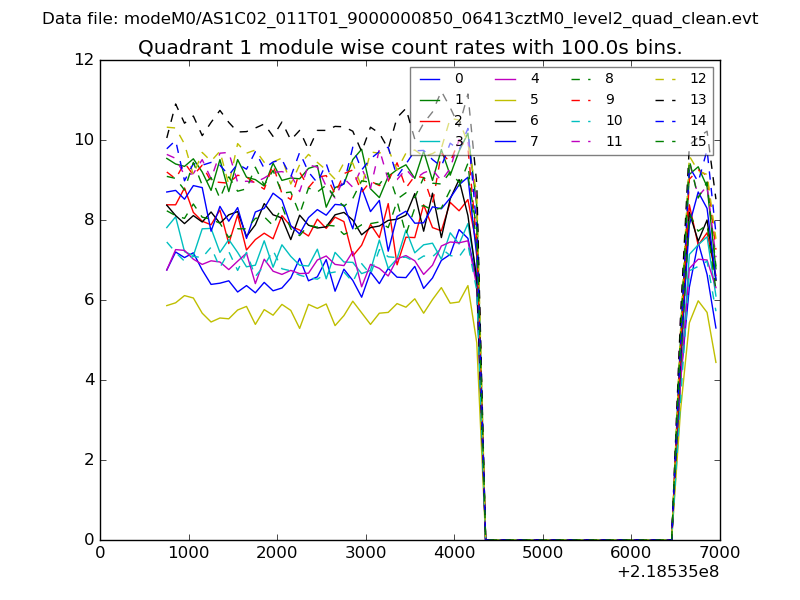
| Module-wise count rates for Quadrant A Data is divided into 100 sec bins |
 |
 |
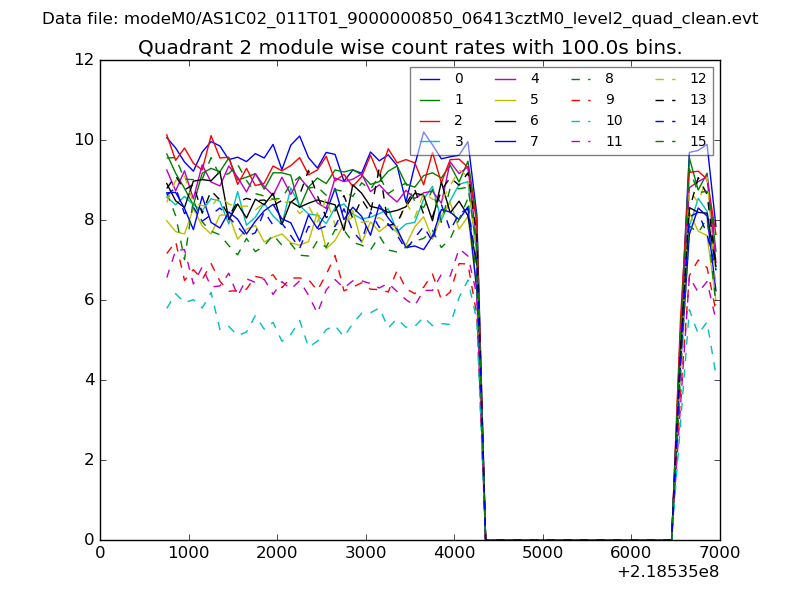
| Module-wise count rates for Quadrant B Data is divided into 100 sec bins |
 |
 |
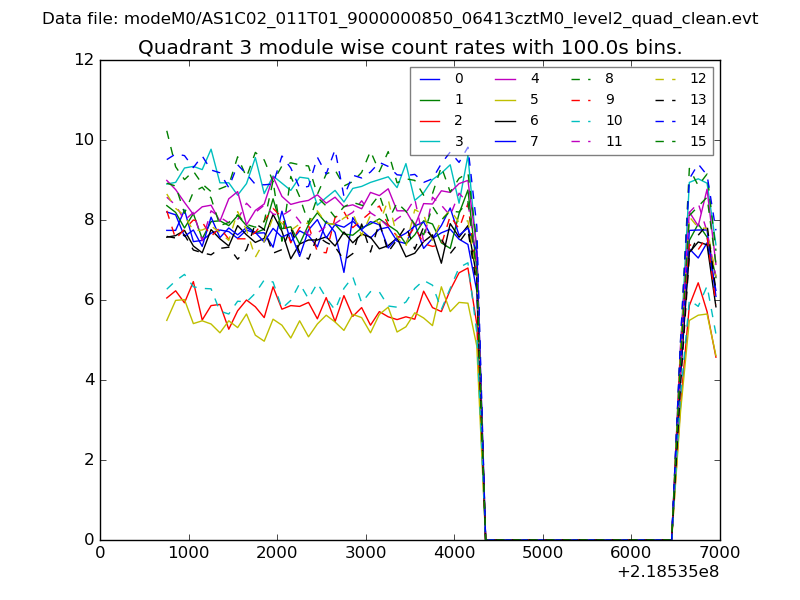
| Module-wise count rates for Quadrant C Data is divided into 100 sec bins |
 |
 |
| Module-wise count rates for Quadrant D Data is divided into 100 sec bins |
 |
 |
| Parameter | Plot |
|---|---|
| CZT HV Monitor | 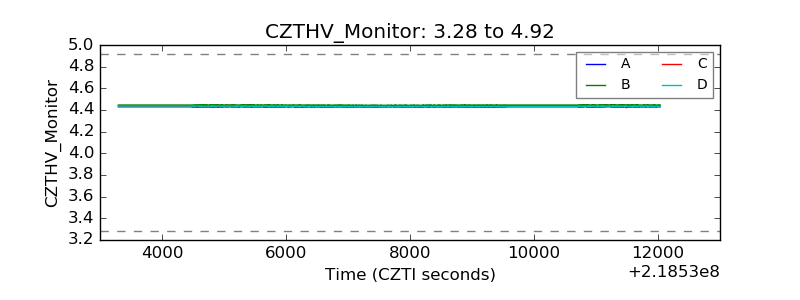 |
| D_VDD | 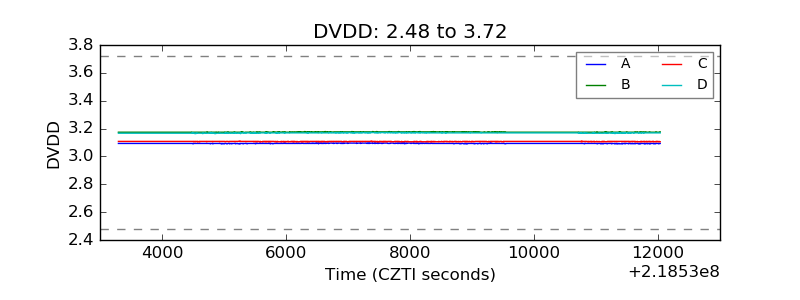 |
| Temperature 1 | 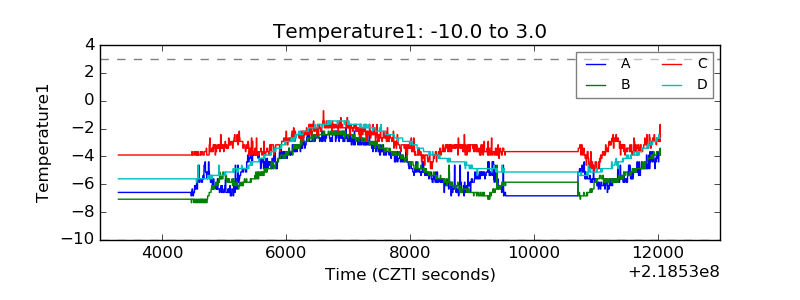 |
| Veto HV Monitor | 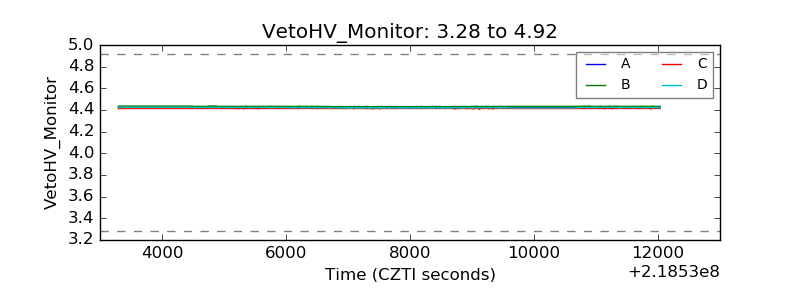 |
| Veto LLD | 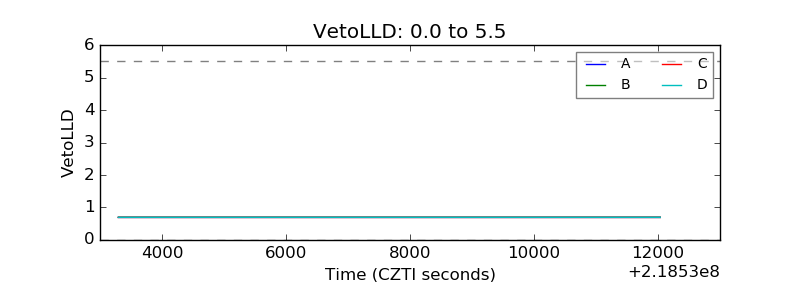 |
| Alpha Counter | 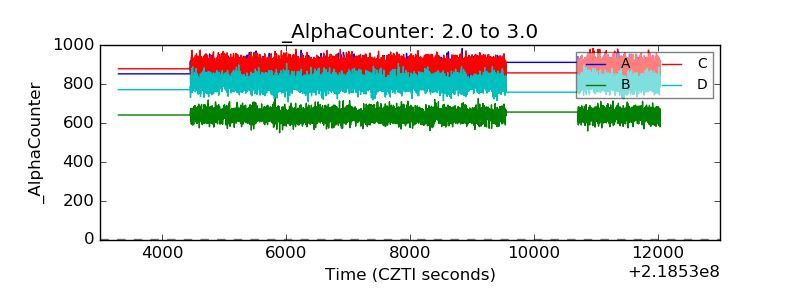 |
| _CPM_Rate | 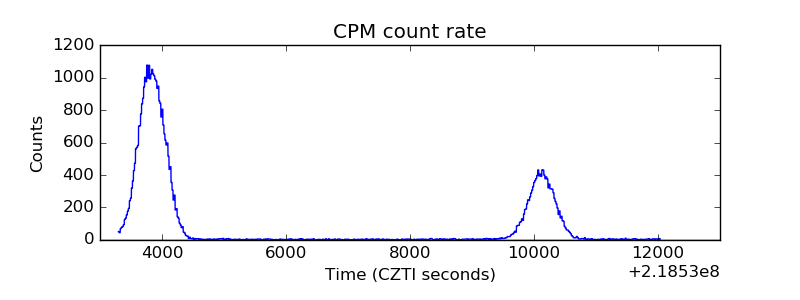 |
| CZT Counter | 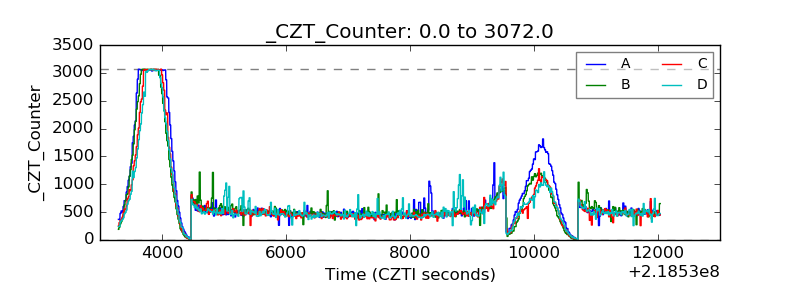 |
| +2.5 Volts monitor | 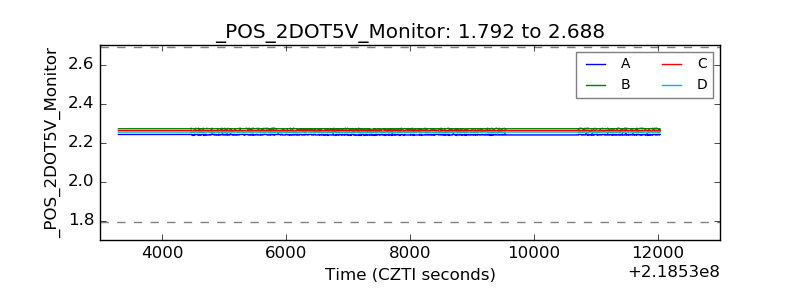 |
| +5 Volts monitor |  |
| _ROLL_ROT | 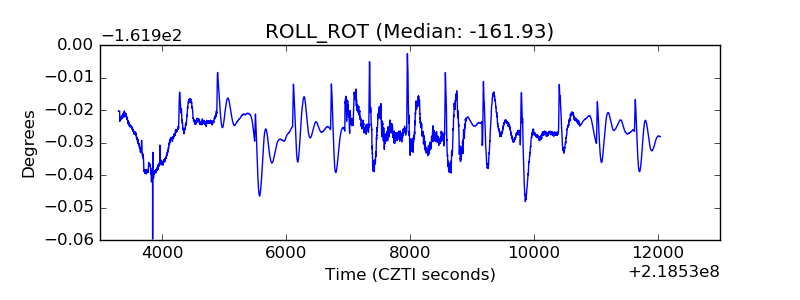 |
| _Roll_DEC | 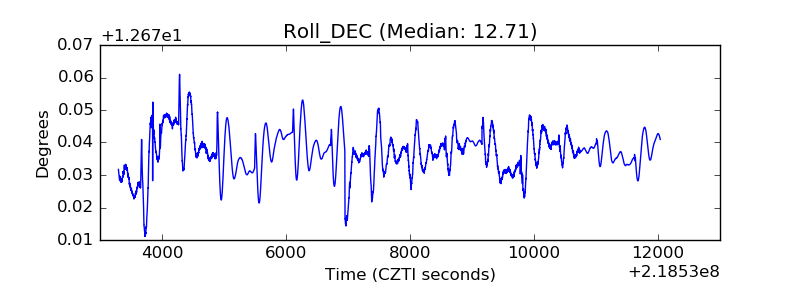 |
| _Roll_RA | 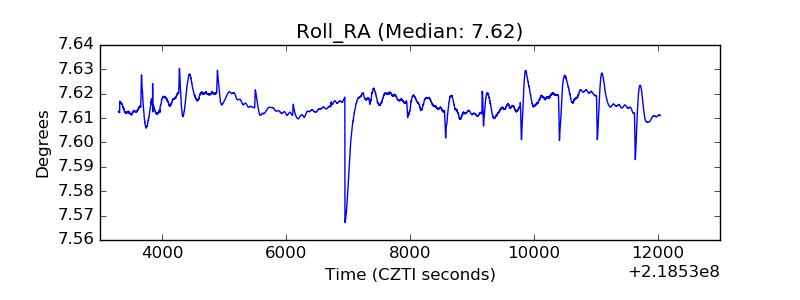 |
| Veto Counter | 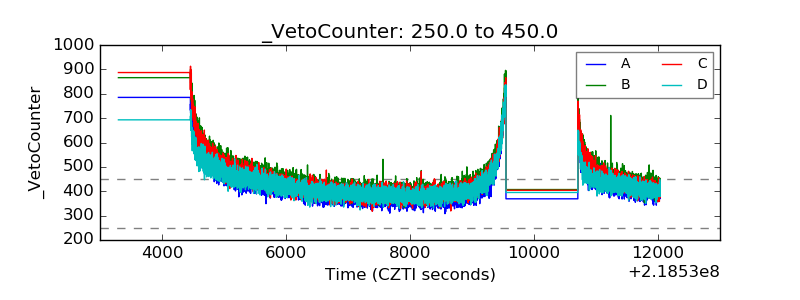 |