| Param | Original file | Final file |
|---|---|---|
| Filename | modeM0/AS1C02_011T01_9000000850_06415cztM0_level2.evt | modeM0/AS1C02_011T01_9000000850_06415cztM0_level2_quad_clean.evt |
| Size (bytes) | 546,088,320 | 86,348,160 |
| Size | 520.8 MB | 82.3 MB |
| Events in quadrant A | 3,069,264 | 559,318 |
| Events in quadrant B | 3,198,945 | 567,876 |
| Events in quadrant C | 2,966,316 | 564,785 |
| Events in quadrant D | 6,862,405 | 468,756 |
| Mode SS | |||
|---|---|---|---|
| Quadrant | BADHDUFLAG | Total packets | Discarded packets |
| A | 0 | 132 | 0 |
| B | 0 | 132 | 0 |
| C | 0 | 132 | 0 |
| D | 0 | 132 | 0 |
| Mode M0 | |||
|---|---|---|---|
| Quadrant | BADHDUFLAG | Total packets | Discarded packets |
| A | 0 | 13423 | 2 |
| B | 0 | 13672 | 1 |
| C | 0 | 13388 | 1 |
| D | 0 | 24660 | 1 |
| Mode M9 | |||
|---|---|---|---|
| Quadrant | BADHDUFLAG | Total packets | Discarded packets |
| A | 0 | 5 | 0 |
| B | 0 | 5 | 0 |
| C | 0 | 5 | 0 |
| D | 0 | 5 | 0 |
| Quadrant | Total seconds | Saturated seconds | Saturation percentage |
|---|---|---|---|
| A | 6510 | 113 | 1.735791% |
| B | 6510 | 117 | 1.797235% |
| C | 6510 | 51 | 0.783410% |
| D | 6510 | 1156 | 17.757296% |
Noise dominated data is calculated using 1-second bins in cleaned event files. If a bin has >2000 counts, and if more than 50% of those come from <1% of pixels, then it is considered to be noise-dominated and hence unusable.
| Quadrant | # 1 sec bins | Bins with >0 counts | Bins with >2000 counts | High rate bins dominated by noise | Noise dominated (total time) | Noise dominated (detector-on time) | Marked lightcurve |
|---|---|---|---|---|---|---|---|
| A | 6960 | 6512 | 0 | 0 | 0.00% | 0.00% | 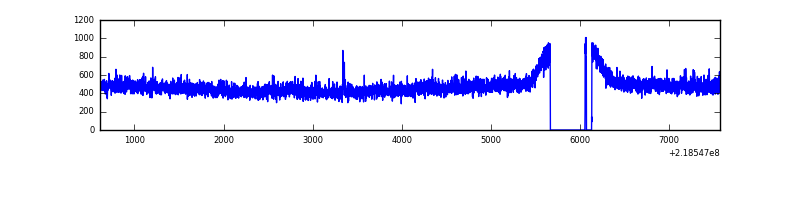 |
| B | 6960 | 6512 | 2 | 2 | 0.03% | 0.03% | 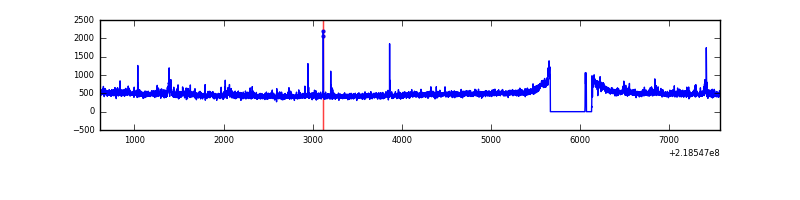 |
| C | 6960 | 6512 | 0 | 0 | 0.00% | 0.00% | 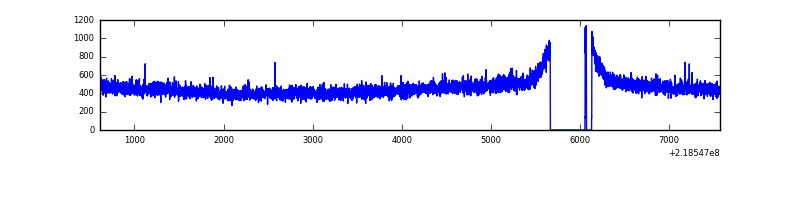 |
| D | 6960 | 6512 | 1119 | 1119 | 16.08% | 17.18% | 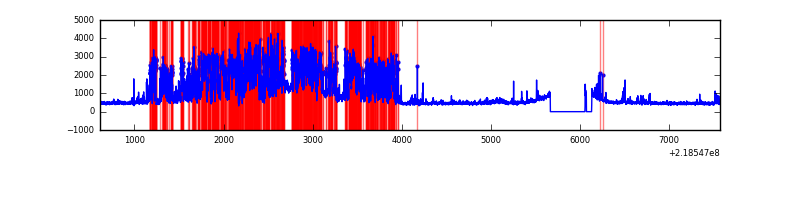 |
Top three noisy pixels from each quadrant. If the there are fewer than three noisy pixels in the level2.evt file, extra rows are filled as -1
| Pixel properties | Quadrant properties | ||||||
|---|---|---|---|---|---|---|---|
| Quadrant | DetID | PixID | Counts | Sigma | Mean | Median | Sigma |
| A | 15 | 236 | 30277 | 184.52 | 782 | 765 | 159.9 |
| A | 8 | 15 | 17520 | 104.76 | 782 | 765 | 159.9 |
| A | 0 | 226 | 7538 | 42.35 | 782 | 765 | 159.9 |
| B | 15 | 204 | 60620 | 392.55 | 785 | 768 | 152.5 |
| B | 4 | 170 | 20784 | 131.28 | 785 | 768 | 152.5 |
| B | 4 | 81 | 20703 | 130.75 | 785 | 768 | 152.5 |
| C | 8 | 128 | 6243 | 31.01 | 757 | 760 | 176.8 |
| C | 13 | 61 | 5785 | 28.42 | 757 | 760 | 176.8 |
| C | 1 | 16 | 4076 | 18.75 | 757 | 760 | 176.8 |
| D | 13 | 105 | 2740927 | 15646.25 | 709 | 685 | 175.1 |
| D | 2 | 63 | 993093 | 5666.46 | 709 | 685 | 175.1 |
| D | 2 | 152 | 163123 | 927.49 | 709 | 685 | 175.1 |
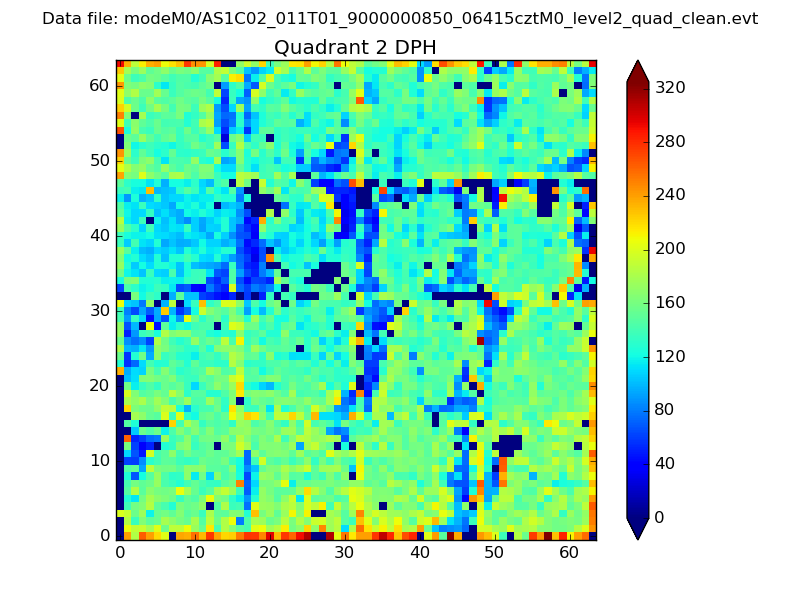
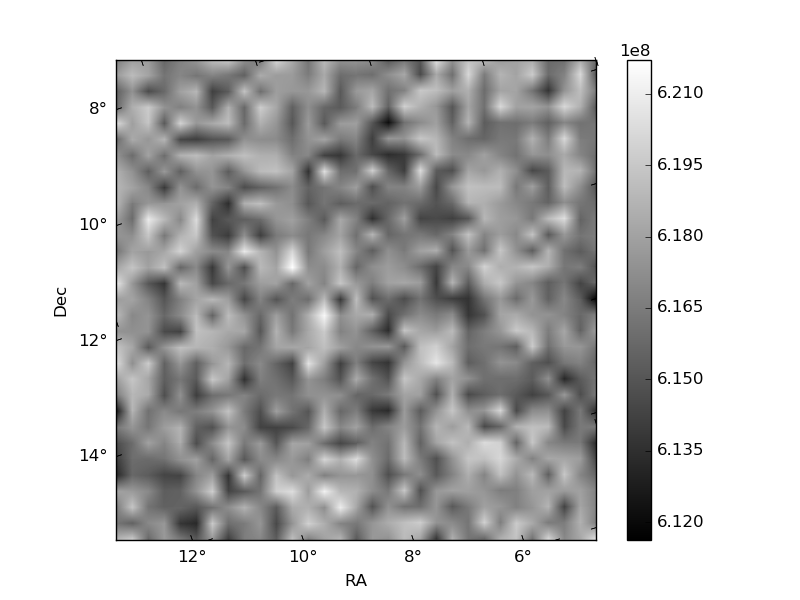
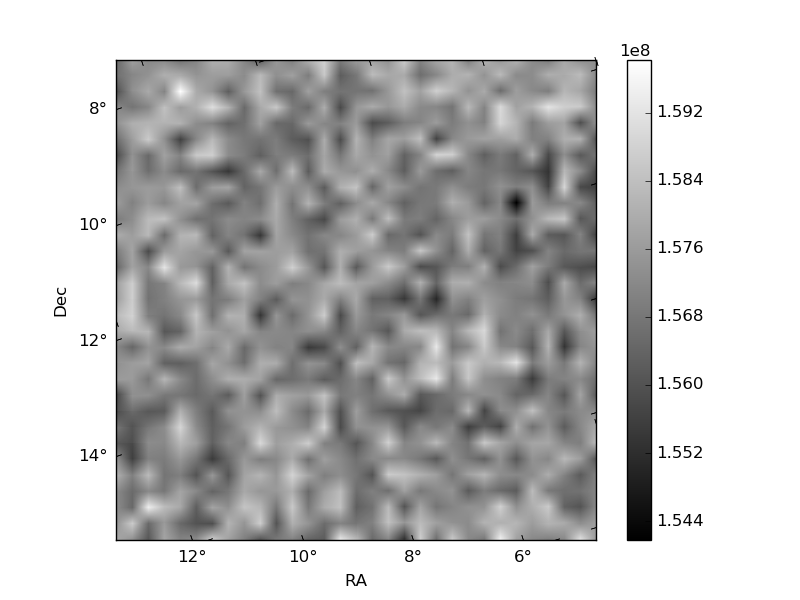
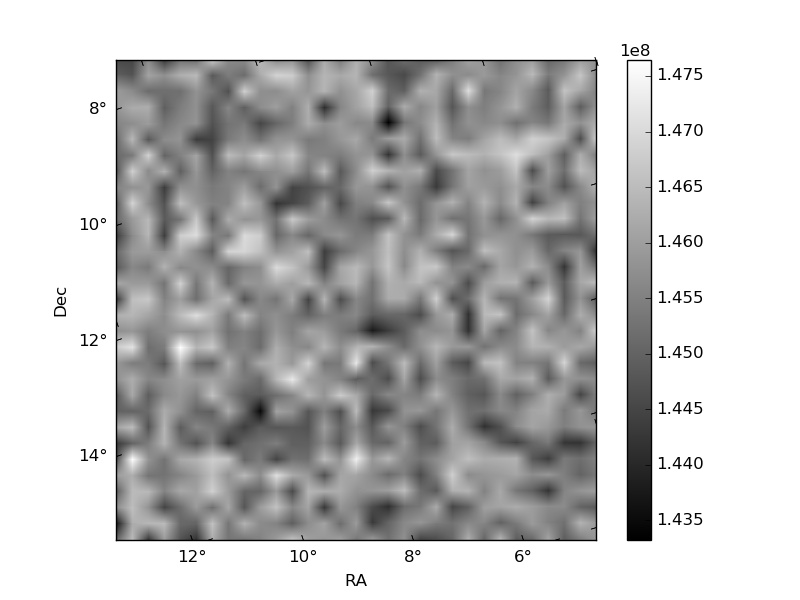
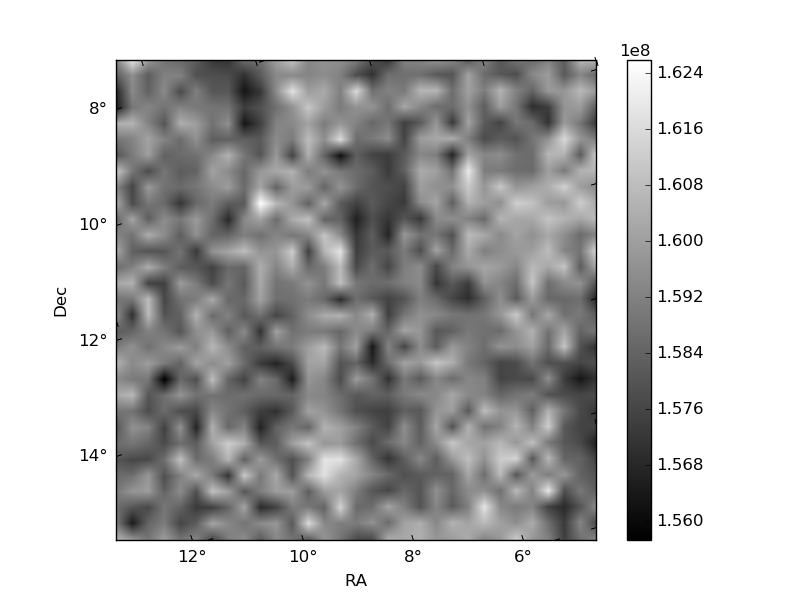
Histogram calculated using DETX and DETY for each event in the final _common_clean file
| Quadrant A | 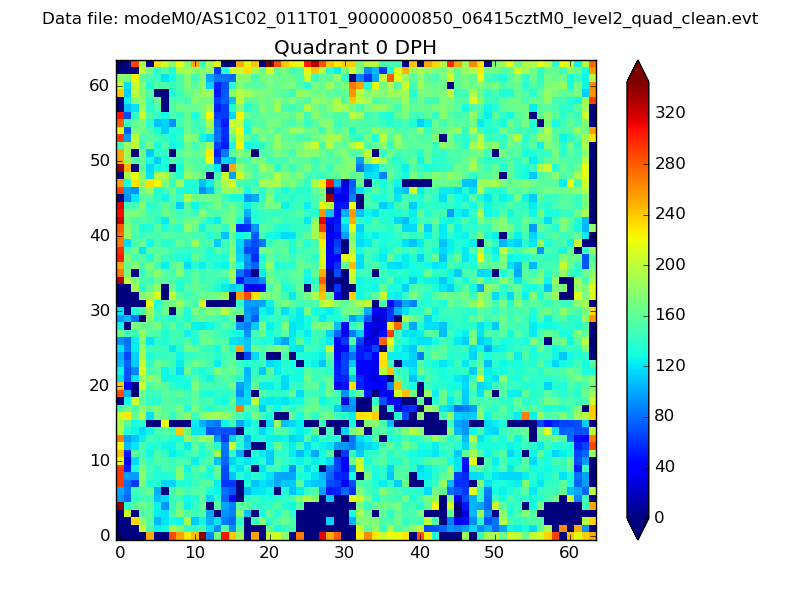 |
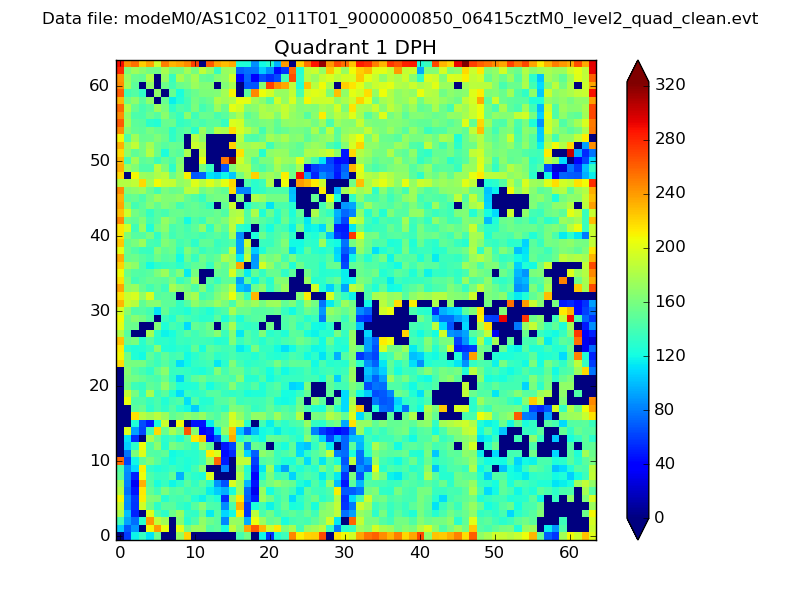 |
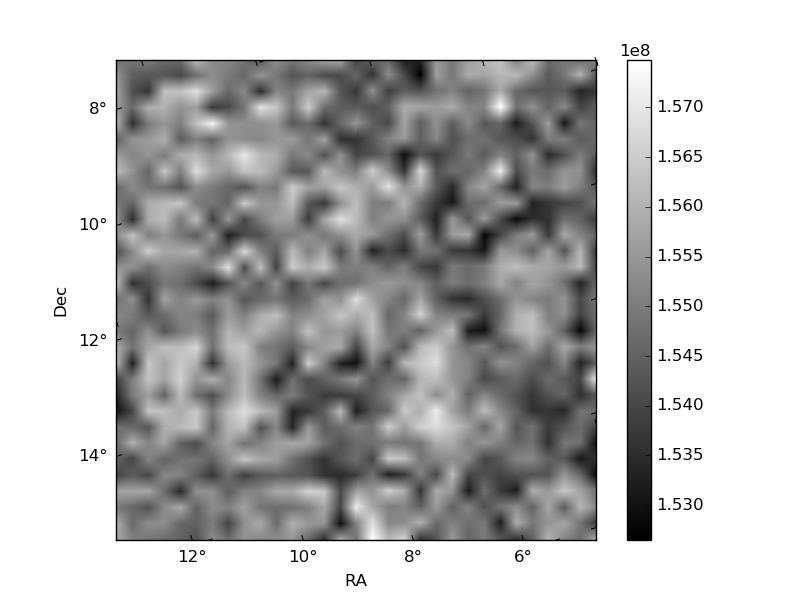
Quadrant B |
|---|---|---|---|
| Quadrant D | 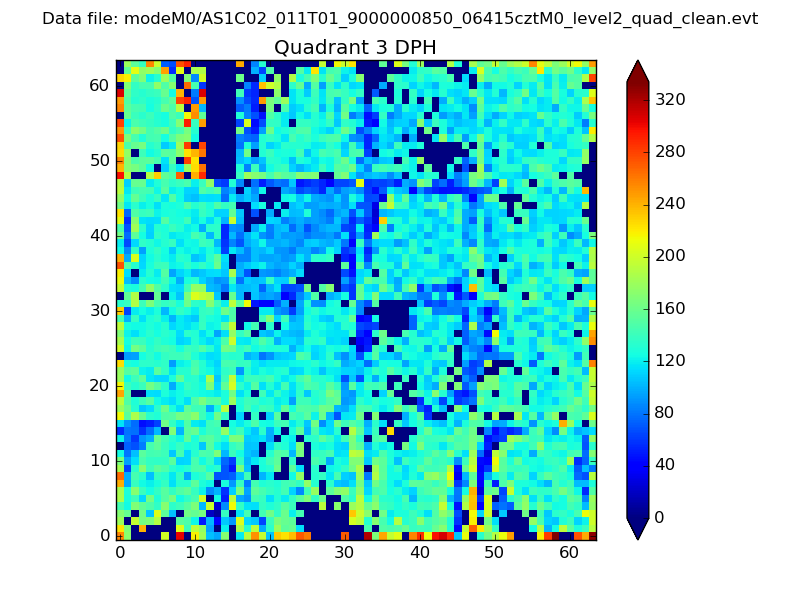 |
 |
Quadrant C |
| Plot type | Count rate plots | Images |
|---|---|---|
| Comparison with Poisson distribution Blue bars denote a histogram of data divided into 1 sec bins. Red curve is a Poisson curve with rate = median count rate of data. |
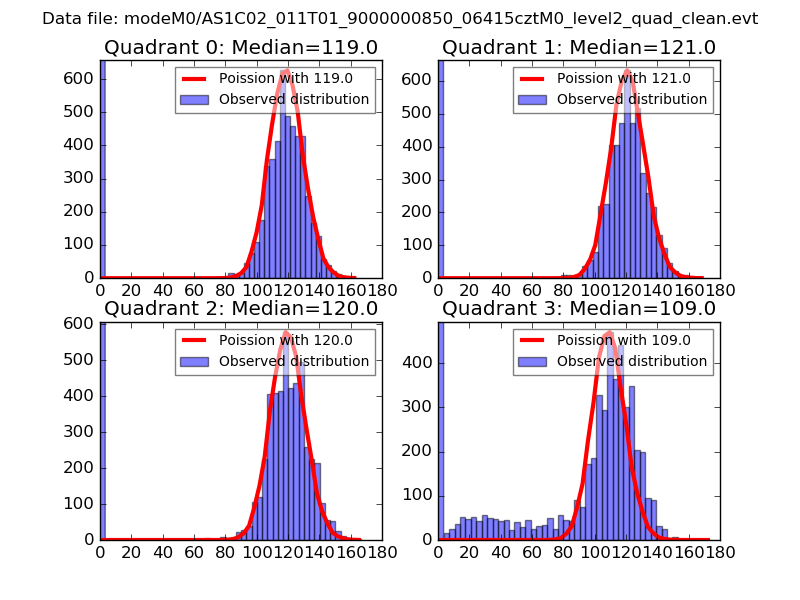 |
 |
| Quadrant-wise count rates Data is divided into 100 sec bins |
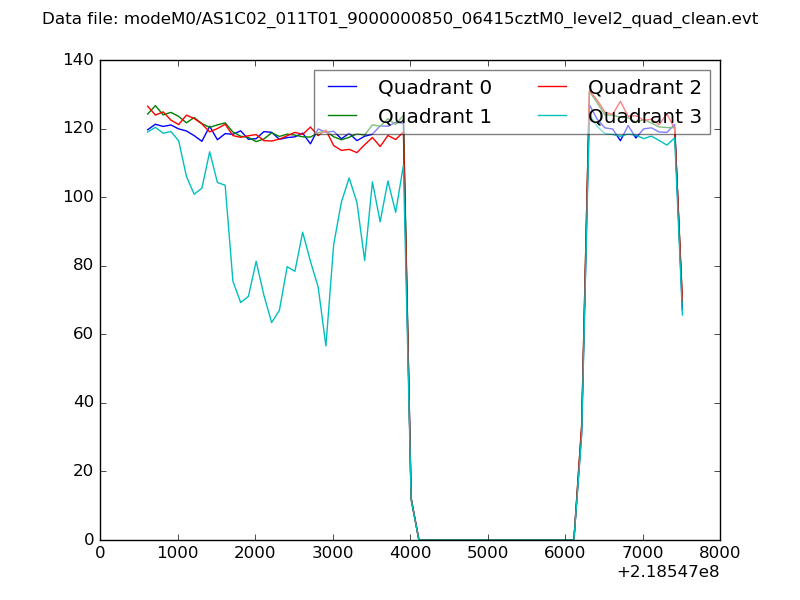 |
|
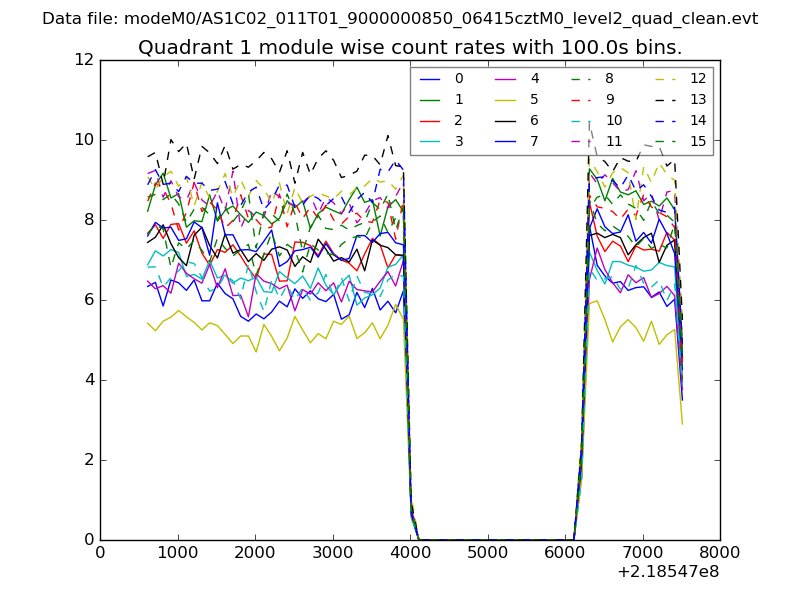
| Module-wise count rates for Quadrant A Data is divided into 100 sec bins |
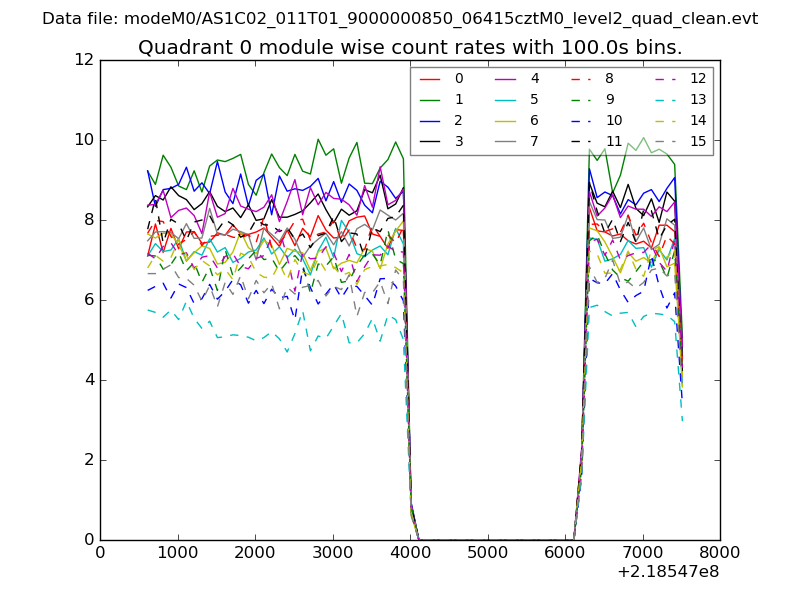 |
 |
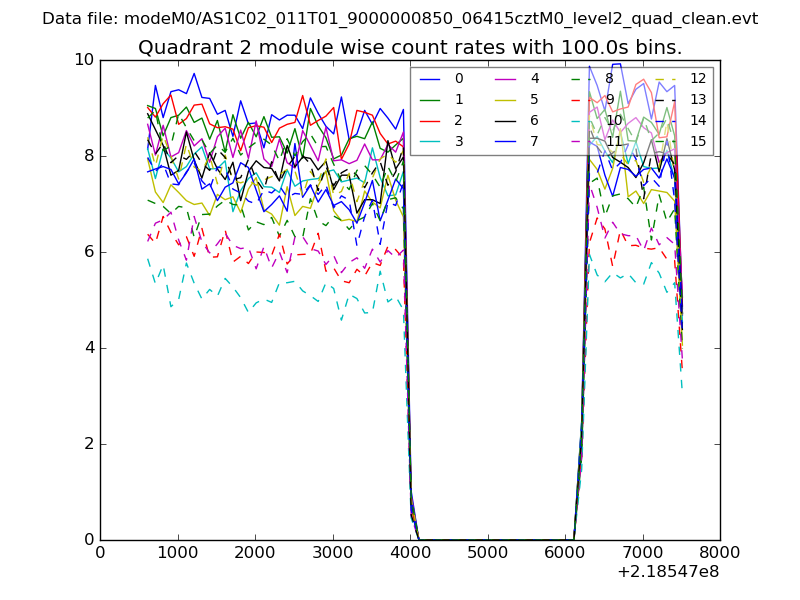
| Module-wise count rates for Quadrant B Data is divided into 100 sec bins |
 |
 |
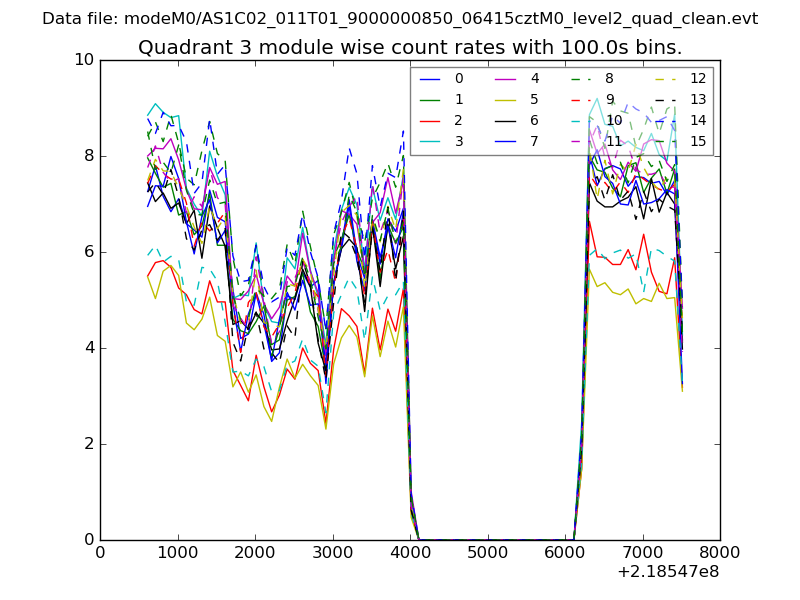
| Module-wise count rates for Quadrant C Data is divided into 100 sec bins |
 |
 |
| Module-wise count rates for Quadrant D Data is divided into 100 sec bins |
 |
 |
| Parameter | Plot |
|---|---|
| CZT HV Monitor |  |
| D_VDD | 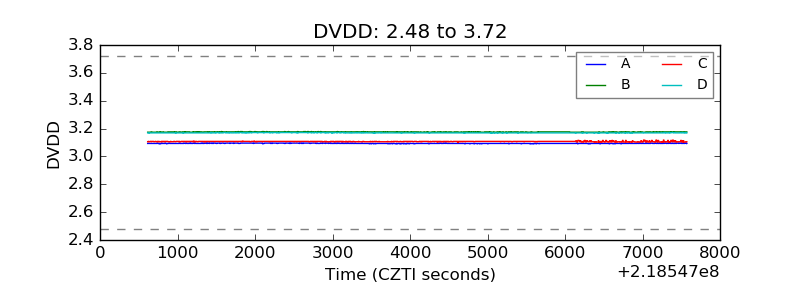 |
| Temperature 1 |  |
| Veto HV Monitor | 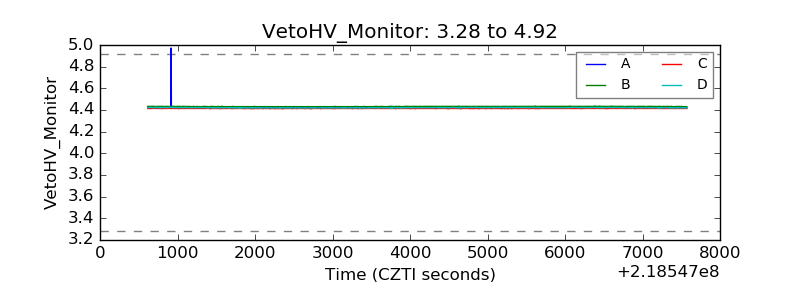 |
| Veto LLD | 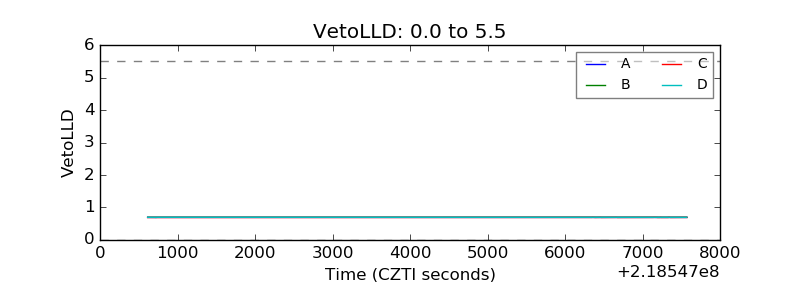 |
| Alpha Counter | 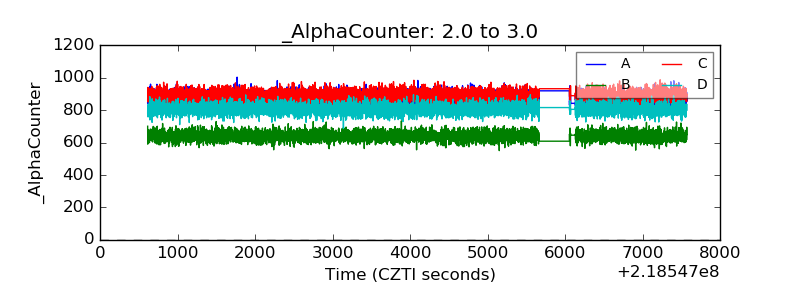 |
| _CPM_Rate | 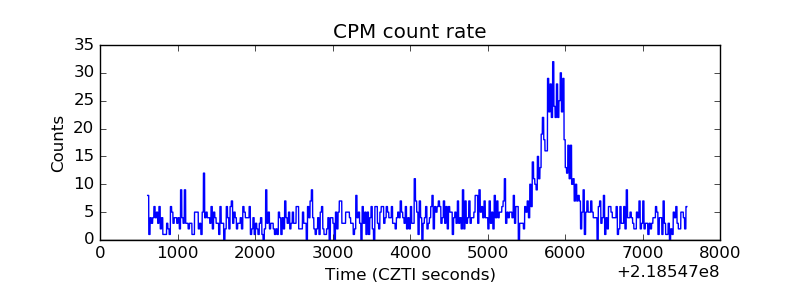 |
| CZT Counter | 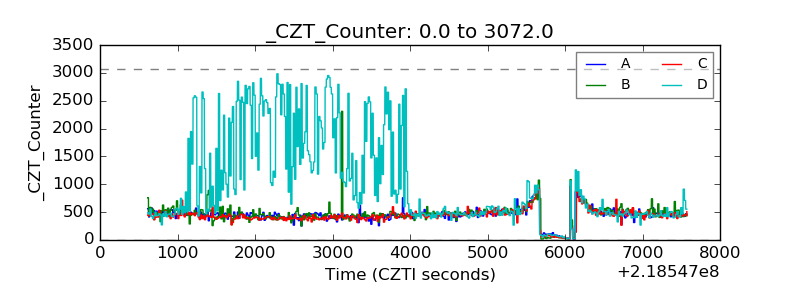 |
| +2.5 Volts monitor | 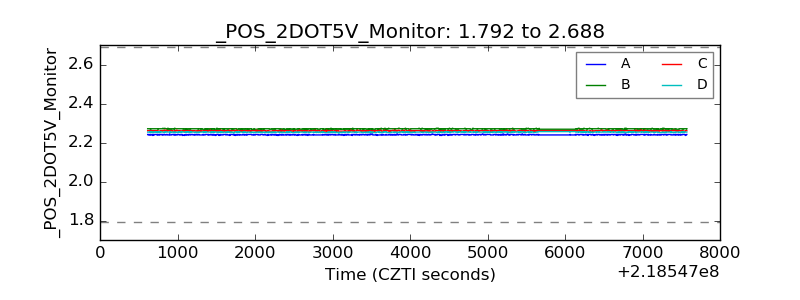 |
| +5 Volts monitor |  |
| _ROLL_ROT | 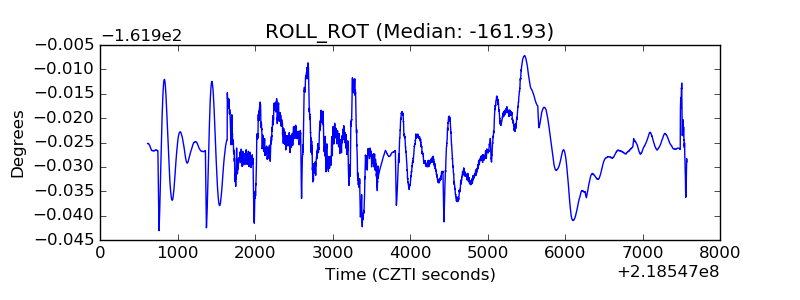 |
| _Roll_DEC | 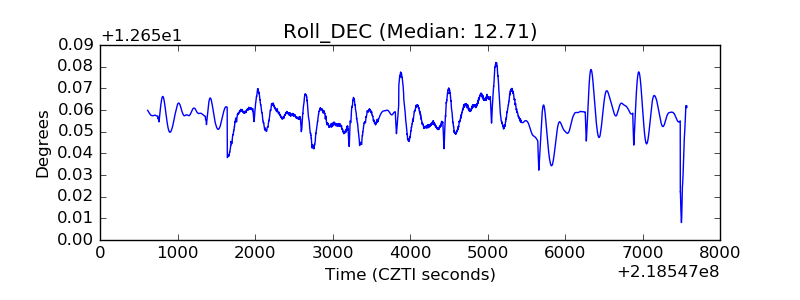 |
| _Roll_RA | 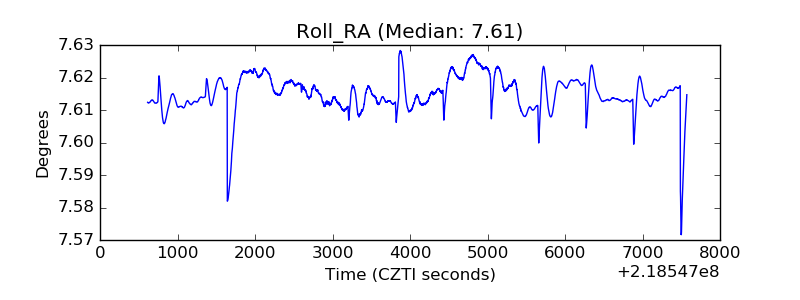 |
| Veto Counter | 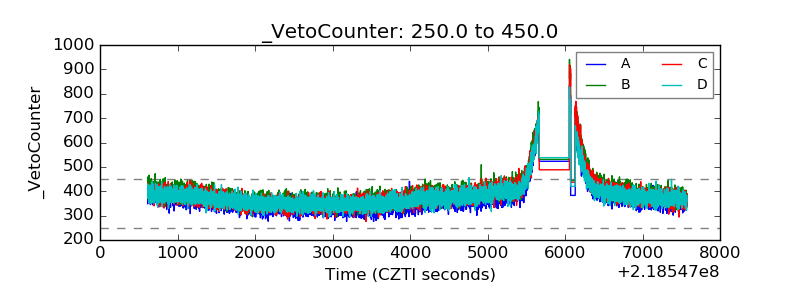 |