| Param | Original file | Final file |
|---|---|---|
| Filename | modeM0/AS1C02_011T01_9000000850_06416cztM0_level2.evt | modeM0/AS1C02_011T01_9000000850_06416cztM0_level2_quad_clean.evt |
| Size (bytes) | 700,254,720 | 100,195,200 |
| Size | 667.8 MB | 95.6 MB |
| Events in quadrant A | 3,938,228 | 640,256 |
| Events in quadrant B | 4,064,773 | 651,680 |
| Events in quadrant C | 3,789,024 | 650,991 |
| Events in quadrant D | 8,880,361 | 541,529 |
| Mode SS | |||
|---|---|---|---|
| Quadrant | BADHDUFLAG | Total packets | Discarded packets |
| A | 0 | 162 | 0 |
| B | 0 | 162 | 0 |
| C | 0 | 162 | 0 |
| D | 0 | 162 | 0 |
| Mode M0 | |||
|---|---|---|---|
| Quadrant | BADHDUFLAG | Total packets | Discarded packets |
| A | 0 | 16845 | 3 |
| B | 0 | 17207 | 2 |
| C | 0 | 16748 | 2 |
| D | 0 | 31649 | 2 |
| Mode M9 | |||
|---|---|---|---|
| Quadrant | BADHDUFLAG | Total packets | Discarded packets |
| A | 0 | 6 | 0 |
| B | 0 | 6 | 0 |
| C | 0 | 6 | 0 |
| D | 0 | 6 | 0 |
| Quadrant | Total seconds | Saturated seconds | Saturation percentage |
|---|---|---|---|
| A | 7901 | 285 | 3.607138% |
| B | 7901 | 305 | 3.860271% |
| C | 7901 | 96 | 1.215036% |
| D | 7901 | 1732 | 21.921276% |
Noise dominated data is calculated using 1-second bins in cleaned event files. If a bin has >2000 counts, and if more than 50% of those come from <1% of pixels, then it is considered to be noise-dominated and hence unusable.
| Quadrant | # 1 sec bins | Bins with >0 counts | Bins with >2000 counts | High rate bins dominated by noise | Noise dominated (total time) | Noise dominated (detector-on time) | Marked lightcurve |
|---|---|---|---|---|---|---|---|
| A | 8391 | 7904 | 0 | 0 | 0.00% | 0.00% | 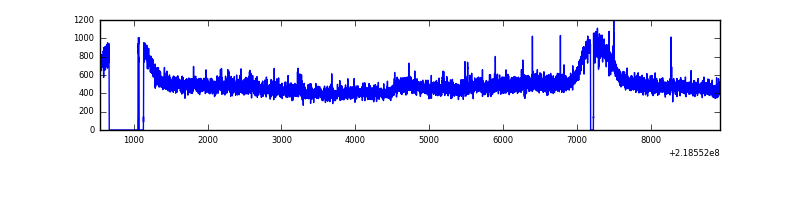 |
| B | 8391 | 7904 | 1 | 1 | 0.01% | 0.01% | 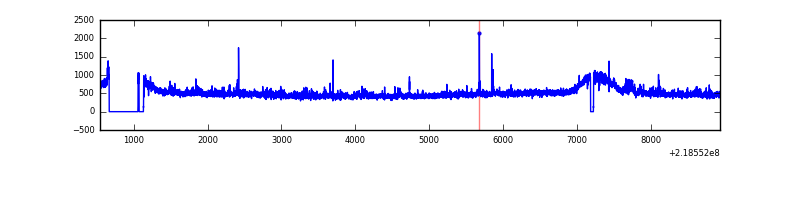 |
| C | 8391 | 7904 | 0 | 0 | 0.00% | 0.00% | 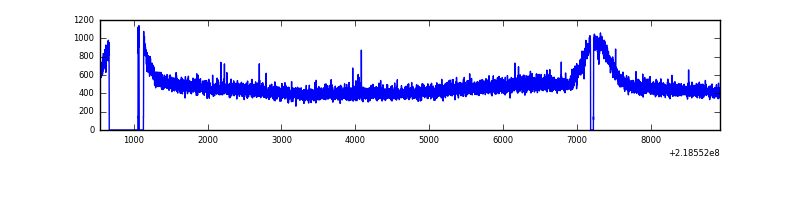 |
| D | 8391 | 7904 | 1549 | 1549 | 18.46% | 19.60% | 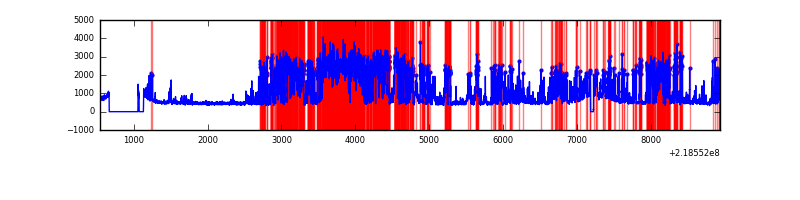 |
Top three noisy pixels from each quadrant. If the there are fewer than three noisy pixels in the level2.evt file, extra rows are filled as -1
| Pixel properties | Quadrant properties | ||||||
|---|---|---|---|---|---|---|---|
| Quadrant | DetID | PixID | Counts | Sigma | Mean | Median | Sigma |
| A | 15 | 236 | 70894 | 341.59 | 992 | 969 | 204.7 |
| A | 8 | 15 | 38114 | 181.46 | 992 | 969 | 204.7 |
| A | 0 | 226 | 9602 | 42.17 | 992 | 969 | 204.7 |
| B | 15 | 204 | 115537 | 585.6 | 994 | 971 | 195.6 |
| B | 4 | 81 | 30097 | 148.88 | 994 | 971 | 195.6 |
| B | 12 | 111 | 20196 | 98.27 | 994 | 971 | 195.6 |
| C | 8 | 128 | 18597 | 78.56 | 961 | 967 | 224.4 |
| C | 8 | 112 | 8132 | 31.93 | 961 | 967 | 224.4 |
| C | 13 | 61 | 7522 | 29.21 | 961 | 967 | 224.4 |
| D | 13 | 105 | 5057310 | 22519.39 | 900 | 871 | 224.5 |
| D | 2 | 152 | 177219 | 785.38 | 900 | 871 | 224.5 |
| D | 11 | 241 | 60901 | 267.35 | 900 | 871 | 224.5 |
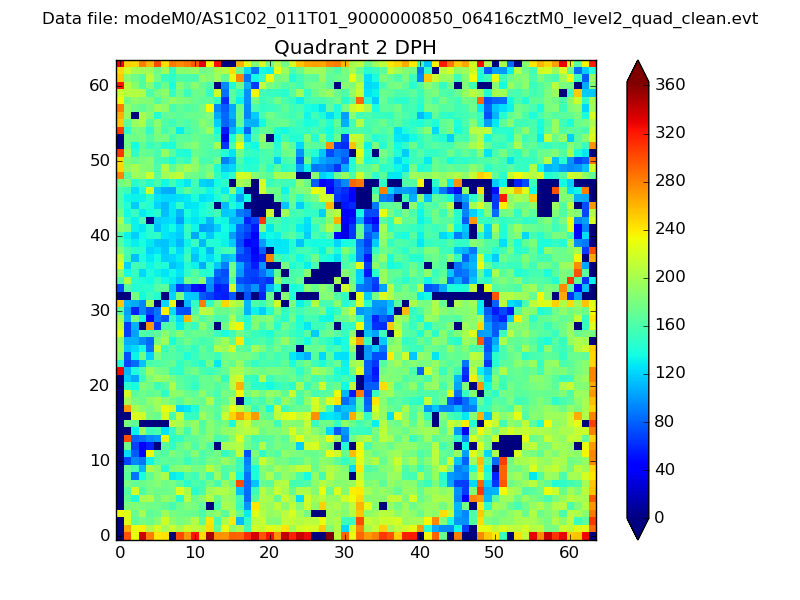
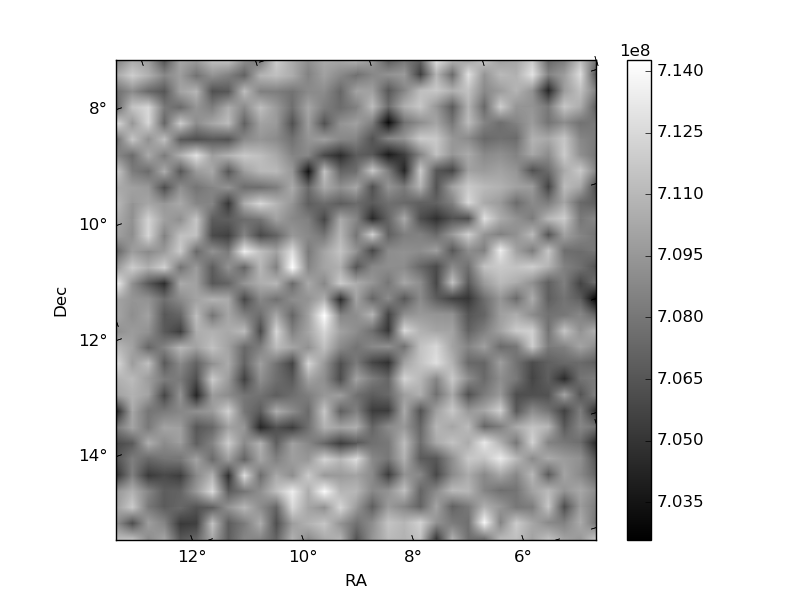
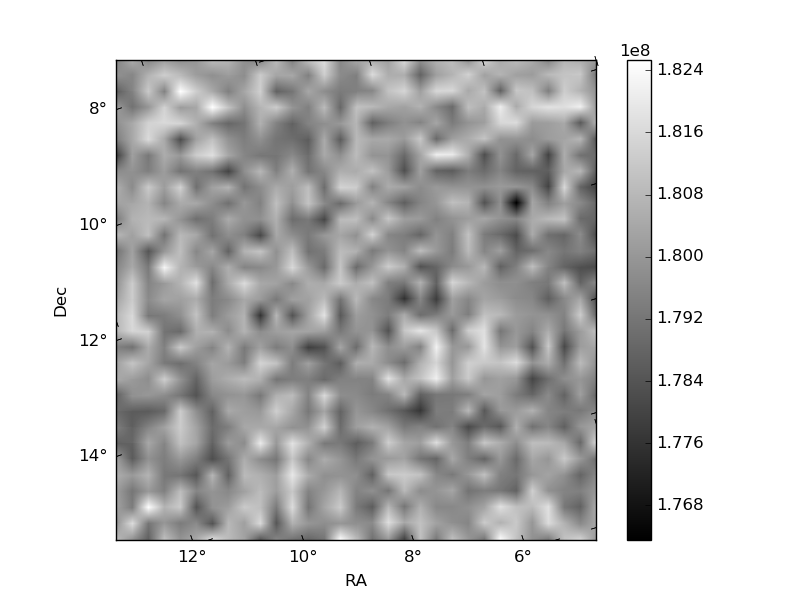
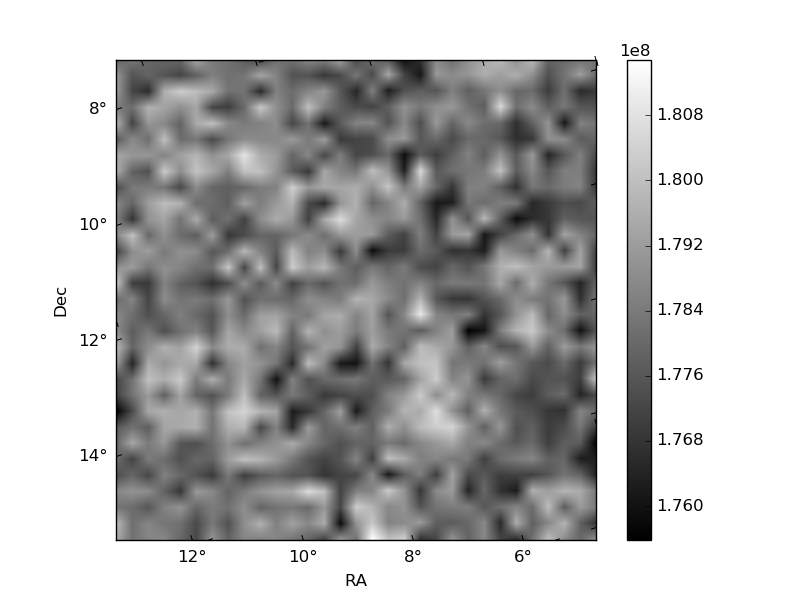
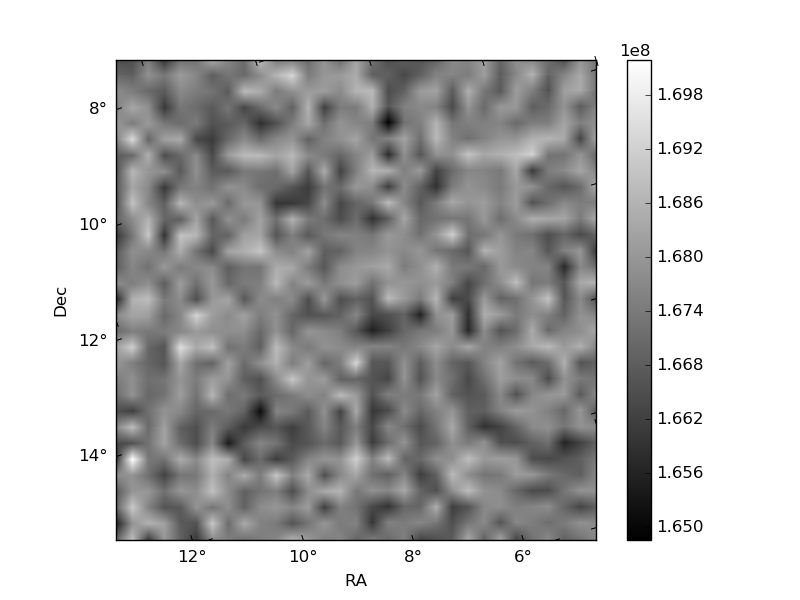
Histogram calculated using DETX and DETY for each event in the final _common_clean file
| Quadrant A | 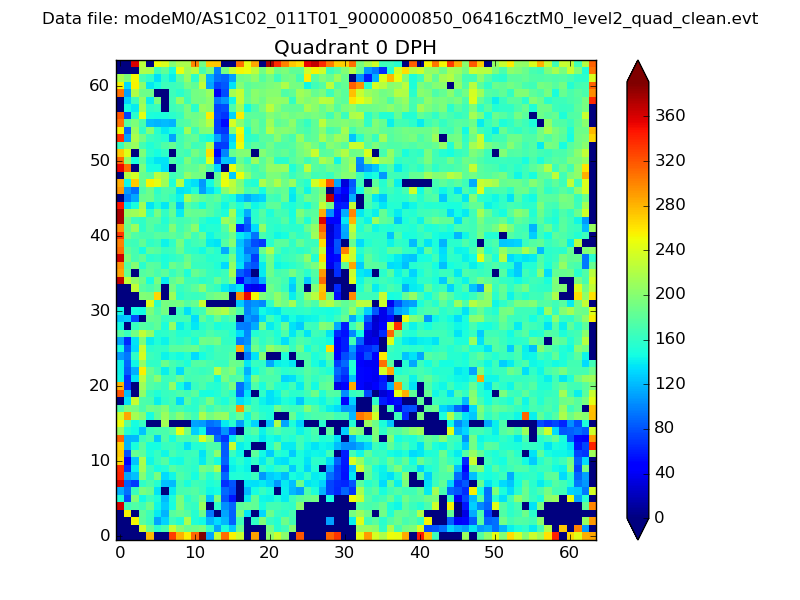 |
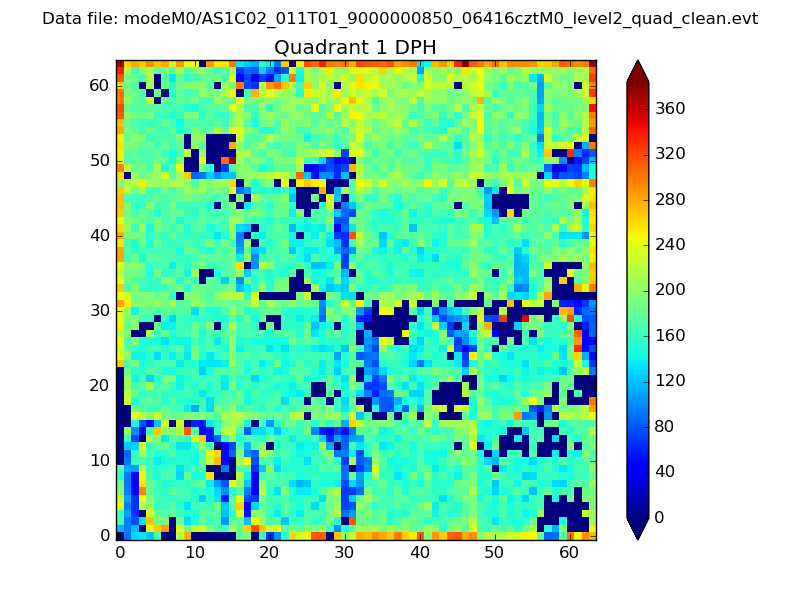 |
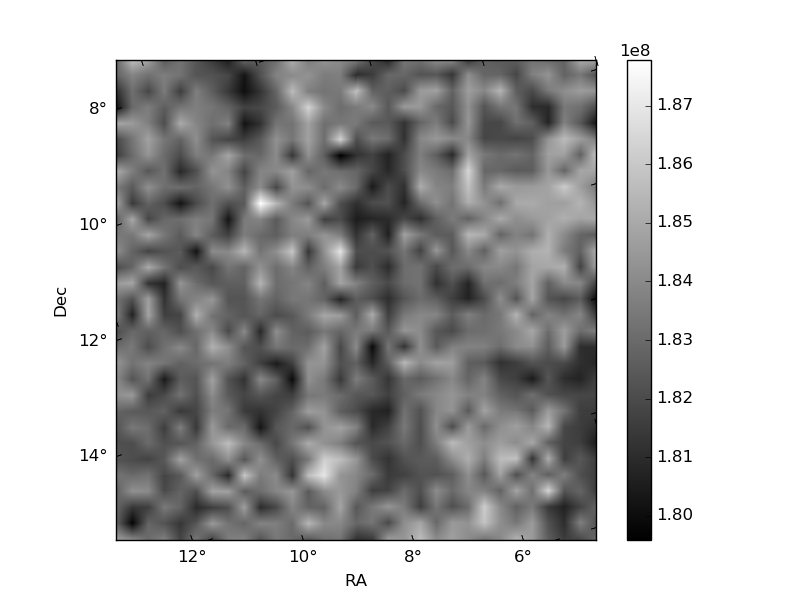
Quadrant B |
|---|---|---|---|
| Quadrant D | 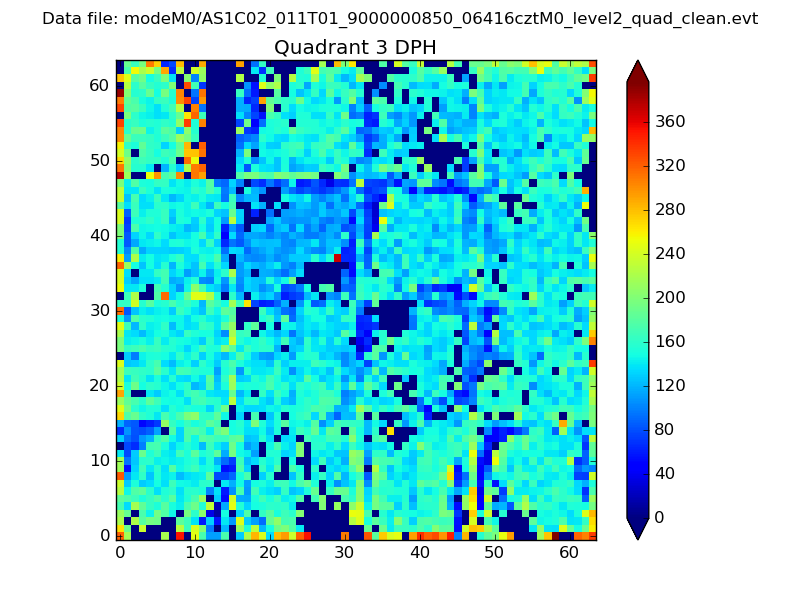 |
 |
Quadrant C |
| Plot type | Count rate plots | Images |
|---|---|---|
| Comparison with Poisson distribution Blue bars denote a histogram of data divided into 1 sec bins. Red curve is a Poisson curve with rate = median count rate of data. |
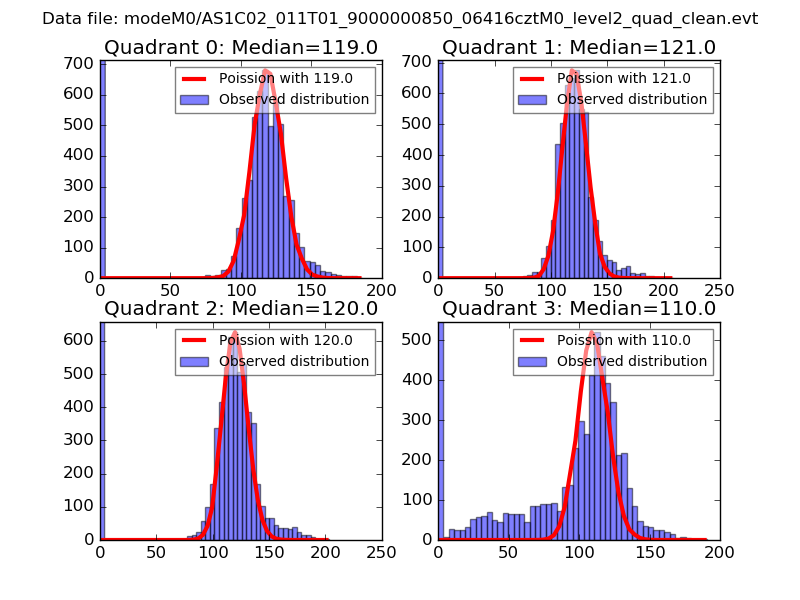 |
 |
| Quadrant-wise count rates Data is divided into 100 sec bins |
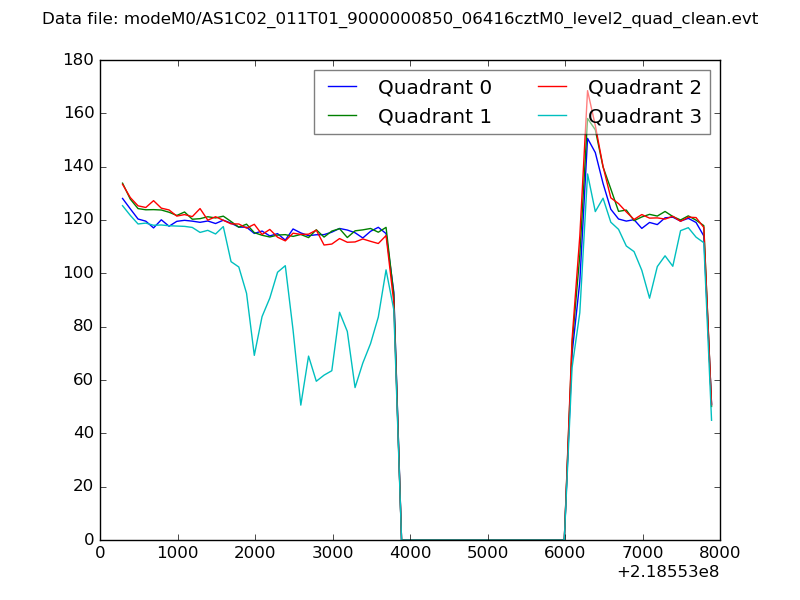 |
|
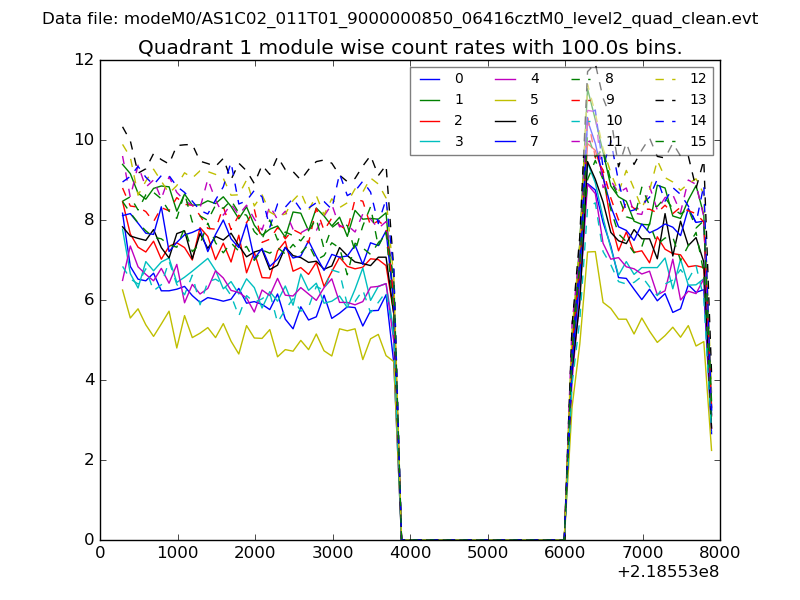
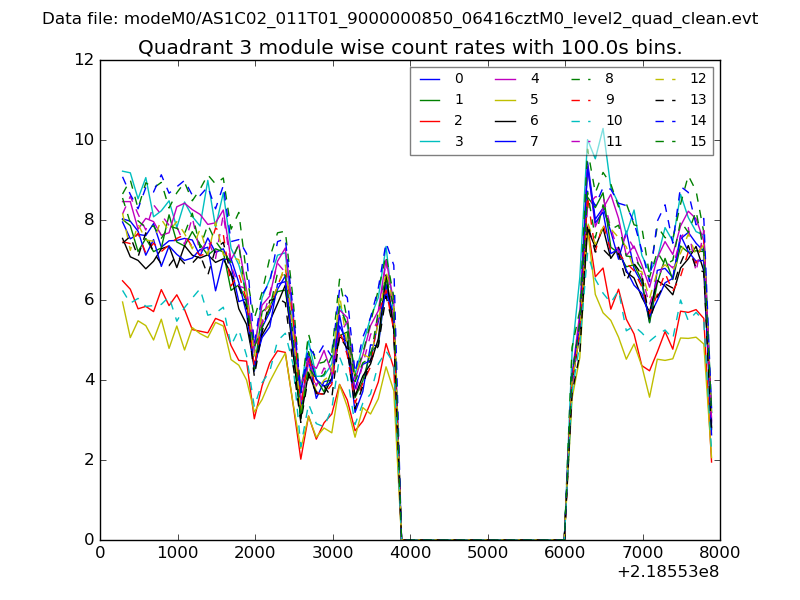
| Module-wise count rates for Quadrant A Data is divided into 100 sec bins |
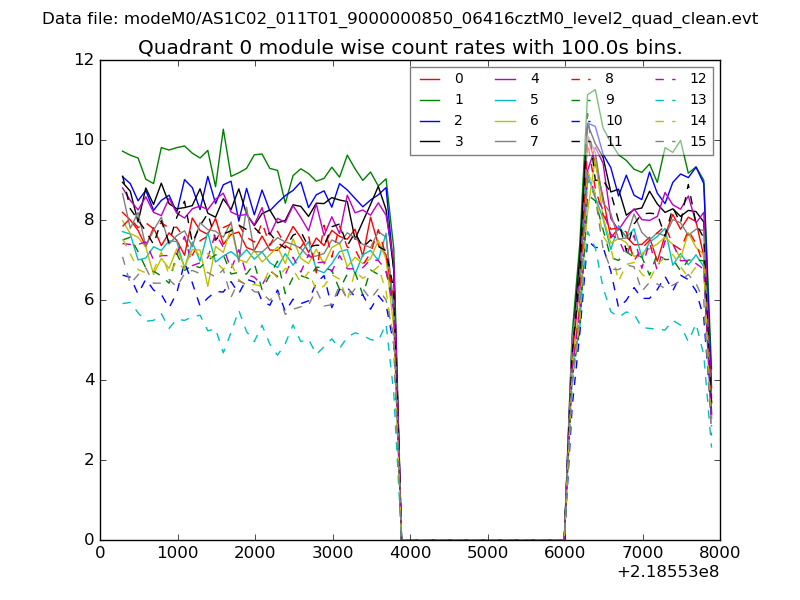 |
 |
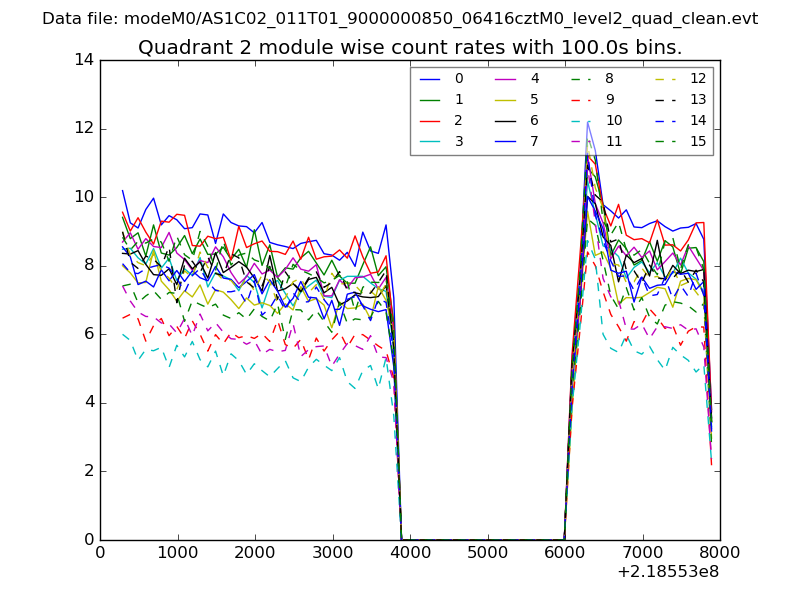
| Module-wise count rates for Quadrant B Data is divided into 100 sec bins |
 |
 |
| Module-wise count rates for Quadrant C Data is divided into 100 sec bins |
 |
 |
| Module-wise count rates for Quadrant D Data is divided into 100 sec bins |
 |
 |
| Parameter | Plot |
|---|---|
| CZT HV Monitor | 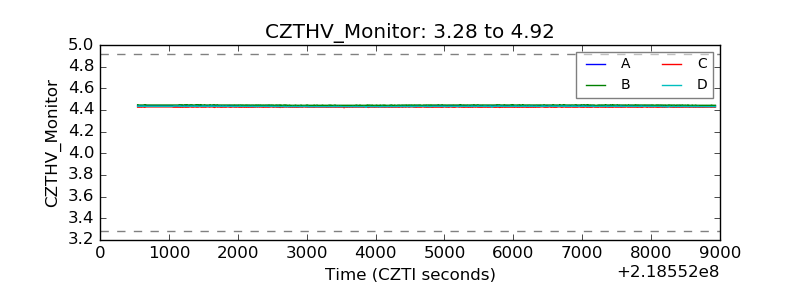 |
| D_VDD | 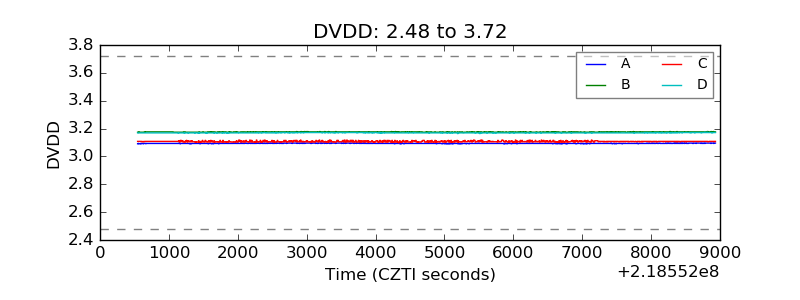 |
| Temperature 1 | 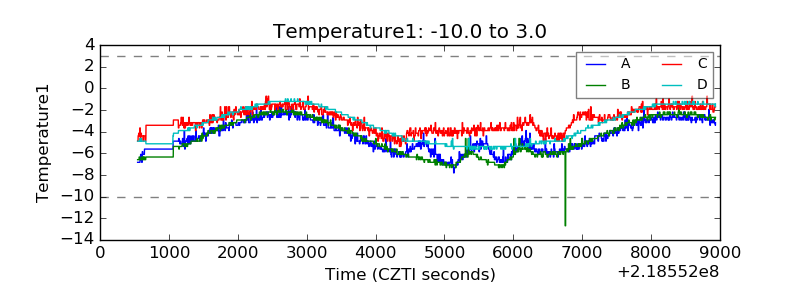 |
| Veto HV Monitor | 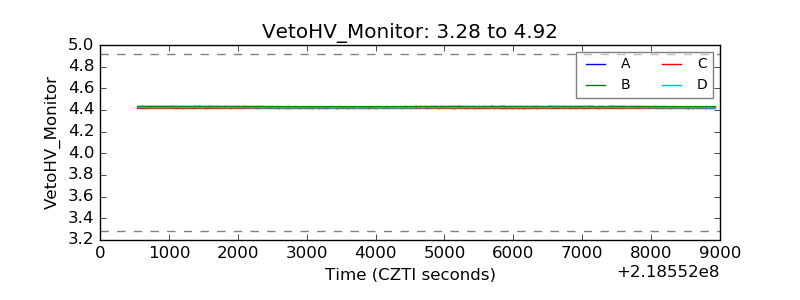 |
| Veto LLD | 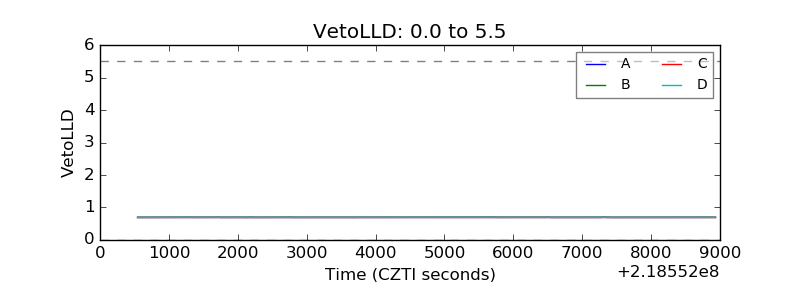 |
| Alpha Counter | 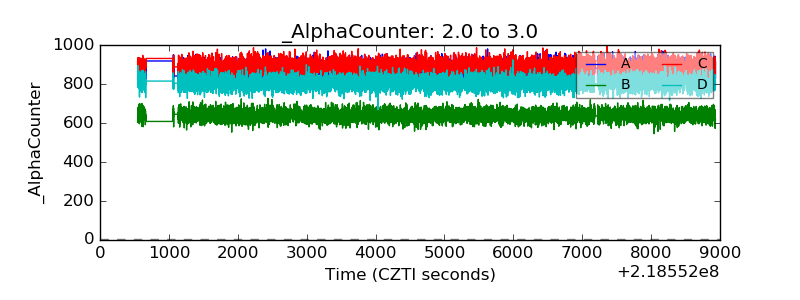 |
| _CPM_Rate | 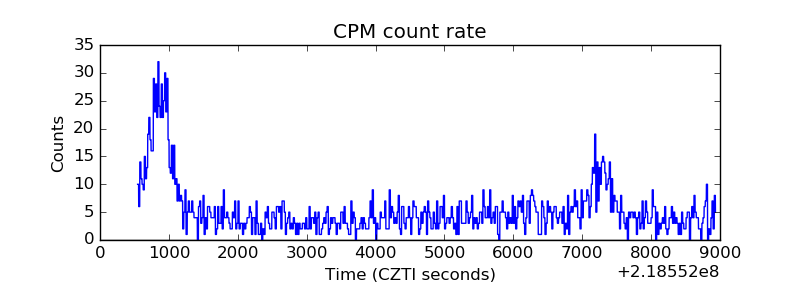 |
| CZT Counter | 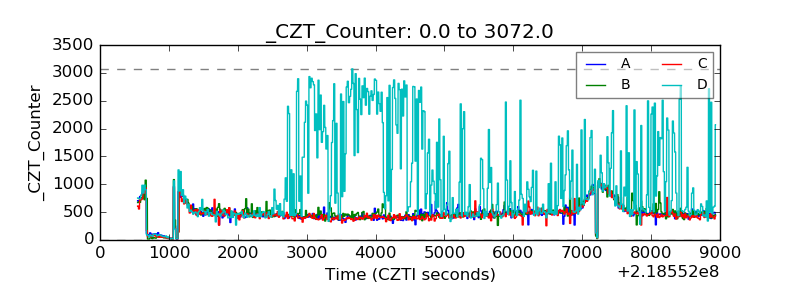 |
| +2.5 Volts monitor |  |
| +5 Volts monitor |  |
| _ROLL_ROT | 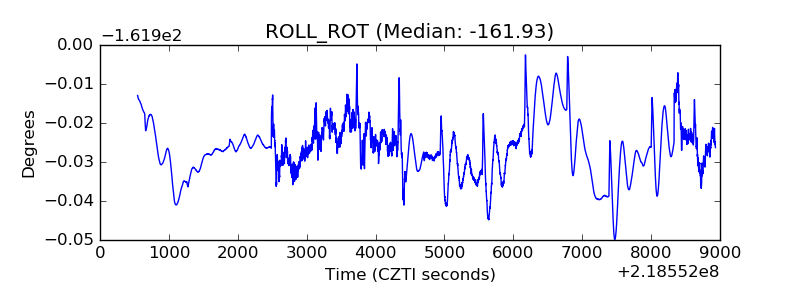 |
| _Roll_DEC | 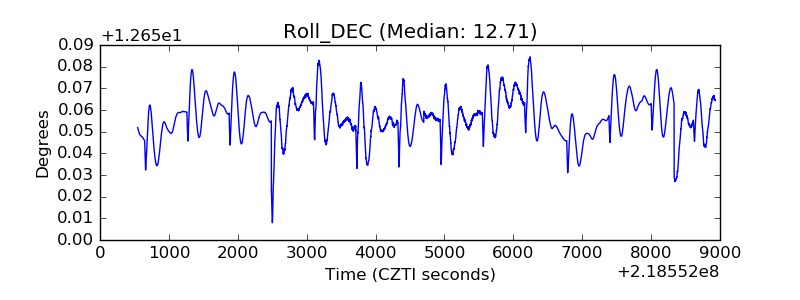 |
| _Roll_RA | 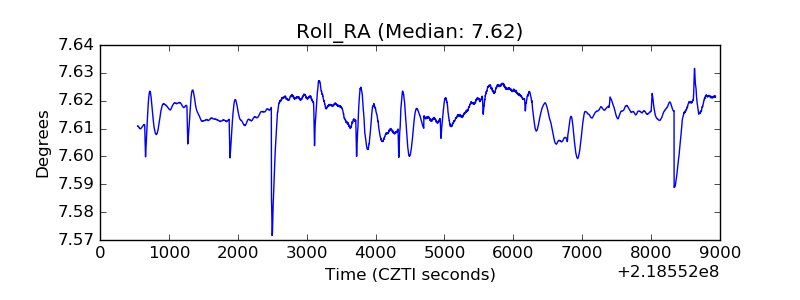 |
| Veto Counter | 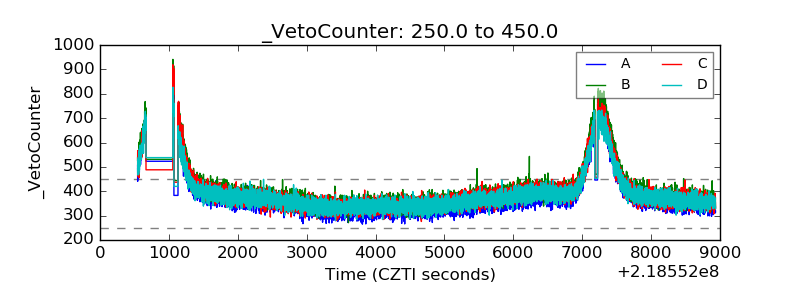 |