| Param | Original file | Final file |
|---|---|---|
| Filename | modeM0/AS1C02_011T01_9000000850_06420cztM0_level2.evt | modeM0/AS1C02_011T01_9000000850_06420cztM0_level2_quad_clean.evt |
| Size (bytes) | 764,110,080 | 128,220,480 |
| Size | 728.7 MB | 122.3 MB |
| Events in quadrant A | 5,600,365 | 778,587 |
| Events in quadrant B | 5,601,146 | 793,567 |
| Events in quadrant C | 4,968,336 | 789,338 |
| Events in quadrant D | 6,220,048 | 753,765 |
| Mode SS | |||
|---|---|---|---|
| Quadrant | BADHDUFLAG | Total packets | Discarded packets |
| A | 0 | 228 | 0 |
| B | 0 | 228 | 0 |
| C | 0 | 228 | 0 |
| D | 0 | 228 | 0 |
| Mode M0 | |||
|---|---|---|---|
| Quadrant | BADHDUFLAG | Total packets | Discarded packets |
| A | 0 | 24503 | 2 |
| B | 0 | 24012 | 2 |
| C | 0 | 22790 | 2 |
| D | 0 | 26021 | 2 |
| Mode M9 | |||
|---|---|---|---|
| Quadrant | BADHDUFLAG | Total packets | Discarded packets |
| A | 0 | 6 | 0 |
| B | 0 | 6 | 0 |
| C | 0 | 6 | 0 |
| D | 0 | 6 | 0 |
| Quadrant | Total seconds | Saturated seconds | Saturation percentage |
|---|---|---|---|
| A | 11084 | 187 | 1.687117% |
| B | 11084 | 194 | 1.750271% |
| C | 11084 | 57 | 0.514255% |
| D | 11084 | 205 | 1.849513% |
Noise dominated data is calculated using 1-second bins in cleaned event files. If a bin has >2000 counts, and if more than 50% of those come from <1% of pixels, then it is considered to be noise-dominated and hence unusable.
| Quadrant | # 1 sec bins | Bins with >0 counts | Bins with >2000 counts | High rate bins dominated by noise | Noise dominated (total time) | Noise dominated (detector-on time) | Marked lightcurve |
|---|---|---|---|---|---|---|---|
| A | 11734 | 11087 | 7 | 7 | 0.06% | 0.06% | 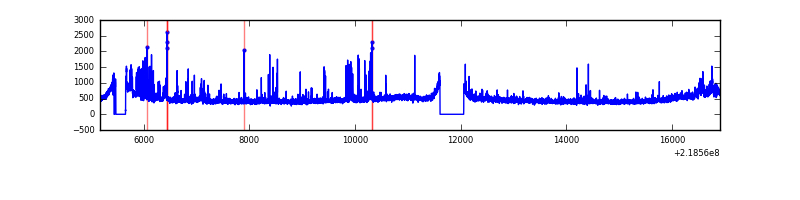 |
| B | 11734 | 11087 | 28 | 28 | 0.24% | 0.25% | 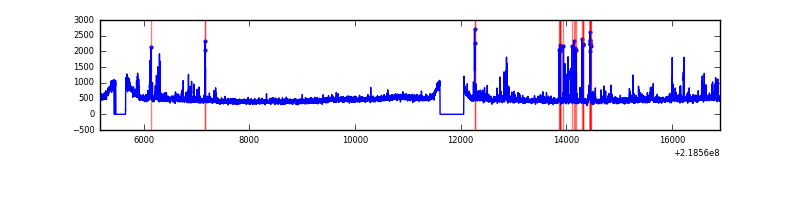 |
| C | 11734 | 11087 | 0 | 0 | 0.00% | 0.00% | 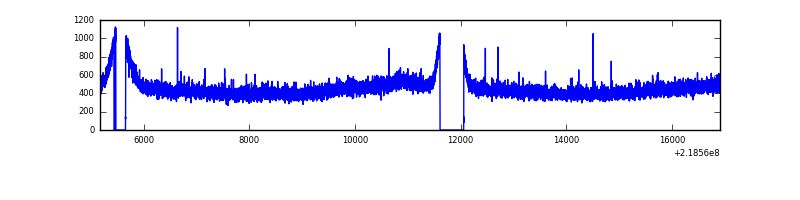 |
| D | 11734 | 11087 | 104 | 104 | 0.89% | 0.94% | 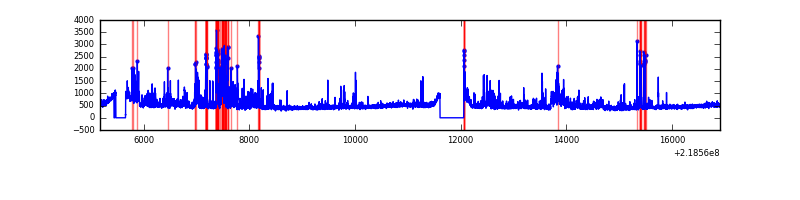 |
Top three noisy pixels from each quadrant. If the there are fewer than three noisy pixels in the level2.evt file, extra rows are filled as -1
| Pixel properties | Quadrant properties | ||||||
|---|---|---|---|---|---|---|---|
| Quadrant | DetID | PixID | Counts | Sigma | Mean | Median | Sigma |
| A | 8 | 15 | 377417 | 1422.42 | 1299 | 1269 | 264.4 |
| A | 13 | 251 | 185822 | 697.89 | 1299 | 1269 | 264.4 |
| A | 15 | 236 | 31760 | 115.3 | 1299 | 1269 | 264.4 |
| B | 4 | 81 | 304749 | 1193.89 | 1313 | 1279 | 254.2 |
| B | 15 | 204 | 63907 | 246.38 | 1313 | 1279 | 254.2 |
| B | 0 | 219 | 47294 | 181.03 | 1313 | 1279 | 254.2 |
| C | 13 | 61 | 10298 | 30.36 | 1271 | 1282 | 297.0 |
| C | 8 | 222 | 5071 | 12.76 | 1271 | 1282 | 297.0 |
| C | 8 | 208 | 3728 | 8.24 | 1271 | 1282 | 297.0 |
| D | 7 | 55 | 410225 | 1311.81 | 1267 | 1231 | 311.8 |
| D | 2 | 63 | 303186 | 968.49 | 1267 | 1231 | 311.8 |
| D | 2 | 152 | 300635 | 960.31 | 1267 | 1231 | 311.8 |
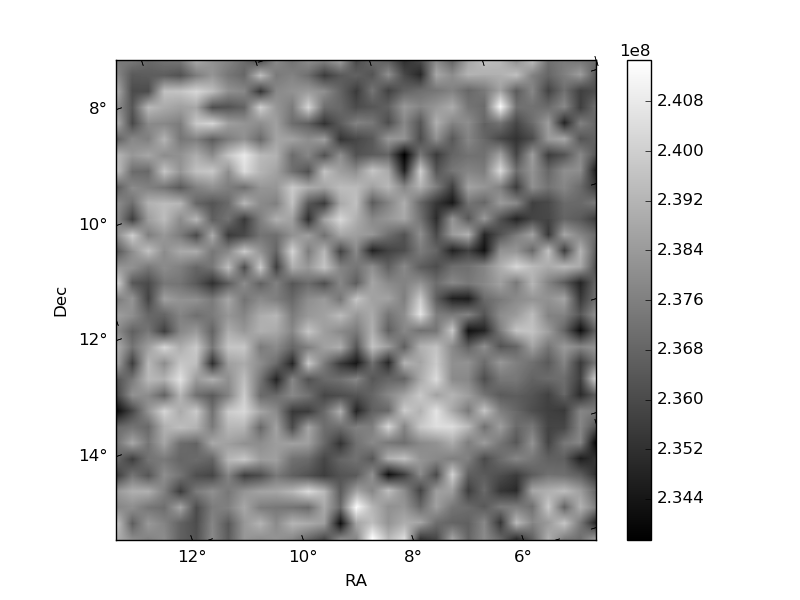
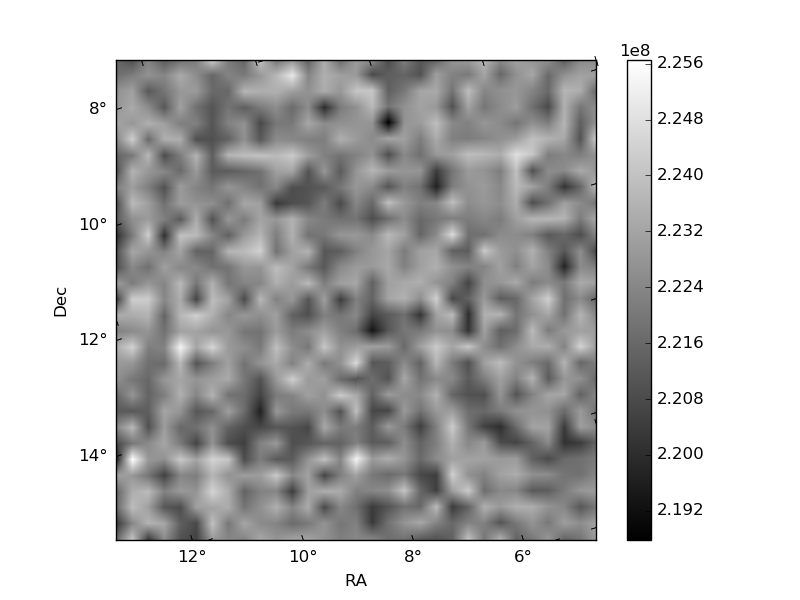
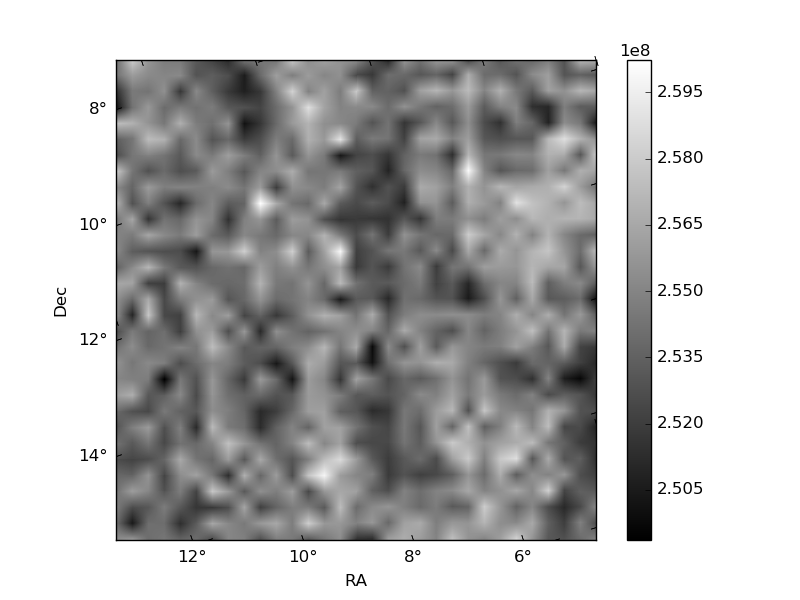
Histogram calculated using DETX and DETY for each event in the final _common_clean file
| Quadrant A | 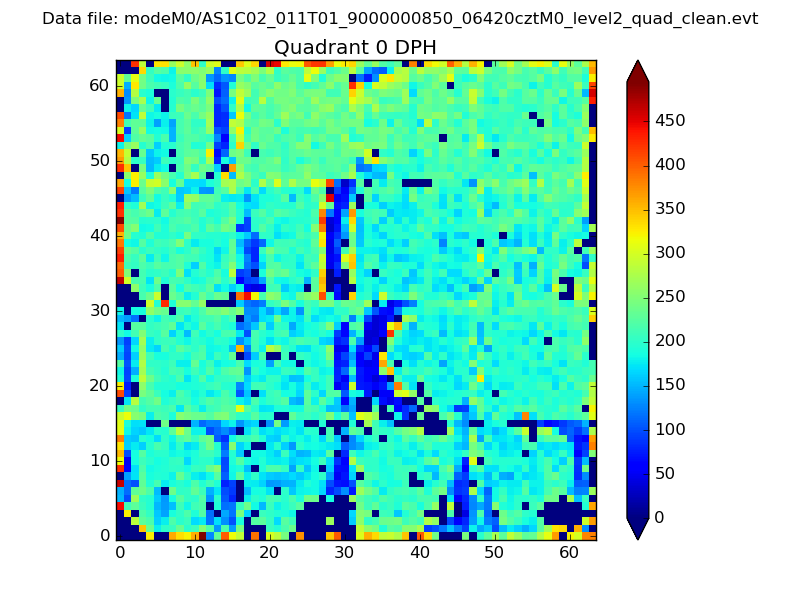 |
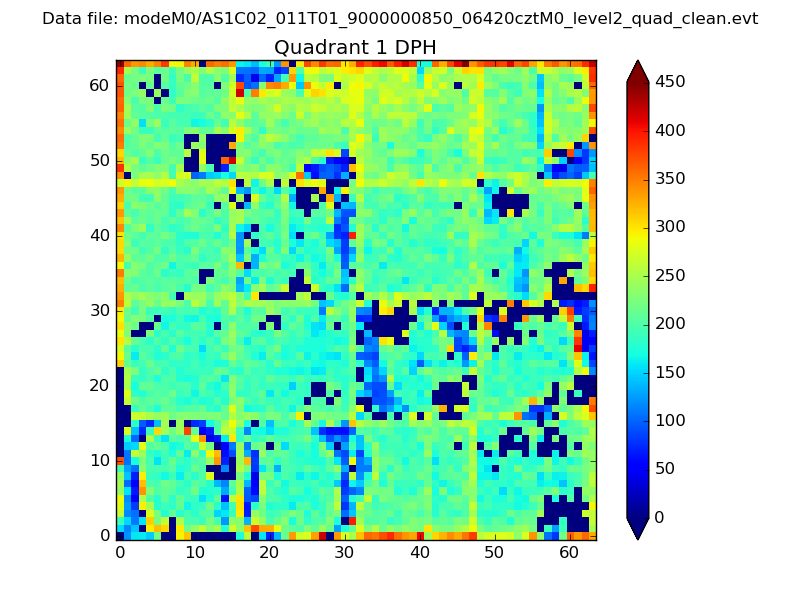 |
Quadrant B |
|---|---|---|---|
| Quadrant D | 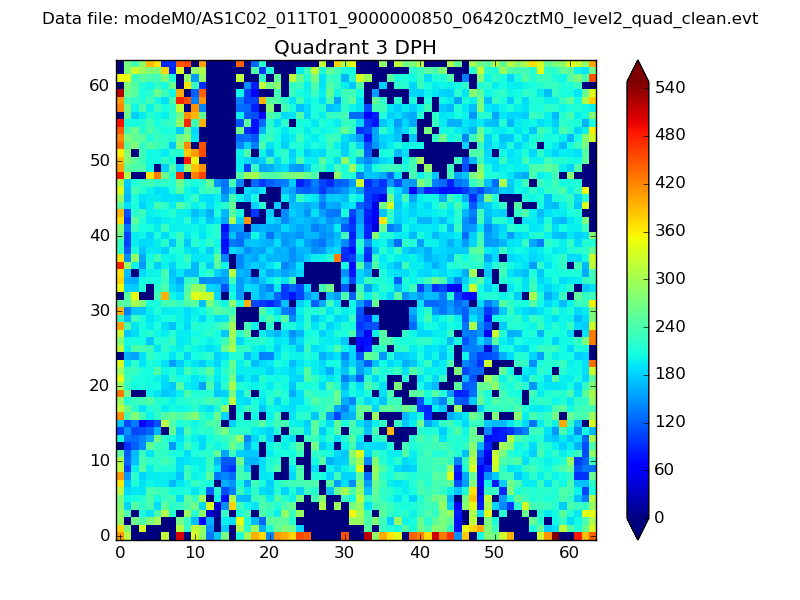 |
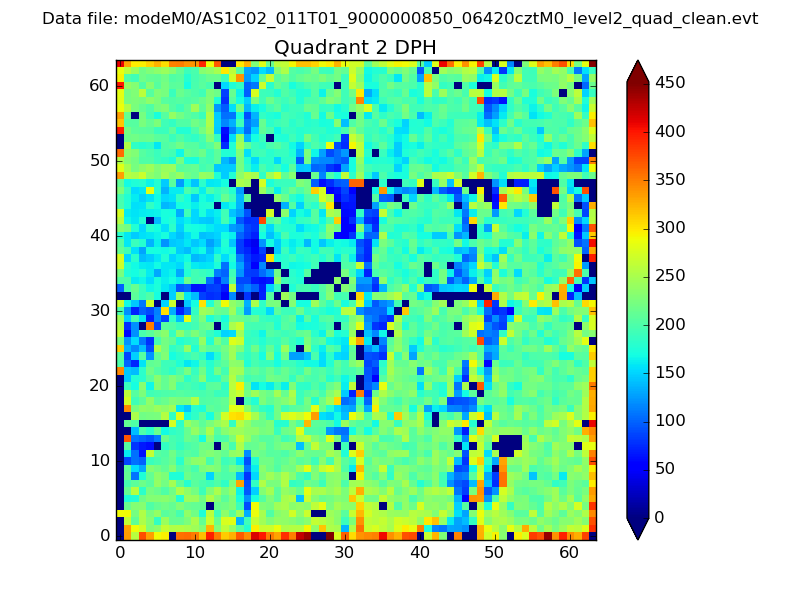 |
Quadrant C |
| Plot type | Count rate plots | Images |
|---|---|---|
| Comparison with Poisson distribution Blue bars denote a histogram of data divided into 1 sec bins. Red curve is a Poisson curve with rate = median count rate of data. |
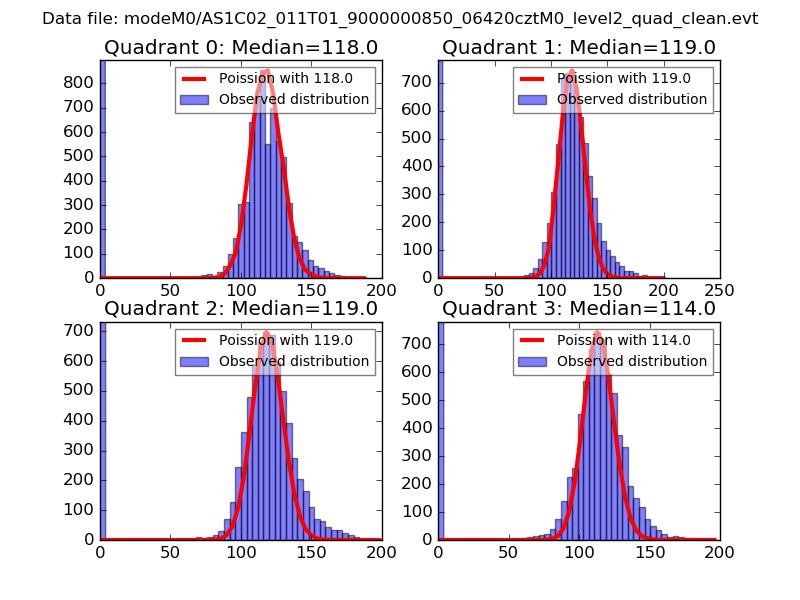 |
 |
| Quadrant-wise count rates Data is divided into 100 sec bins |
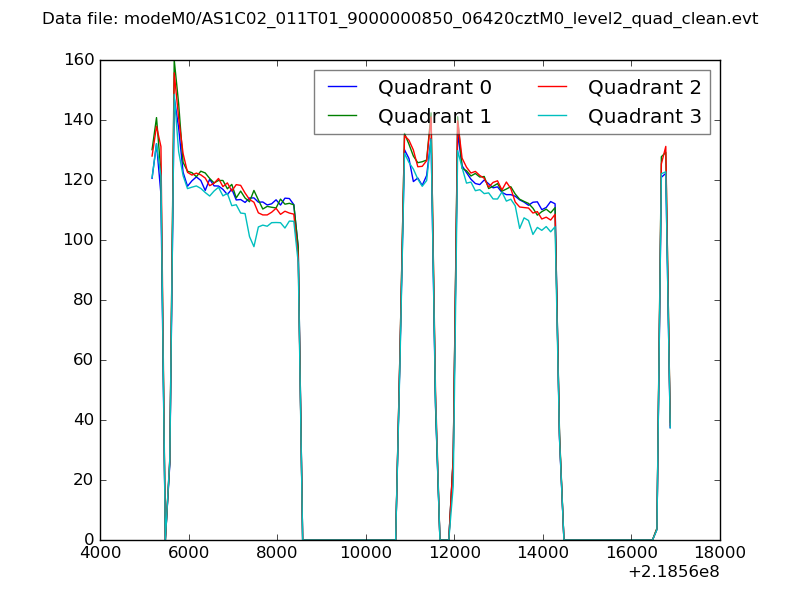 |
|
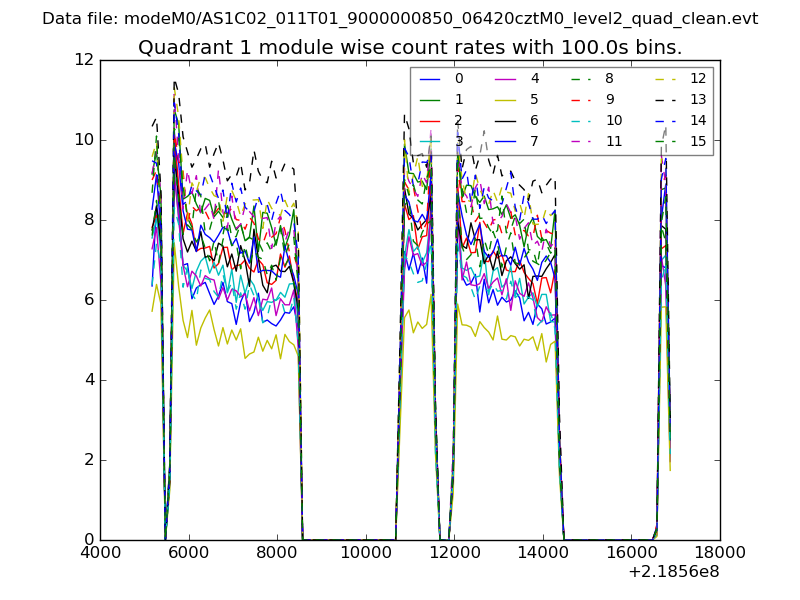
| Module-wise count rates for Quadrant A Data is divided into 100 sec bins |
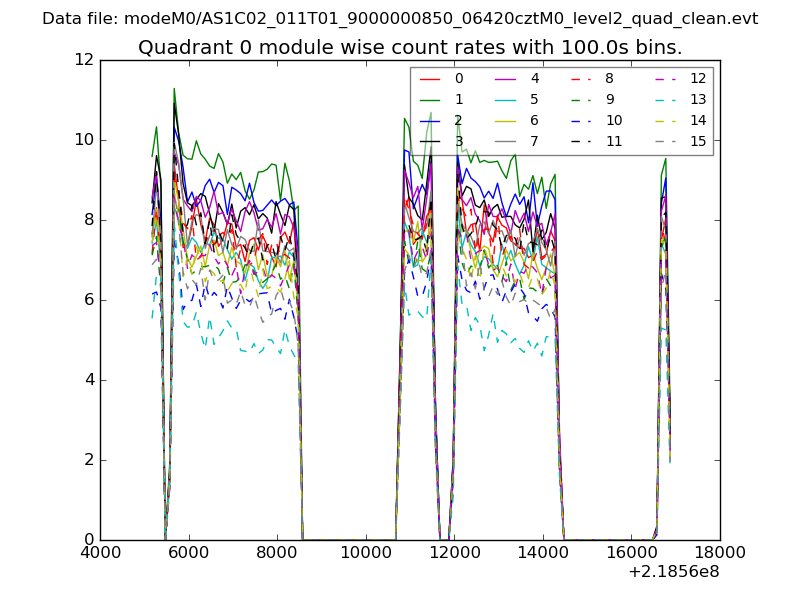 |
 |
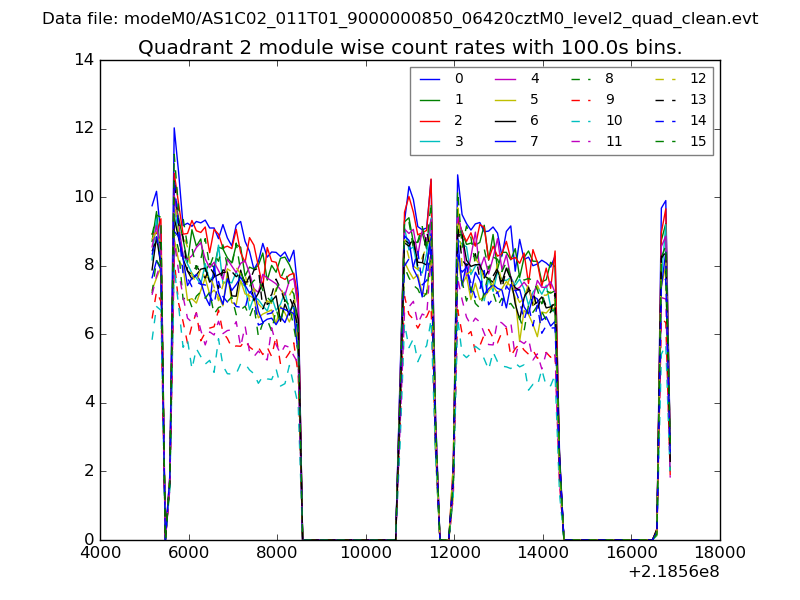
| Module-wise count rates for Quadrant B Data is divided into 100 sec bins |
 |
 |
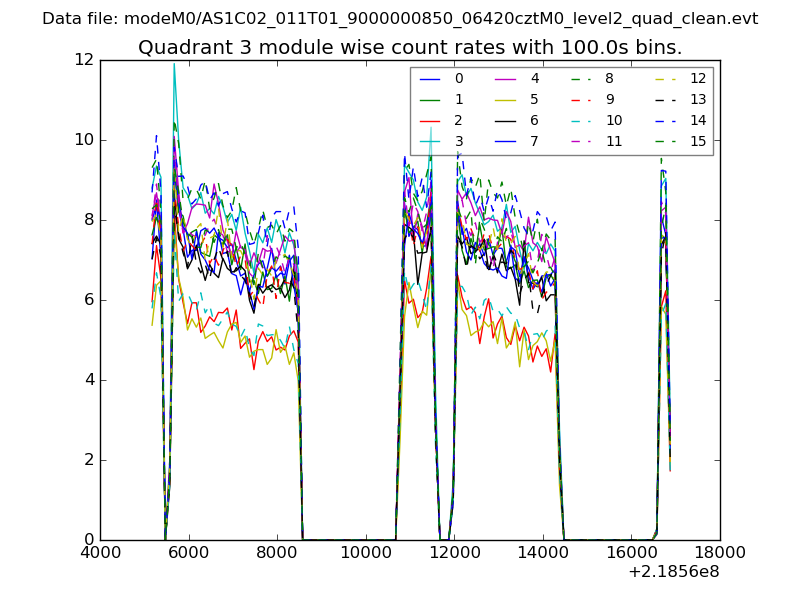
| Module-wise count rates for Quadrant C Data is divided into 100 sec bins |
 |
 |
| Module-wise count rates for Quadrant D Data is divided into 100 sec bins |
 |
 |
| Parameter | Plot |
|---|---|
| CZT HV Monitor | 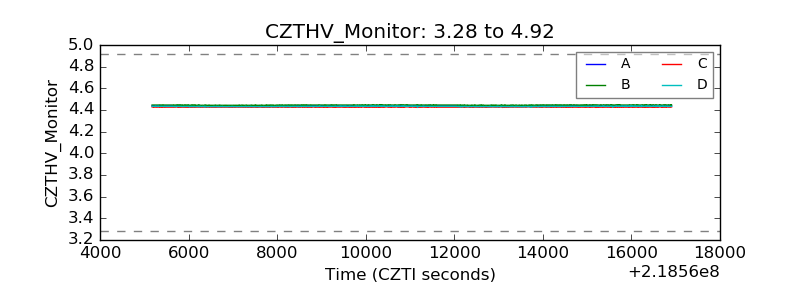 |
| D_VDD | 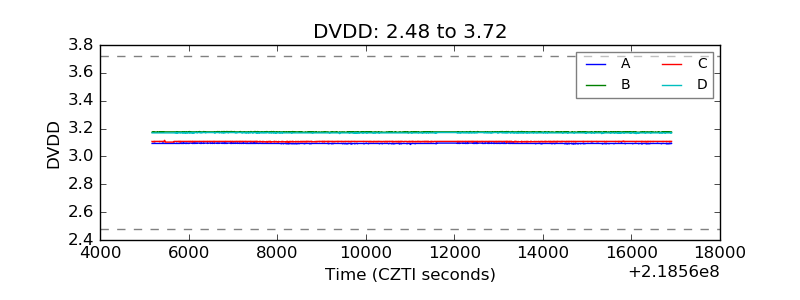 |
| Temperature 1 | 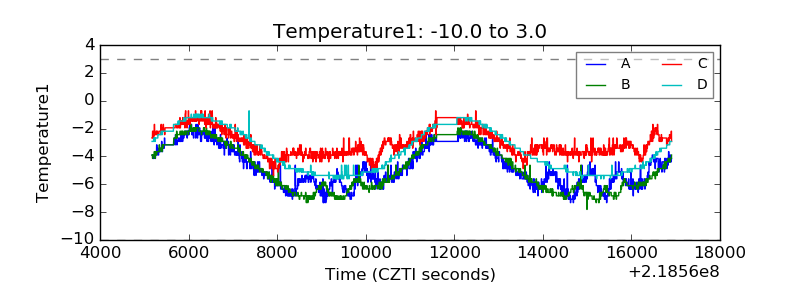 |
| Veto HV Monitor | 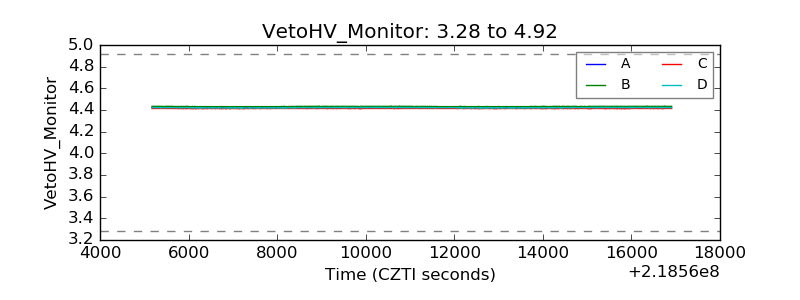 |
| Veto LLD | 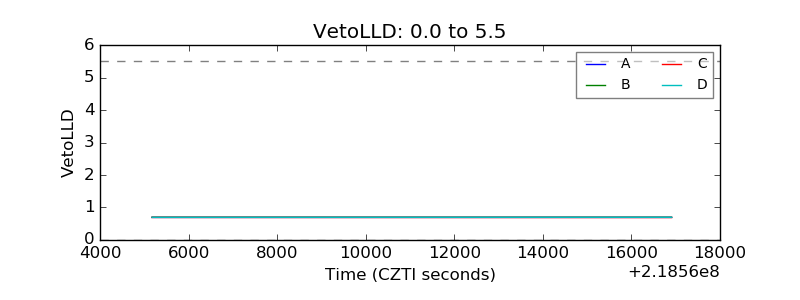 |
| Alpha Counter | 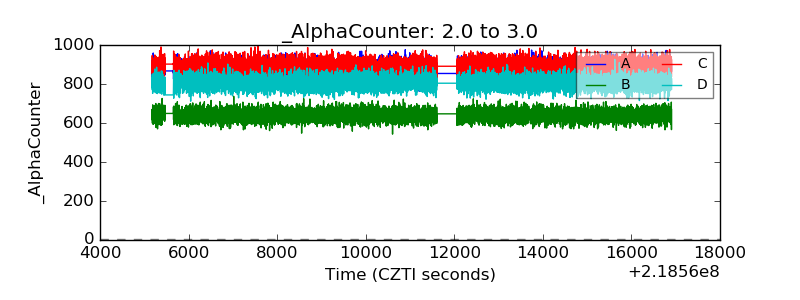 |
| _CPM_Rate | 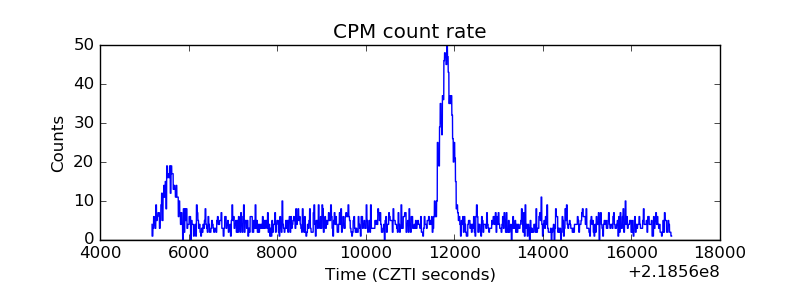 |
| CZT Counter | 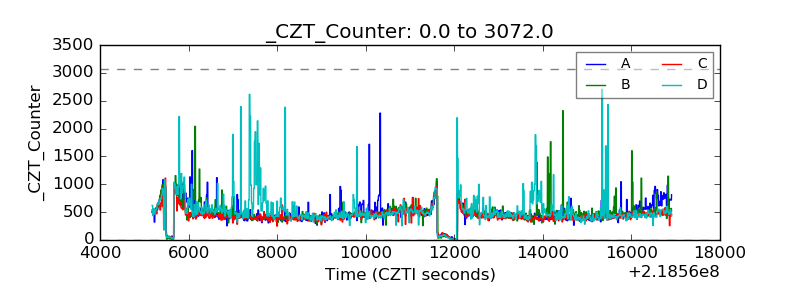 |
| +2.5 Volts monitor |  |
| +5 Volts monitor |  |
| _ROLL_ROT | 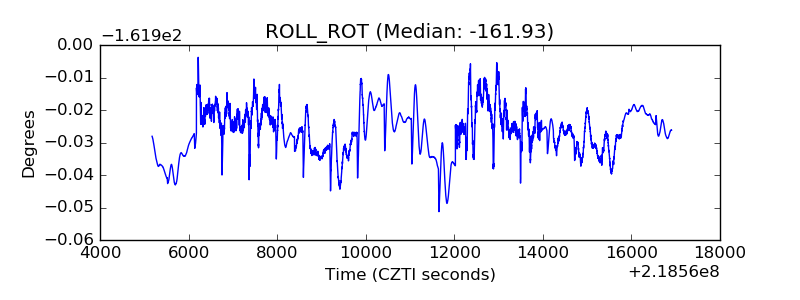 |
| _Roll_DEC | 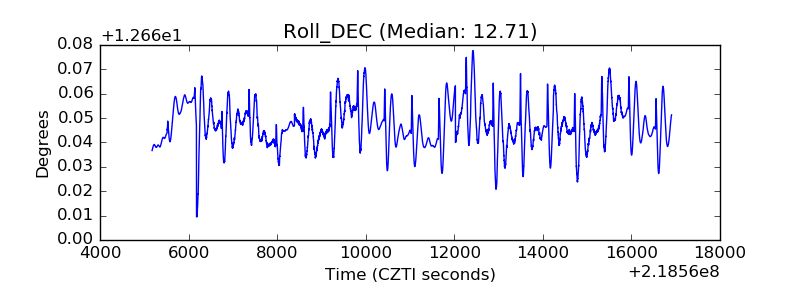 |
| _Roll_RA | 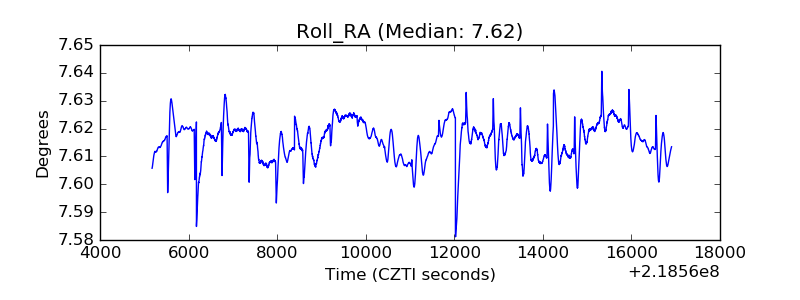 |
| Veto Counter | 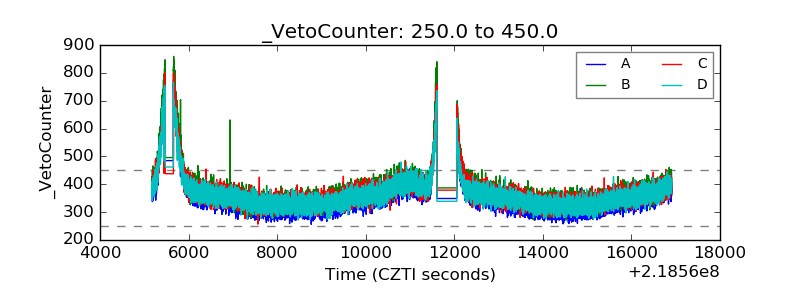 |