| Param | Original file | Final file |
|---|---|---|
| Filename | modeM0/AS1A02_191T02_9000000852cztM0_level2.fits | modeM0/AS1A02_191T02_9000000852cztM0_level2_quad_clean.evt |
| Size (bytes) | 720,725,760 | 768,015,360 |
| Size | 687.3 MB | 732.4 MB |
| Events in quadrant A | 4,316,308 | 4,634,723 |
| Events in quadrant B | 4,207,690 | 4,747,245 |
| Events in quadrant C | 4,247,058 | 4,423,385 |
| Events in quadrant D | 3,631,866 | 4,031,161 |
| Mode SS | |||
|---|---|---|---|
| Quadrant | BADHDUFLAG | Total packets | Discarded packets |
| A | 0 | 1616 | 0 |
| B | 0 | 1616 | 0 |
| C | 0 | 1616 | 0 |
| D | 0 | 1616 | 0 |
| Mode M0 | |||
|---|---|---|---|
| Quadrant | BADHDUFLAG | Total packets | Discarded packets |
| A | 0 | 161686 | 0 |
| B | 0 | 164050 | 0 |
| C | 0 | 160985 | 0 |
| D | 0 | 188995 | 0 |
| Mode M9 | |||
|---|---|---|---|
| Quadrant | BADHDUFLAG | Total packets | Discarded packets |
| A | 0 | 118 | 0 |
| B | 0 | 118 | 0 |
| C | 0 | 118 | 0 |
| D | 0 | 118 | 0 |
| Quadrant | Total seconds | Saturated seconds | Saturation percentage |
|---|---|---|---|
| A | 79099 | 684 | 0.864739% |
| B | 79099 | 787 | 0.994956% |
| C | 79099 | 412 | 0.520866% |
| D | 79099 | 1474 | 1.863488% |
Noise dominated data is calculated using 1-second bins in cleaned event files. If a bin has >2000 counts, and if more than 50% of those come from <1% of pixels, then it is considered to be noise-dominated and hence unusable.
| Quadrant | # 1 sec bins | Bins with >0 counts | Bins with >2000 counts | High rate bins dominated by noise | Noise dominated (total time) | Noise dominated (detector-on time) | Marked lightcurve |
|---|---|---|---|---|---|---|---|
| A | 90803 | 79098 | 0 | 0 | 0.00% | 0.00% |  |
| B | 90803 | 79096 | 0 | 0 | 0.00% | 0.00% | 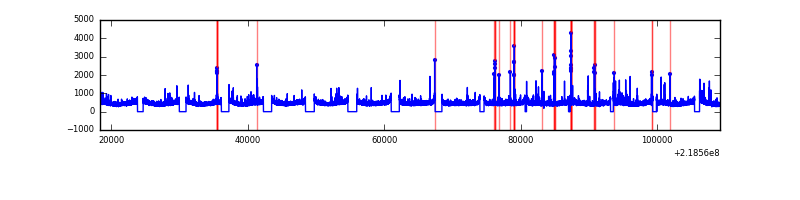 |
| C | 90803 | 79099 | 0 | 0 | 0.00% | 0.00% |  |
| D | 90803 | 79087 | 0 | 0 | 0.00% | 0.00% |  |
Top three noisy pixels from each quadrant. If the there are fewer than three noisy pixels in the level2.evt file, extra rows are filled as -1
| Pixel properties | Quadrant properties | ||||||
|---|---|---|---|---|---|---|---|
| Quadrant | DetID | PixID | Counts | Sigma | Mean | Median | Sigma |
| A | 0 | 29 | 4258 | 11.22 | 1121 | 1049 | 285.9 |
| A | 7 | 110 | 3732 | 9.38 | 1121 | 1049 | 285.9 |
| A | 0 | 30 | 3275 | 7.79 | 1121 | 1049 | 285.9 |
| B | 2 | 9 | 3697 | 11.74 | 1109 | 1056 | 224.9 |
| B | 12 | 226 | 2911 | 8.25 | 1109 | 1056 | 224.9 |
| B | 14 | 254 | 2907 | 8.23 | 1109 | 1056 | 224.9 |
| C | 1 | 80 | 3173 | 7.16 | 1120 | 1031 | 299.4 |
| C | 1 | 81 | 3150 | 7.08 | 1120 | 1031 | 299.4 |
| C | 12 | 241 | 2973 | 6.49 | 1120 | 1031 | 299.4 |
| D | 3 | 14 | 2715 | 6.4 | 1034 | 939 | 277.3 |
| D | 1 | 19 | 2610 | 6.02 | 1034 | 939 | 277.3 |
| D | 11 | 82 | 2594 | 5.97 | 1034 | 939 | 277.3 |
Histogram calculated using DETX and DETY for each event in the final _common_clean file
| Quadrant A |  |
 |
Quadrant B |
|---|---|---|---|
| Quadrant D | 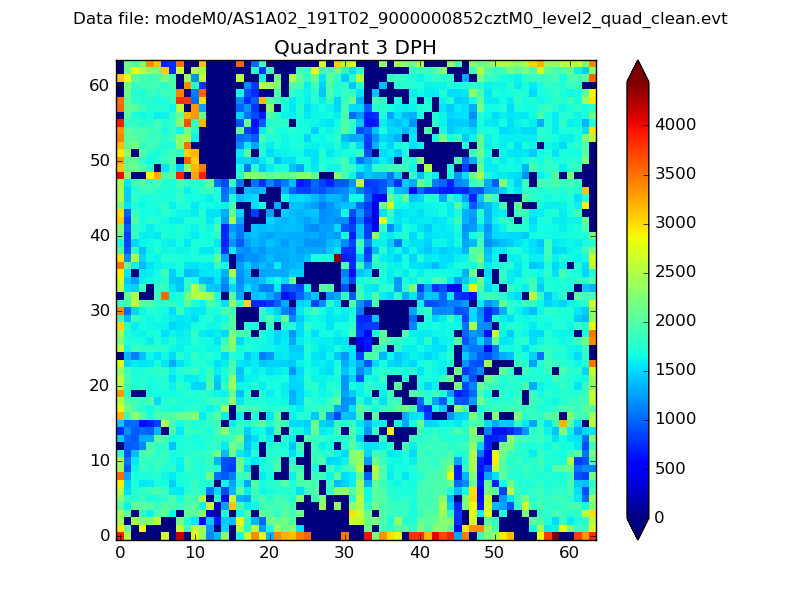 |
 |
Quadrant C |
| Plot type | Count rate plots | Images |
|---|---|---|
| Comparison with Poisson distribution Blue bars denote a histogram of data divided into 1 sec bins. Red curve is a Poisson curve with rate = median count rate of data. |
 |
 |
| Quadrant-wise count rates Data is divided into 100 sec bins |
 |
|
| Module-wise count rates for Quadrant A Data is divided into 100 sec bins |
 |
 |
| Module-wise count rates for Quadrant B Data is divided into 100 sec bins |
 |
 |
| Module-wise count rates for Quadrant C Data is divided into 100 sec bins |
 |
 |
| Module-wise count rates for Quadrant D Data is divided into 100 sec bins |
 |
 |
| Parameter | Plot |
|---|---|
| CZT HV Monitor |  |
| D_VDD |  |
| Temperature 1 |  |
| Veto HV Monitor |  |
| Veto LLD | 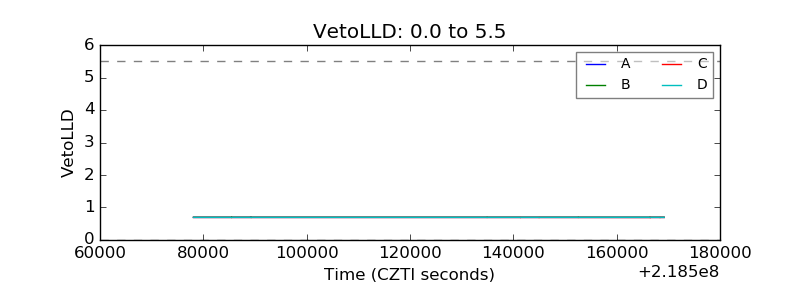 |
| Alpha Counter |  |
| _CPM_Rate |  |
| CZT Counter |  |
| +2.5 Volts monitor |  |
| +5 Volts monitor | 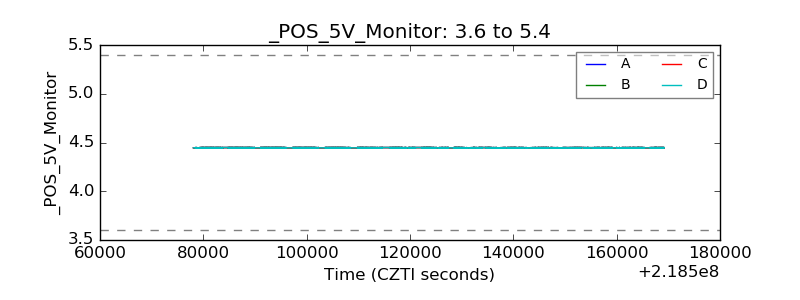 |
| _ROLL_ROT |  |
| _Roll_DEC |  |
| _Roll_RA |  |
| Veto Counter |  |