| Param | Original file | Final file |
|---|---|---|
| Filename | modeM0/AS1A02_191T02_9000000852_06421cztM0_level2.evt | modeM0/AS1A02_191T02_9000000852_06421cztM0_level2_quad_clean.evt |
| Size (bytes) | 452,387,520 | 88,358,400 |
| Size | 431.4 MB | 84.3 MB |
| Events in quadrant A | 3,150,297 | 549,788 |
| Events in quadrant B | 3,168,620 | 569,694 |
| Events in quadrant C | 3,032,773 | 553,267 |
| Events in quadrant D | 3,886,175 | 528,857 |
| Mode SS | |||
|---|---|---|---|
| Quadrant | BADHDUFLAG | Total packets | Discarded packets |
| A | 0 | 140 | 0 |
| B | 0 | 140 | 0 |
| C | 0 | 140 | 0 |
| D | 0 | 140 | 0 |
| Mode M0 | |||
|---|---|---|---|
| Quadrant | BADHDUFLAG | Total packets | Discarded packets |
| A | 0 | 14039 | 3 |
| B | 0 | 14001 | 2 |
| C | 0 | 13896 | 2 |
| D | 0 | 16571 | 2 |
| Mode M9 | |||
|---|---|---|---|
| Quadrant | BADHDUFLAG | Total packets | Discarded packets |
| A | 0 | 18 | 0 |
| B | 0 | 18 | 0 |
| C | 0 | 18 | 0 |
| D | 0 | 18 | 0 |
| Quadrant | Total seconds | Saturated seconds | Saturation percentage |
|---|---|---|---|
| A | 6805 | 41 | 0.602498% |
| B | 6805 | 50 | 0.734754% |
| C | 6805 | 33 | 0.484938% |
| D | 6805 | 116 | 1.704629% |
Noise dominated data is calculated using 1-second bins in cleaned event files. If a bin has >2000 counts, and if more than 50% of those come from <1% of pixels, then it is considered to be noise-dominated and hence unusable.
| Quadrant | # 1 sec bins | Bins with >0 counts | Bins with >2000 counts | High rate bins dominated by noise | Noise dominated (total time) | Noise dominated (detector-on time) | Marked lightcurve |
|---|---|---|---|---|---|---|---|
| A | 8635 | 6807 | 1 | 1 | 0.01% | 0.01% | 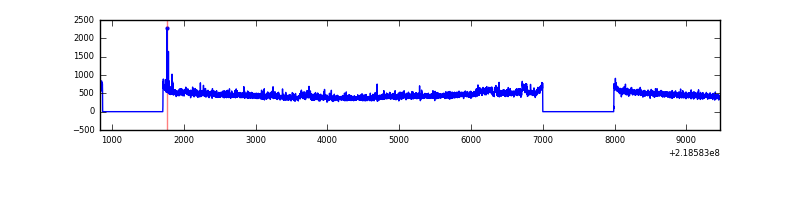 |
| B | 8635 | 6807 | 0 | 0 | 0.00% | 0.00% |  |
| C | 8635 | 6807 | 5 | 5 | 0.06% | 0.07% | 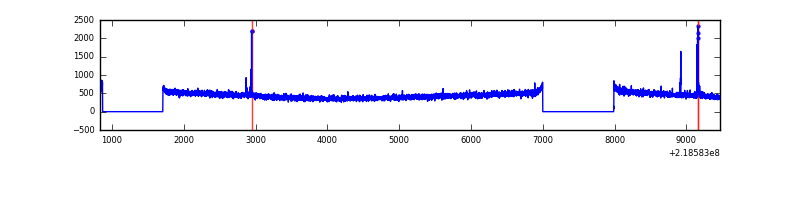 |
| D | 8635 | 6807 | 45 | 45 | 0.52% | 0.66% | 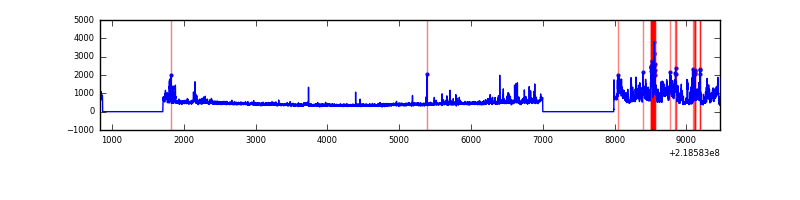 |
Top three noisy pixels from each quadrant. If the there are fewer than three noisy pixels in the level2.evt file, extra rows are filled as -1
| Pixel properties | Quadrant properties | ||||||
|---|---|---|---|---|---|---|---|
| Quadrant | DetID | PixID | Counts | Sigma | Mean | Median | Sigma |
| A | 8 | 15 | 64608 | 395.96 | 786 | 766 | 161.2 |
| A | 15 | 236 | 28819 | 173.99 | 786 | 766 | 161.2 |
| A | 13 | 251 | 22433 | 134.38 | 786 | 766 | 161.2 |
| B | 4 | 81 | 37239 | 237.62 | 796 | 776 | 153.5 |
| B | 8 | 3 | 22672 | 142.69 | 796 | 776 | 153.5 |
| B | 12 | 111 | 16082 | 99.74 | 796 | 776 | 153.5 |
| C | 9 | 54 | 36988 | 203.46 | 767 | 769 | 178.0 |
| C | 13 | 61 | 6122 | 30.07 | 767 | 769 | 178.0 |
| C | 8 | 222 | 2513 | 9.8 | 767 | 769 | 178.0 |
| D | 11 | 241 | 481434 | 2567.3 | 760 | 732 | 187.2 |
| D | 2 | 152 | 236609 | 1259.76 | 760 | 732 | 187.2 |
| D | 13 | 169 | 169536 | 901.54 | 760 | 732 | 187.2 |
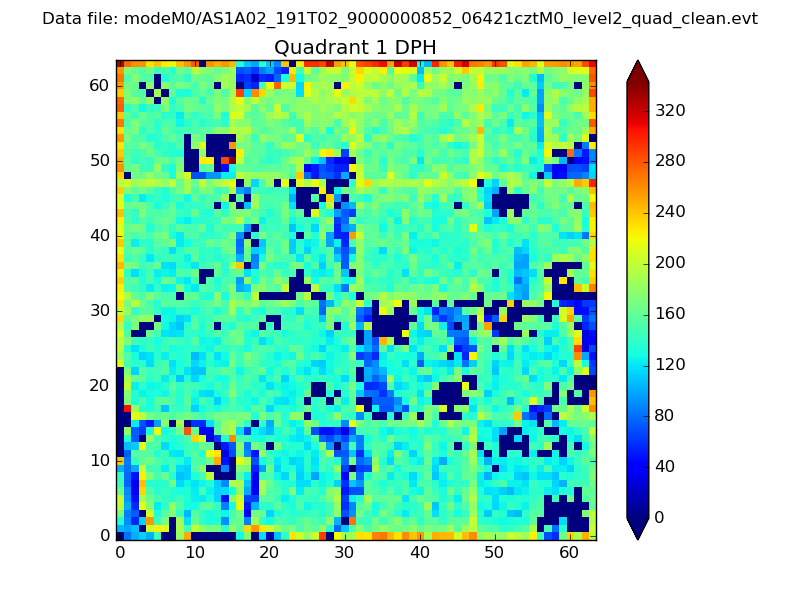
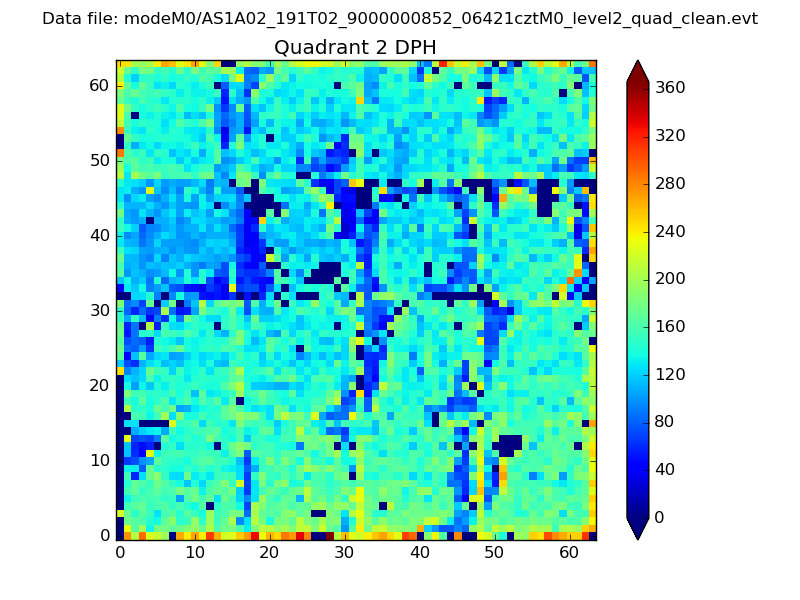
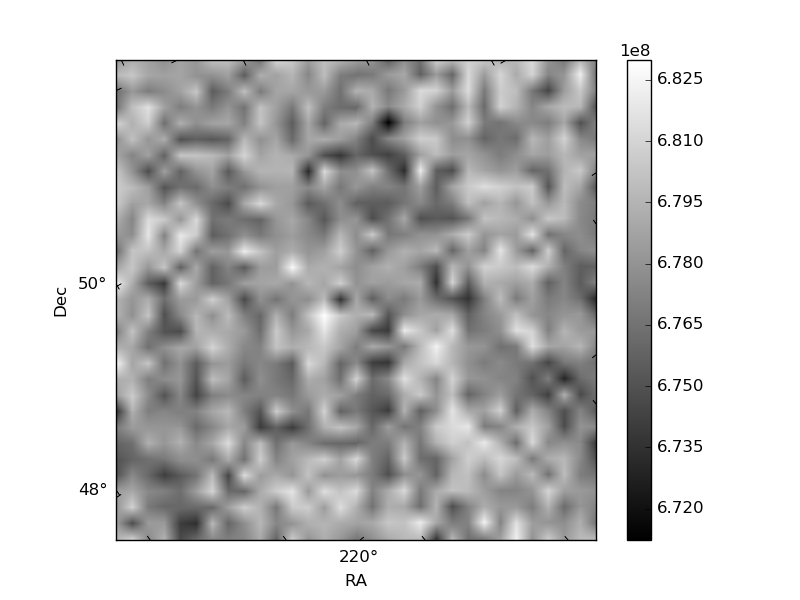
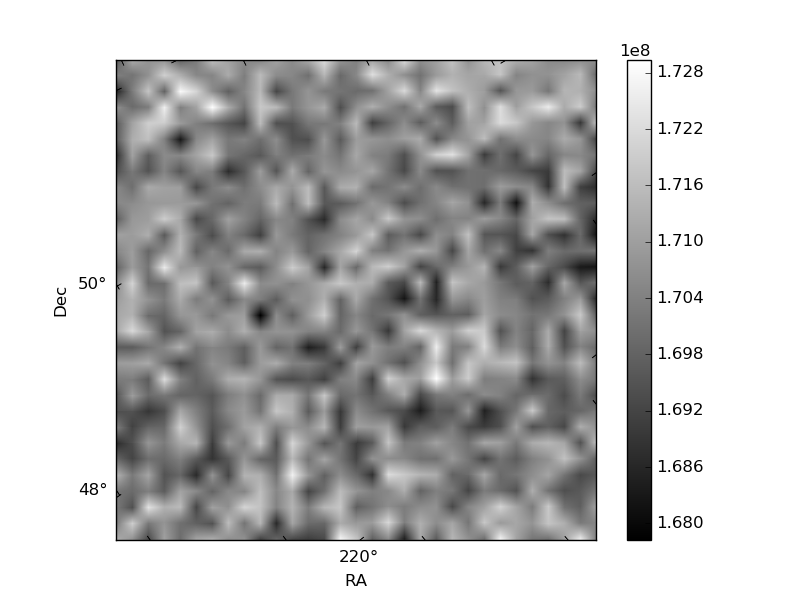
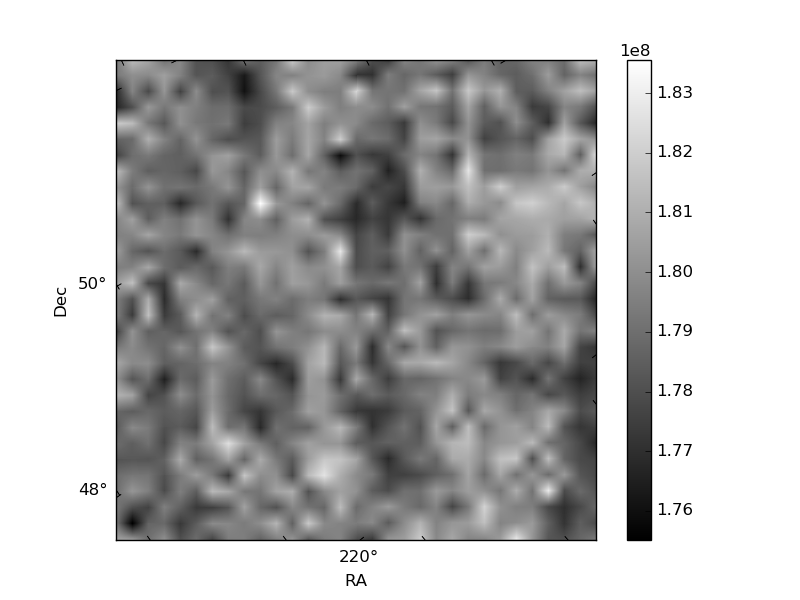
Histogram calculated using DETX and DETY for each event in the final _common_clean file
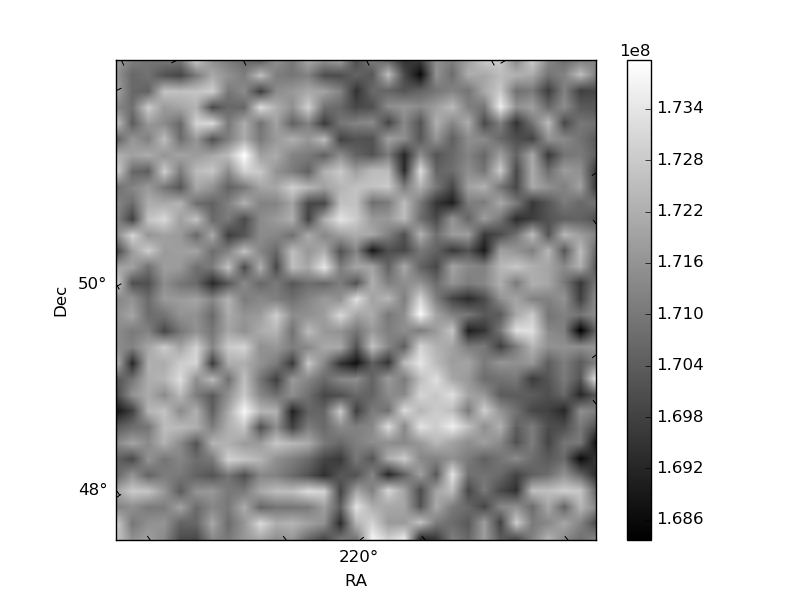
| Quadrant A | 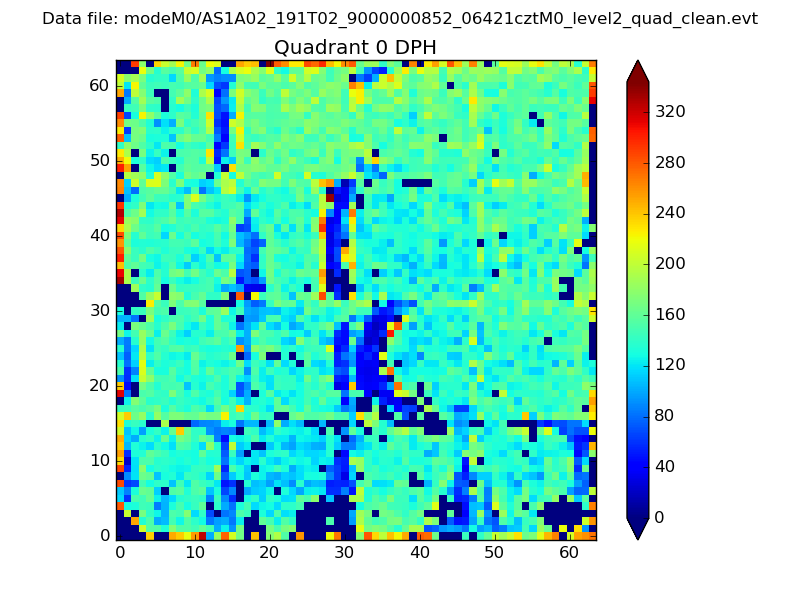 |
 |
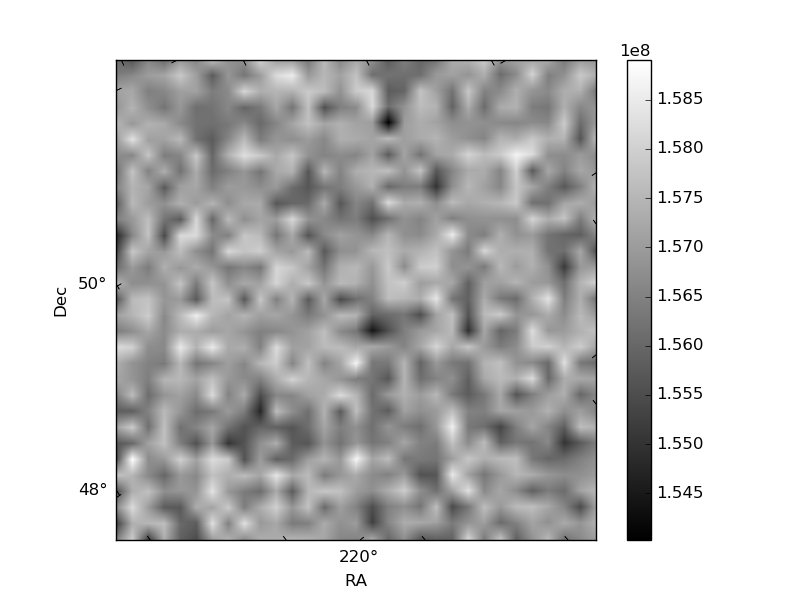
Quadrant B |
|---|---|---|---|
| Quadrant D | 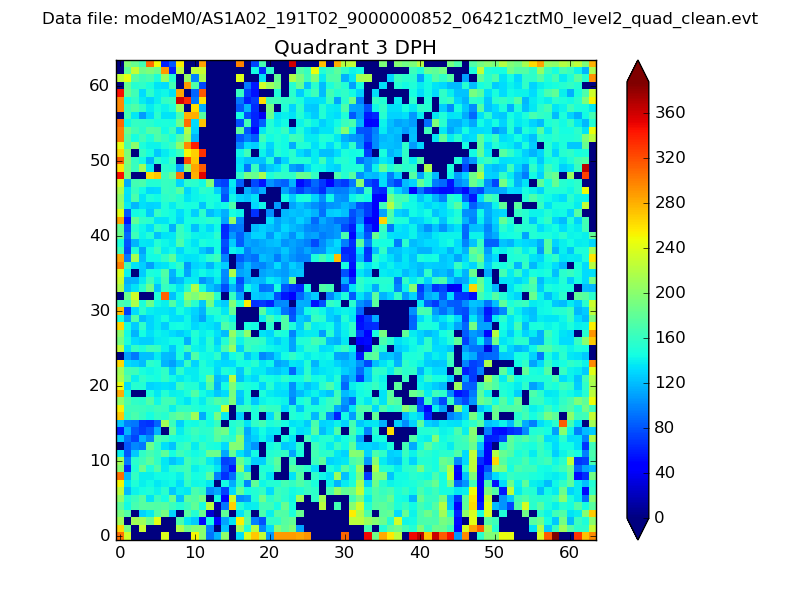 |
 |
Quadrant C |
| Plot type | Count rate plots | Images |
|---|---|---|
| Comparison with Poisson distribution Blue bars denote a histogram of data divided into 1 sec bins. Red curve is a Poisson curve with rate = median count rate of data. |
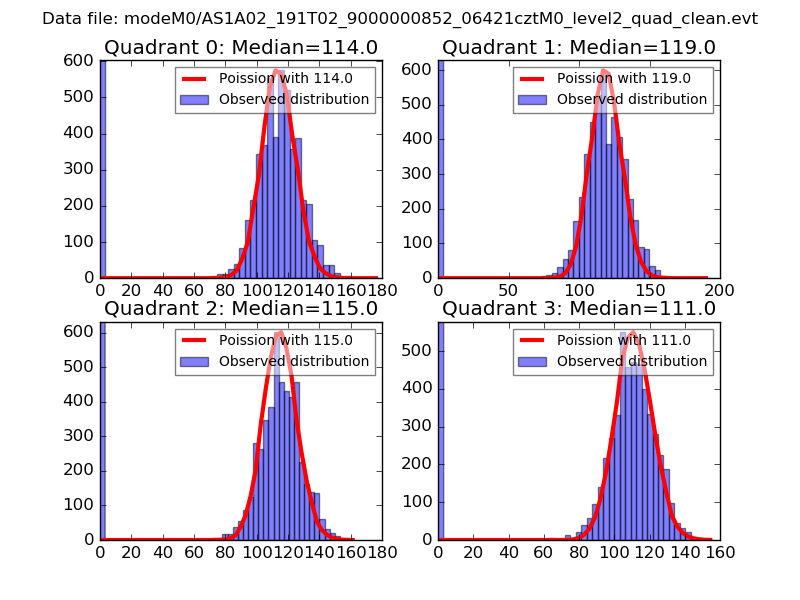 |
 |
| Quadrant-wise count rates Data is divided into 100 sec bins |
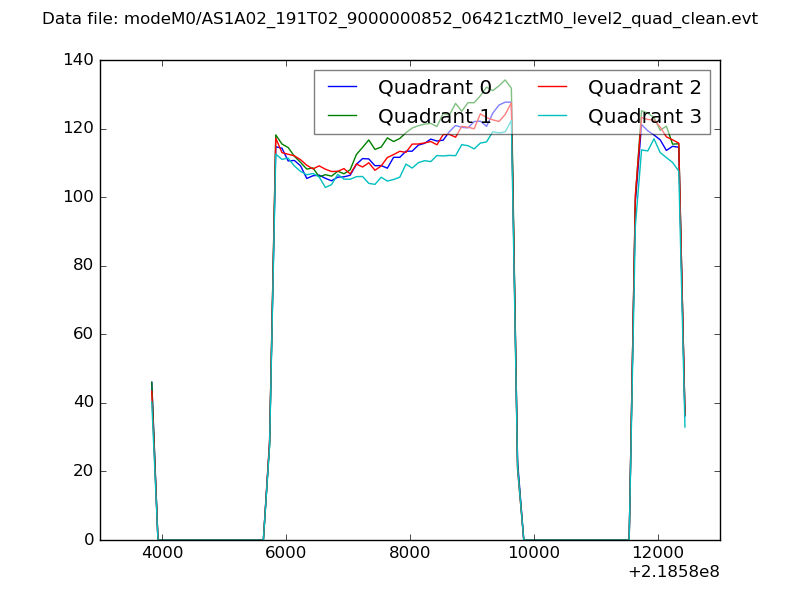 |
|
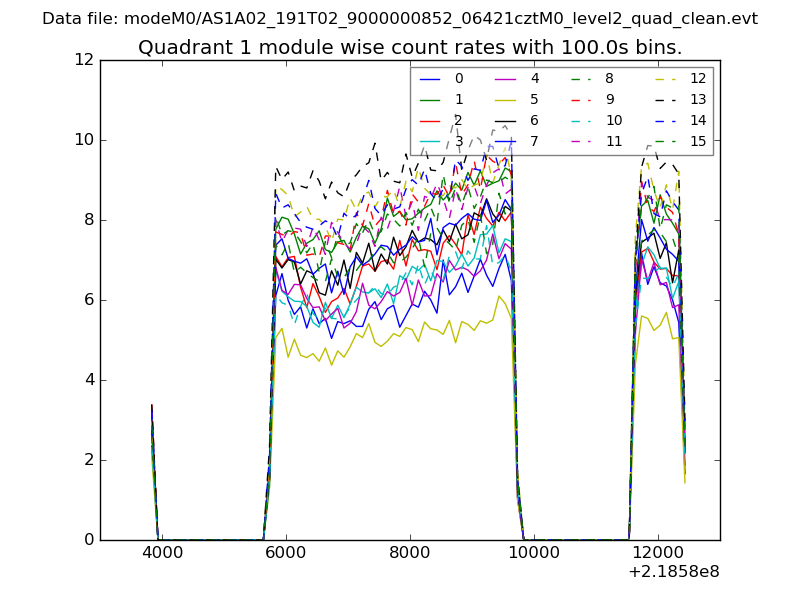
| Module-wise count rates for Quadrant A Data is divided into 100 sec bins |
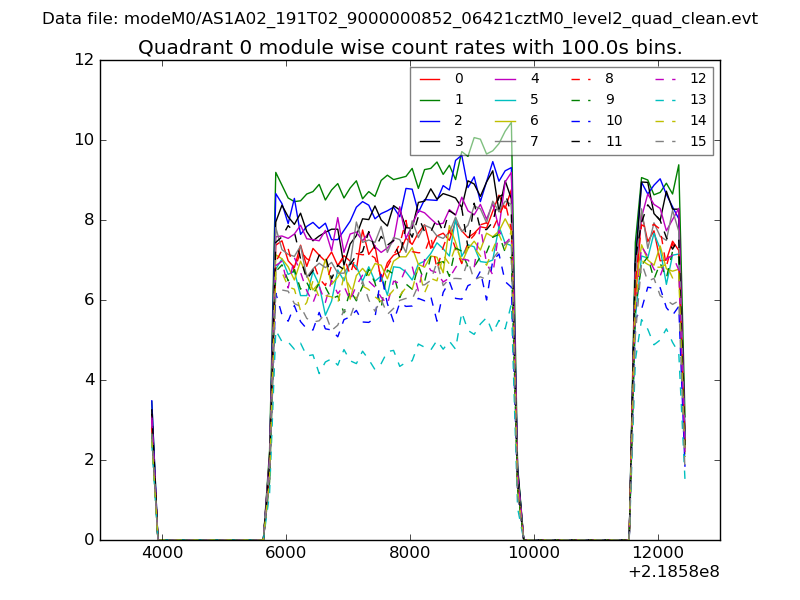 |
 |
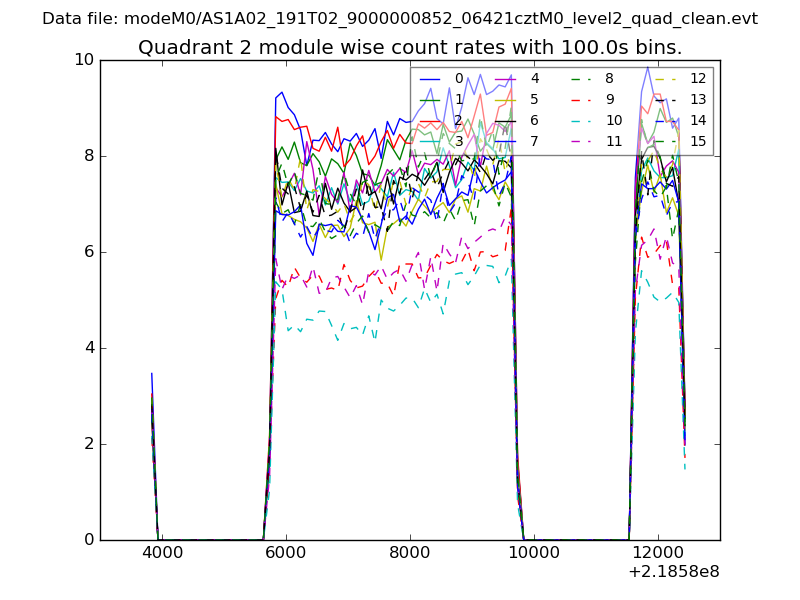
| Module-wise count rates for Quadrant B Data is divided into 100 sec bins |
 |
 |
| Module-wise count rates for Quadrant C Data is divided into 100 sec bins |
 |
 |
| Module-wise count rates for Quadrant D Data is divided into 100 sec bins |
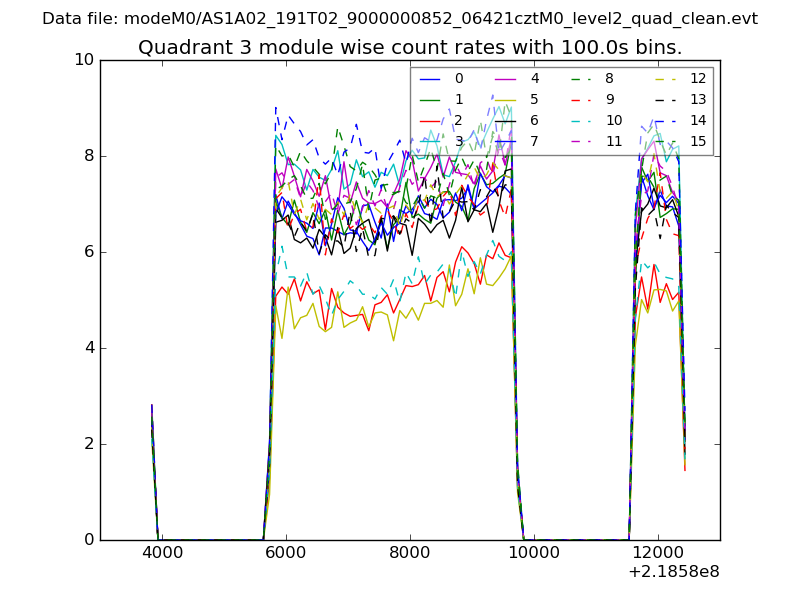 |
 |
| Parameter | Plot |
|---|---|
| CZT HV Monitor | 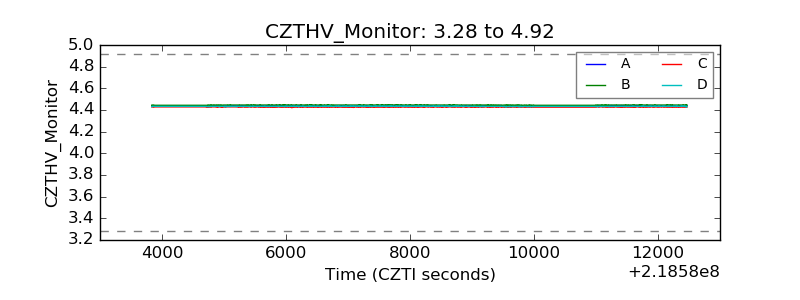 |
| D_VDD | 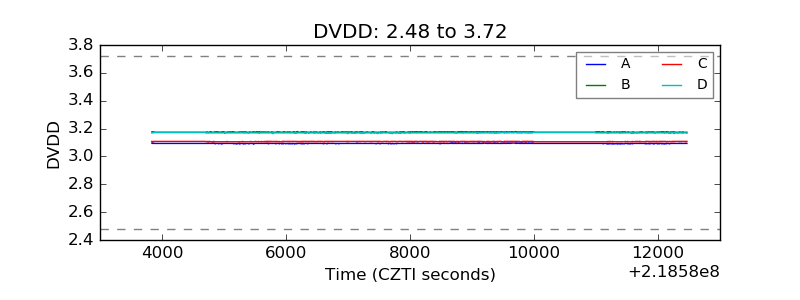 |
| Temperature 1 | 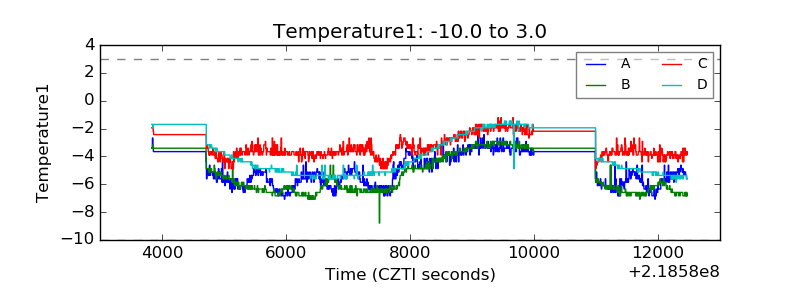 |
| Veto HV Monitor | 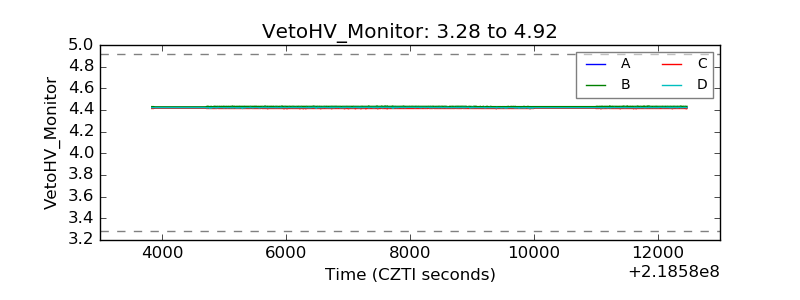 |
| Veto LLD | 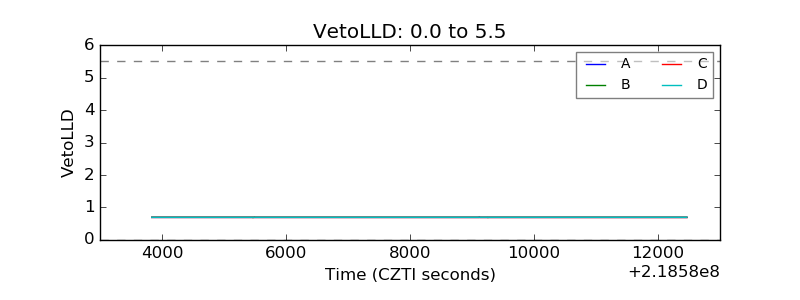 |
| Alpha Counter | 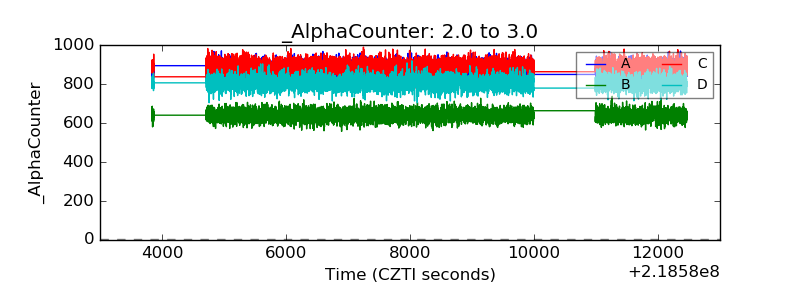 |
| _CPM_Rate | 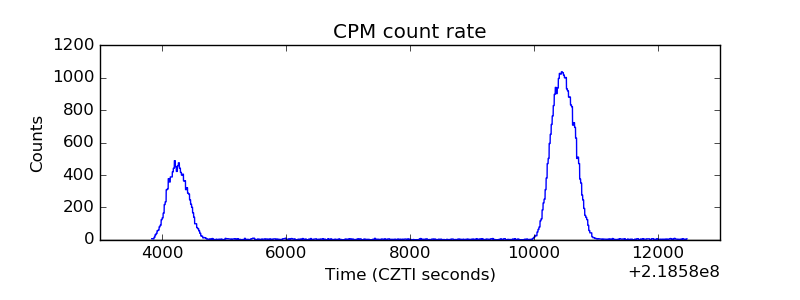 |
| CZT Counter | 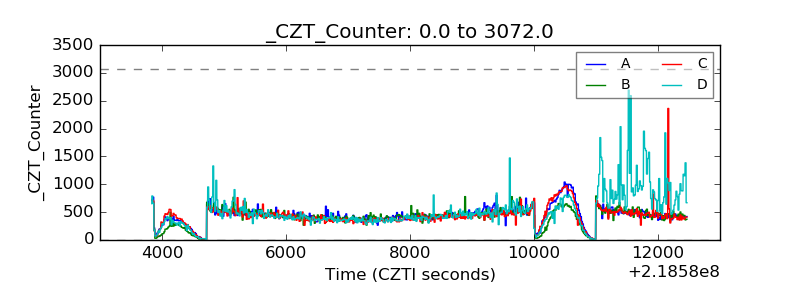 |
| +2.5 Volts monitor | 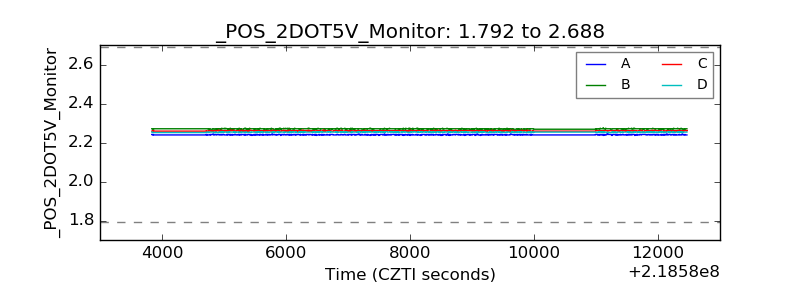 |
| +5 Volts monitor |  |
| _ROLL_ROT | 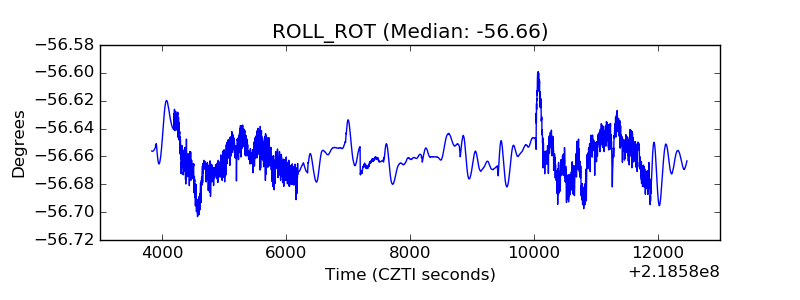 |
| _Roll_DEC | 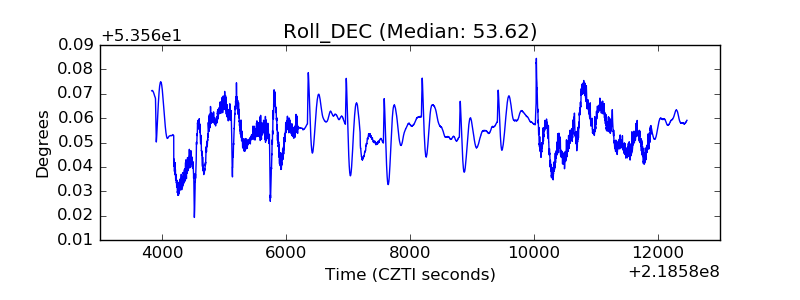 |
| _Roll_RA | 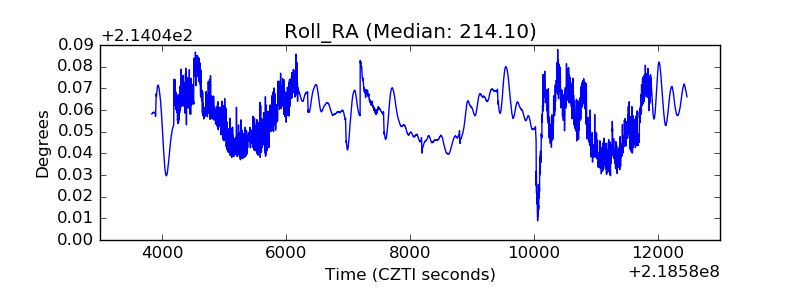 |
| Veto Counter | 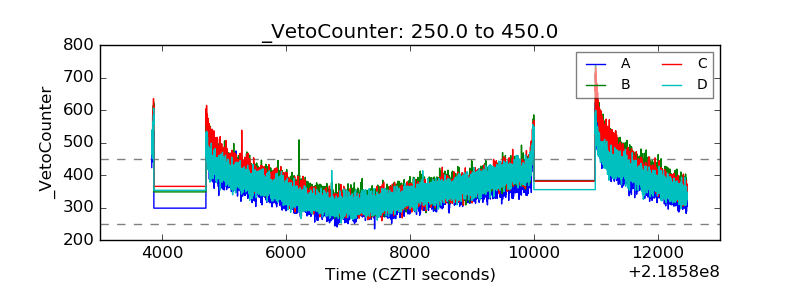 |