| Param | Original file | Final file |
|---|---|---|
| Filename | modeM0/AS1A02_191T02_9000000852_06423cztM0_level2.evt | modeM0/AS1A02_191T02_9000000852_06423cztM0_level2_quad_clean.evt |
| Size (bytes) | 489,936,960 | 94,775,040 |
| Size | 467.2 MB | 90.4 MB |
| Events in quadrant A | 3,021,500 | 605,803 |
| Events in quadrant B | 3,176,097 | 626,642 |
| Events in quadrant C | 2,985,463 | 607,516 |
| Events in quadrant D | 5,202,859 | 566,083 |
| Mode SS | |||
|---|---|---|---|
| Quadrant | BADHDUFLAG | Total packets | Discarded packets |
| A | 0 | 138 | 0 |
| B | 0 | 138 | 0 |
| C | 0 | 138 | 0 |
| D | 0 | 138 | 0 |
| Mode M0 | |||
|---|---|---|---|
| Quadrant | BADHDUFLAG | Total packets | Discarded packets |
| A | 0 | 13628 | 3 |
| B | 0 | 13935 | 2 |
| C | 0 | 13651 | 2 |
| D | 0 | 20065 | 2 |
| Mode M9 | |||
|---|---|---|---|
| Quadrant | BADHDUFLAG | Total packets | Discarded packets |
| A | 0 | 20 | 0 |
| B | 0 | 20 | 0 |
| C | 0 | 20 | 0 |
| D | 0 | 20 | 0 |
| Quadrant | Total seconds | Saturated seconds | Saturation percentage |
|---|---|---|---|
| A | 6652 | 33 | 0.496091% |
| B | 6652 | 57 | 0.856885% |
| C | 6652 | 17 | 0.255562% |
| D | 6652 | 248 | 3.728202% |
Noise dominated data is calculated using 1-second bins in cleaned event files. If a bin has >2000 counts, and if more than 50% of those come from <1% of pixels, then it is considered to be noise-dominated and hence unusable.
| Quadrant | # 1 sec bins | Bins with >0 counts | Bins with >2000 counts | High rate bins dominated by noise | Noise dominated (total time) | Noise dominated (detector-on time) | Marked lightcurve |
|---|---|---|---|---|---|---|---|
| A | 8752 | 6654 | 0 | 0 | 0.00% | 0.00% |  |
| B | 8752 | 6654 | 5 | 5 | 0.06% | 0.08% | 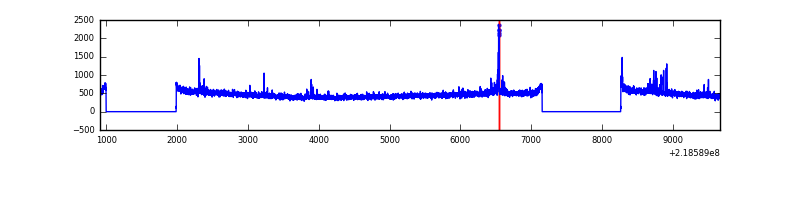 |
| C | 8752 | 6654 | 3 | 3 | 0.03% | 0.05% | 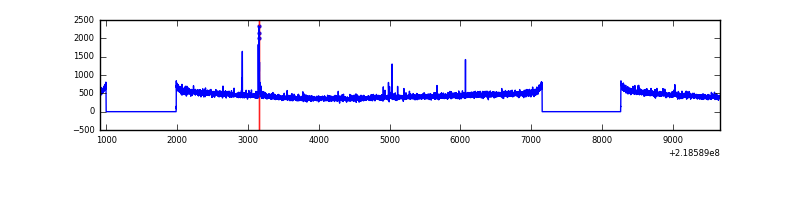 |
| D | 8752 | 6654 | 169 | 169 | 1.93% | 2.54% | 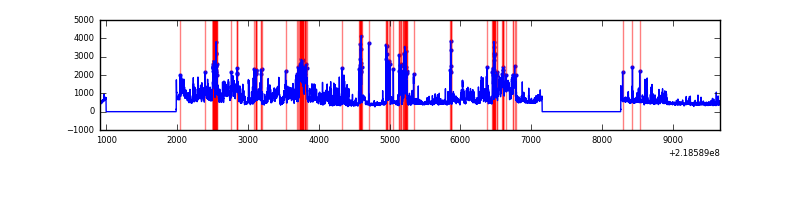 |
Top three noisy pixels from each quadrant. If the there are fewer than three noisy pixels in the level2.evt file, extra rows are filled as -1
| Pixel properties | Quadrant properties | ||||||
|---|---|---|---|---|---|---|---|
| Quadrant | DetID | PixID | Counts | Sigma | Mean | Median | Sigma |
| A | 8 | 15 | 15364 | 91.68 | 777 | 760 | 159.3 |
| A | 13 | 14 | 7404 | 41.71 | 777 | 760 | 159.3 |
| A | 0 | 226 | 7395 | 41.65 | 777 | 760 | 159.3 |
| B | 4 | 81 | 42594 | 281.24 | 787 | 770 | 148.7 |
| B | 15 | 204 | 31650 | 207.65 | 787 | 770 | 148.7 |
| B | 3 | 220 | 28160 | 184.18 | 787 | 770 | 148.7 |
| C | 9 | 54 | 34210 | 192.1 | 755 | 756 | 174.1 |
| C | 13 | 61 | 5639 | 28.04 | 755 | 756 | 174.1 |
| C | 8 | 208 | 3568 | 16.15 | 755 | 756 | 174.1 |
| D | 11 | 241 | 1056641 | 5841.6 | 739 | 712 | 180.8 |
| D | 13 | 169 | 675300 | 3731.95 | 739 | 712 | 180.8 |
| D | 2 | 152 | 521909 | 2883.36 | 739 | 712 | 180.8 |
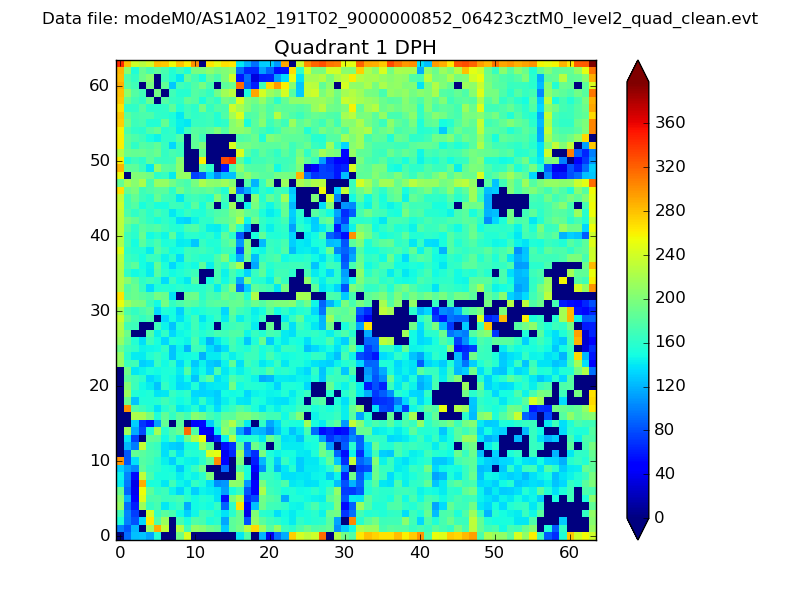
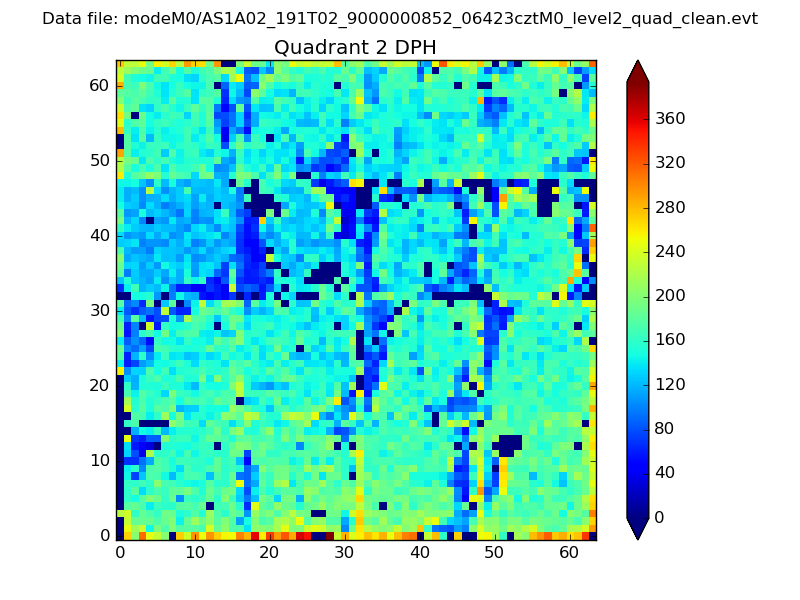
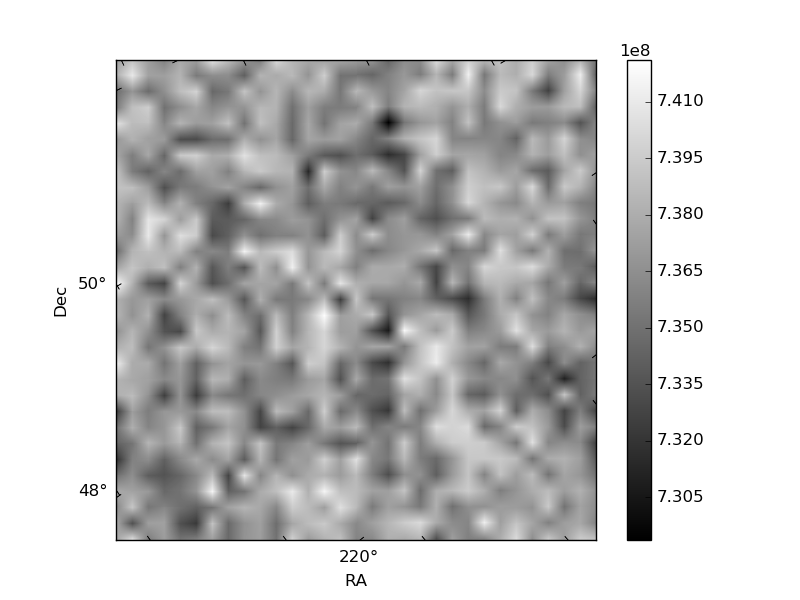
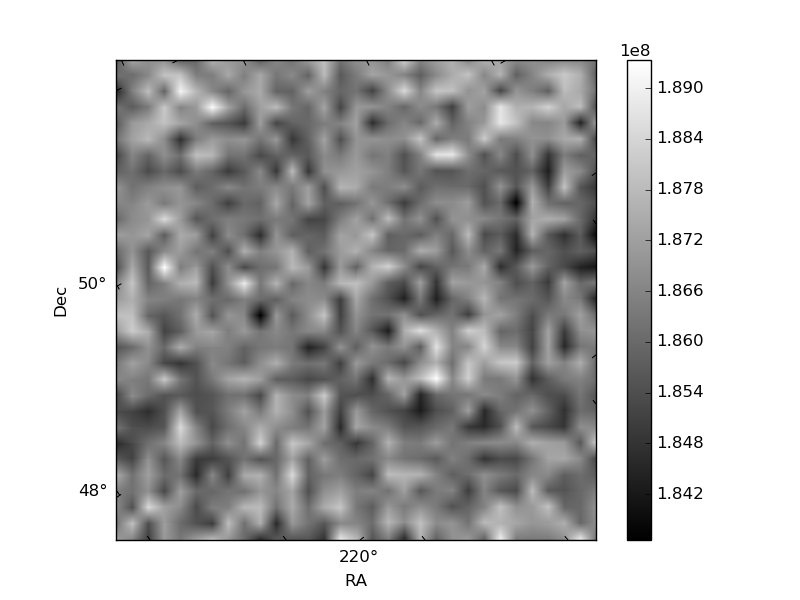
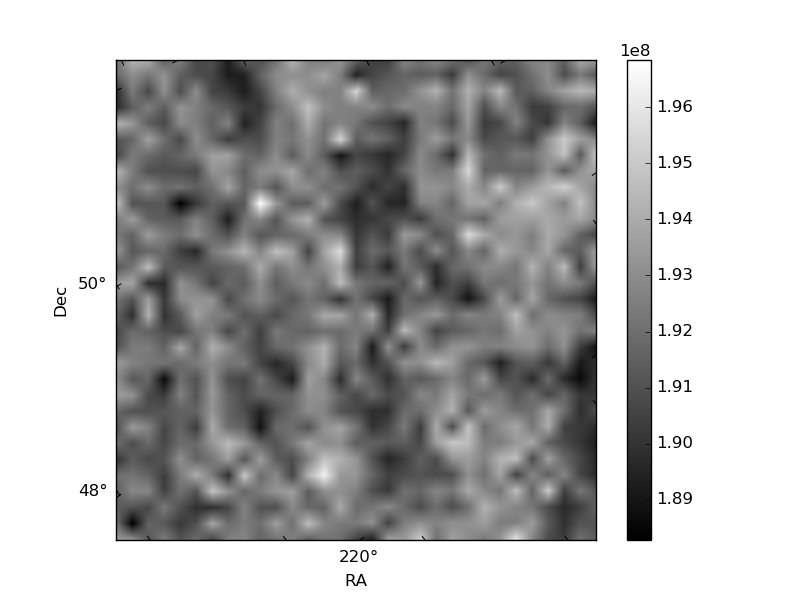
Histogram calculated using DETX and DETY for each event in the final _common_clean file
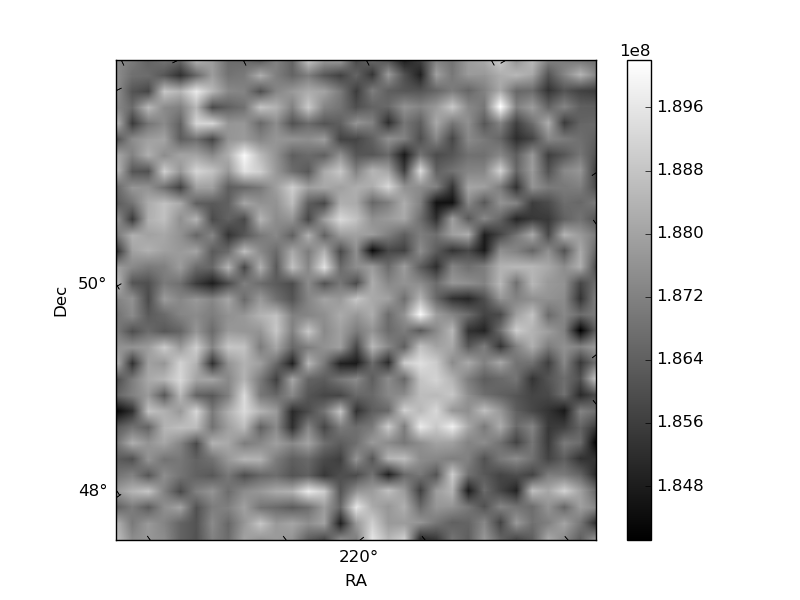
| Quadrant A | 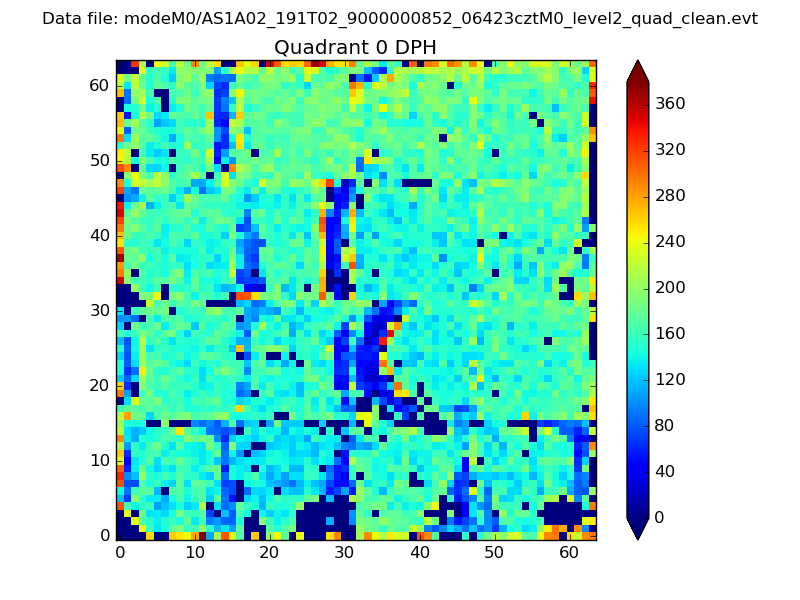 |
 |
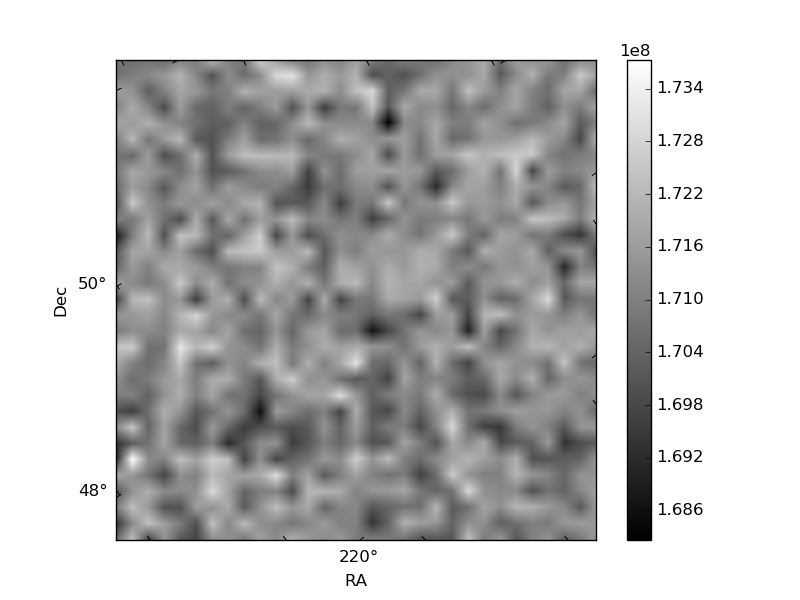
Quadrant B |
|---|---|---|---|
| Quadrant D | 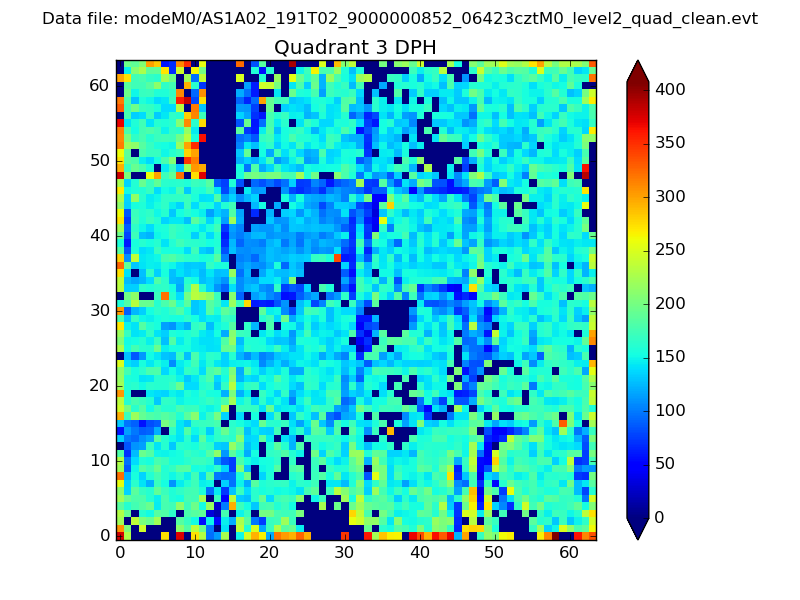 |
 |
Quadrant C |
| Plot type | Count rate plots | Images |
|---|---|---|
| Comparison with Poisson distribution Blue bars denote a histogram of data divided into 1 sec bins. Red curve is a Poisson curve with rate = median count rate of data. |
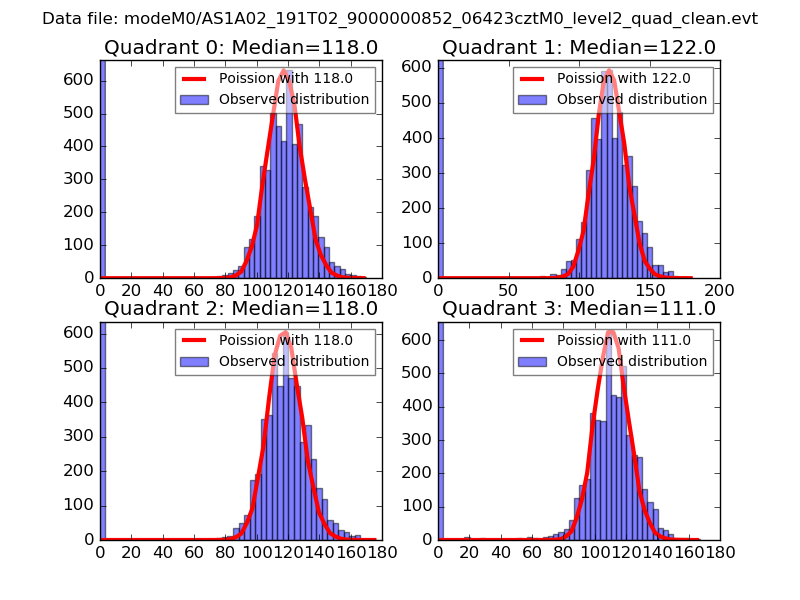 |
 |
| Quadrant-wise count rates Data is divided into 100 sec bins |
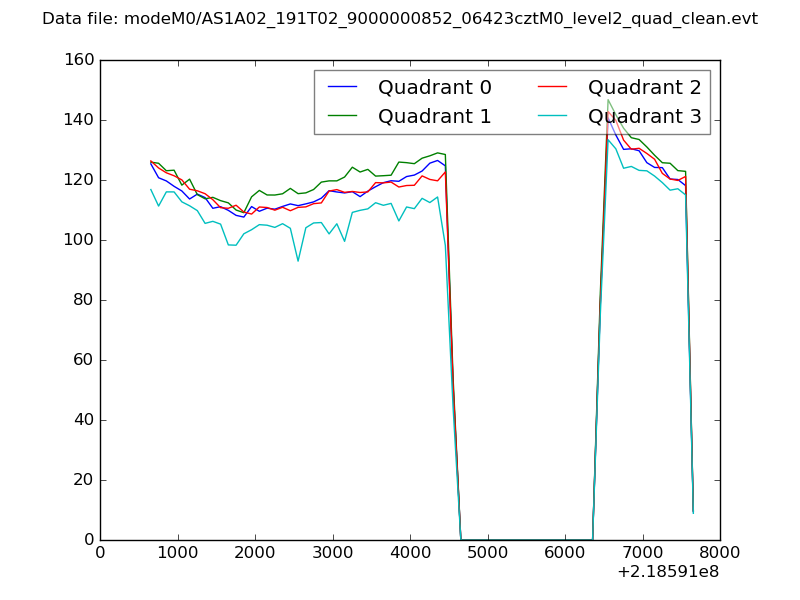 |
|
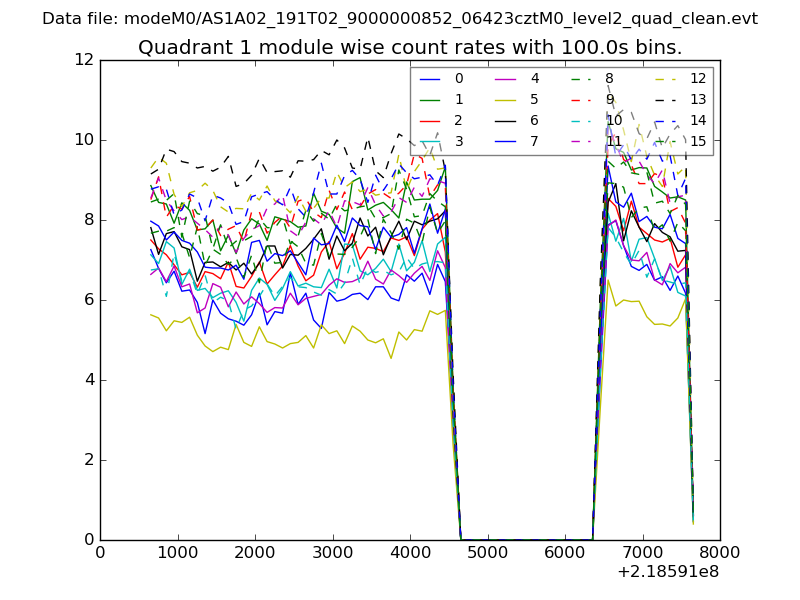
| Module-wise count rates for Quadrant A Data is divided into 100 sec bins |
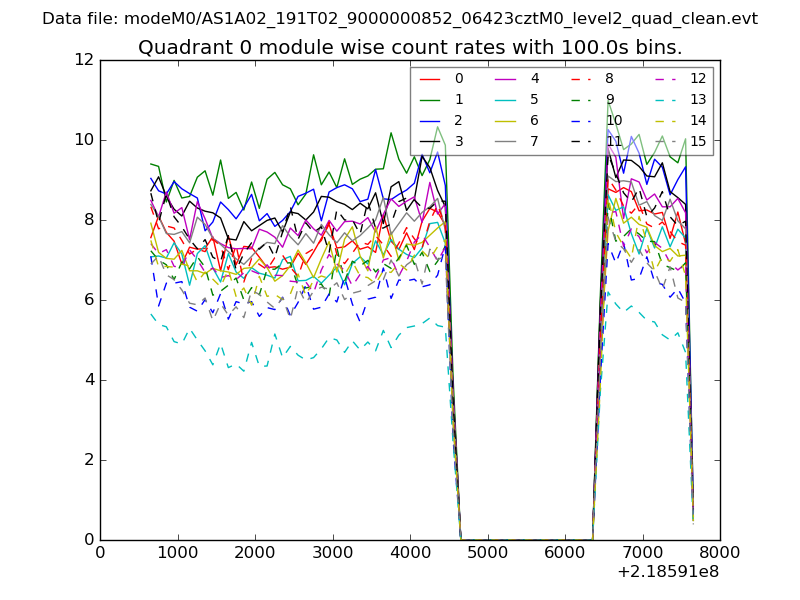 |
 |
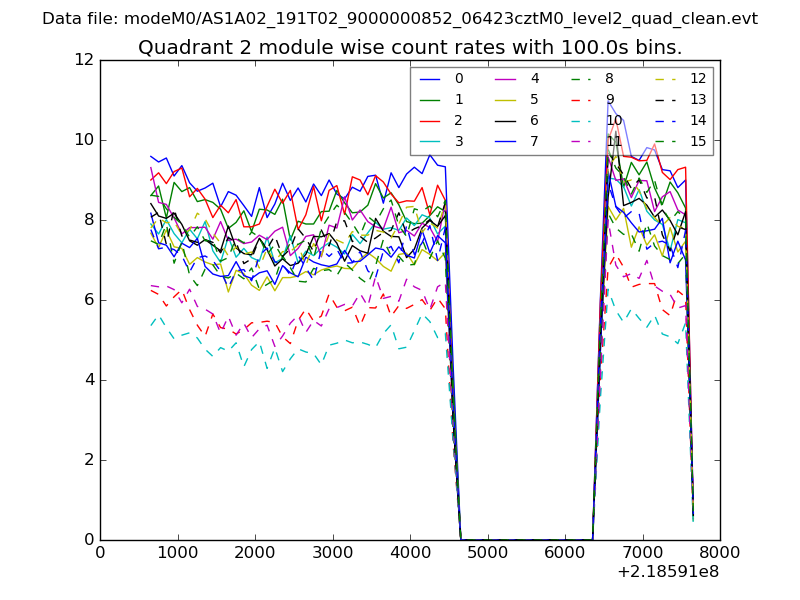
| Module-wise count rates for Quadrant B Data is divided into 100 sec bins |
 |
 |
| Module-wise count rates for Quadrant C Data is divided into 100 sec bins |
 |
 |
| Module-wise count rates for Quadrant D Data is divided into 100 sec bins |
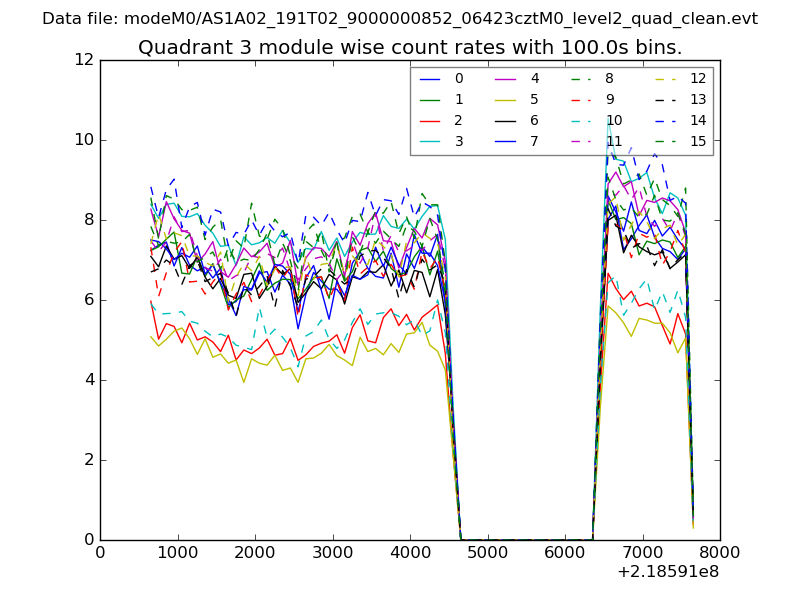 |
 |
| Parameter | Plot |
|---|---|
| CZT HV Monitor | 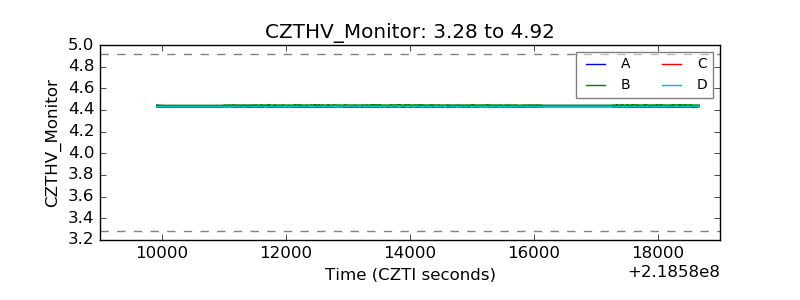 |
| D_VDD | 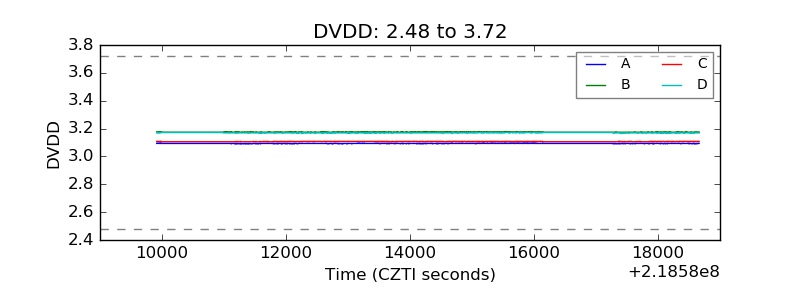 |
| Temperature 1 | 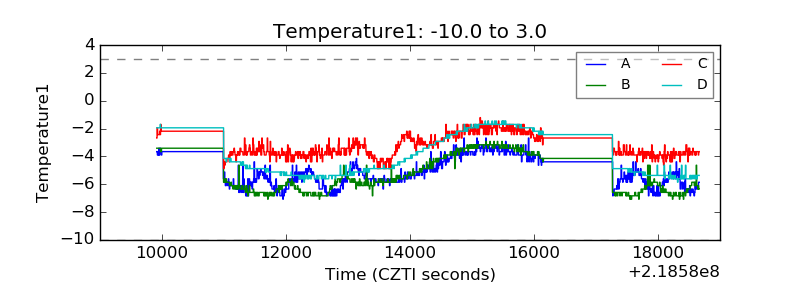 |
| Veto HV Monitor | 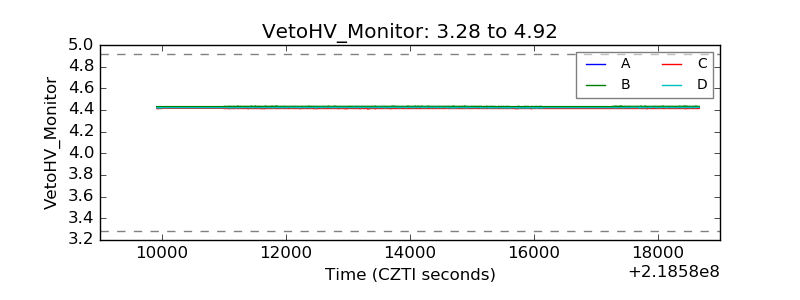 |
| Veto LLD | 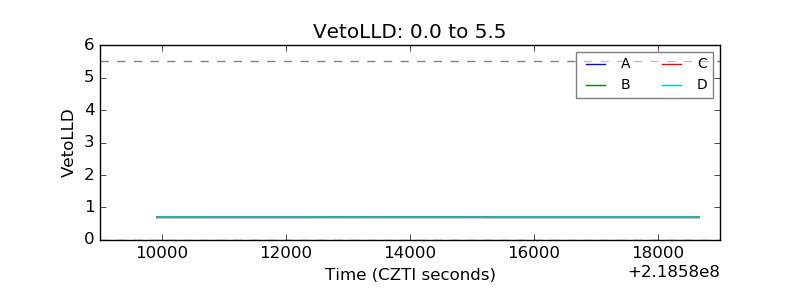 |
| Alpha Counter | 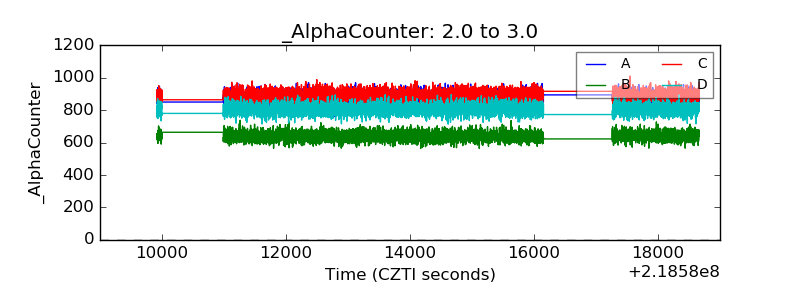 |
| _CPM_Rate | 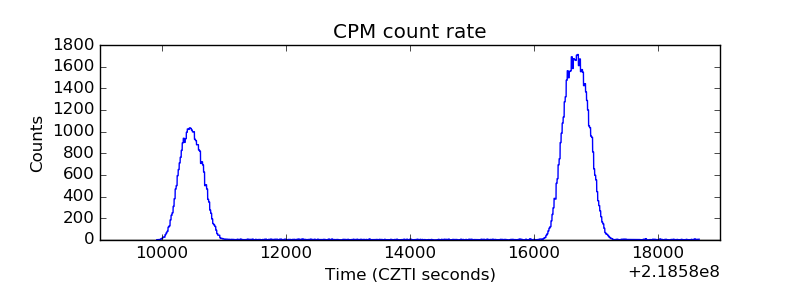 |
| CZT Counter | 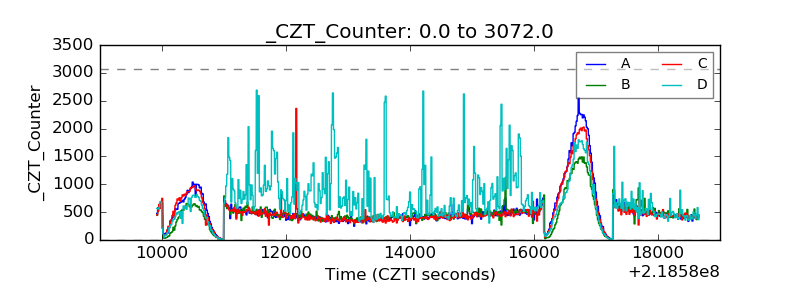 |
| +2.5 Volts monitor |  |
| +5 Volts monitor |  |
| _ROLL_ROT | 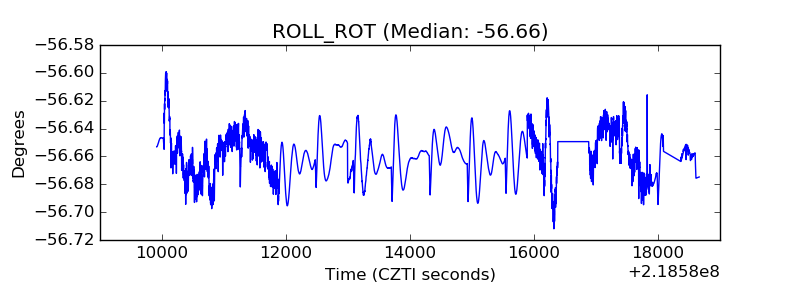 |
| _Roll_DEC |  |
| _Roll_RA | 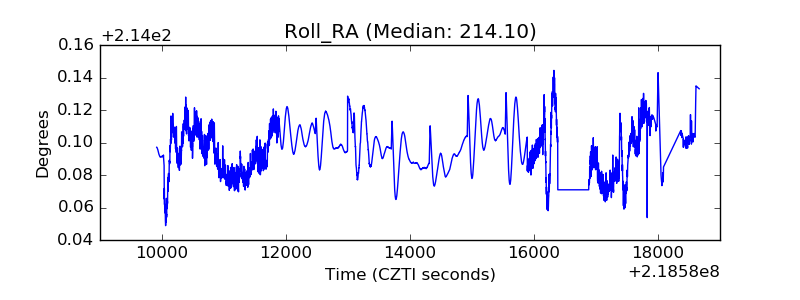 |
| Veto Counter | 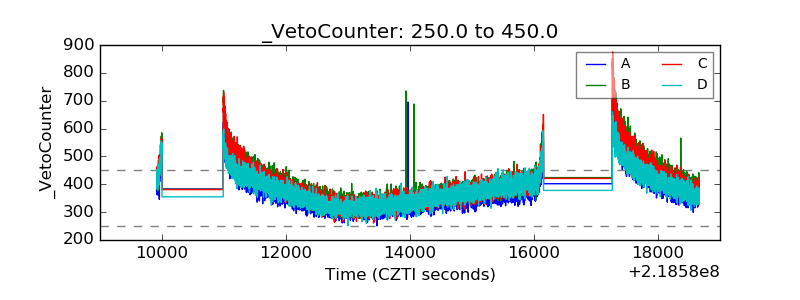 |