| Param | Original file | Final file |
|---|---|---|
| Filename | modeM0/AS1A02_191T02_9000000852_06428cztM0_level2.evt | modeM0/AS1A02_191T02_9000000852_06428cztM0_level2_quad_clean.evt |
| Size (bytes) | 429,341,760 | 89,956,800 |
| Size | 409.5 MB | 85.8 MB |
| Events in quadrant A | 2,954,625 | 571,372 |
| Events in quadrant B | 3,063,689 | 594,432 |
| Events in quadrant C | 2,863,602 | 567,318 |
| Events in quadrant D | 3,678,805 | 538,006 |
| Mode SS | |||
|---|---|---|---|
| Quadrant | BADHDUFLAG | Total packets | Discarded packets |
| A | 0 | 132 | 0 |
| B | 0 | 132 | 0 |
| C | 0 | 132 | 0 |
| D | 0 | 132 | 0 |
| Mode M0 | |||
|---|---|---|---|
| Quadrant | BADHDUFLAG | Total packets | Discarded packets |
| A | 0 | 13273 | 2 |
| B | 0 | 13379 | 1 |
| C | 0 | 13231 | 1 |
| D | 0 | 15314 | 1 |
| Mode M9 | |||
|---|---|---|---|
| Quadrant | BADHDUFLAG | Total packets | Discarded packets |
| A | 0 | 10 | 0 |
| B | 0 | 10 | 0 |
| C | 0 | 10 | 0 |
| D | 0 | 10 | 0 |
| Quadrant | Total seconds | Saturated seconds | Saturation percentage |
|---|---|---|---|
| A | 6496 | 94 | 1.447044% |
| B | 6496 | 71 | 1.092980% |
| C | 6496 | 39 | 0.600369% |
| D | 6496 | 117 | 1.801108% |
Noise dominated data is calculated using 1-second bins in cleaned event files. If a bin has >2000 counts, and if more than 50% of those come from <1% of pixels, then it is considered to be noise-dominated and hence unusable.
| Quadrant | # 1 sec bins | Bins with >0 counts | Bins with >2000 counts | High rate bins dominated by noise | Noise dominated (total time) | Noise dominated (detector-on time) | Marked lightcurve |
|---|---|---|---|---|---|---|---|
| A | 7496 | 6497 | 0 | 0 | 0.00% | 0.00% | 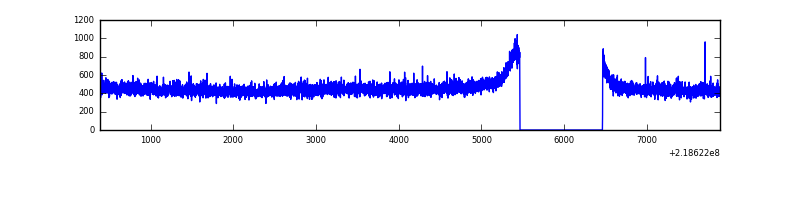 |
| B | 7496 | 6497 | 1 | 1 | 0.01% | 0.02% | 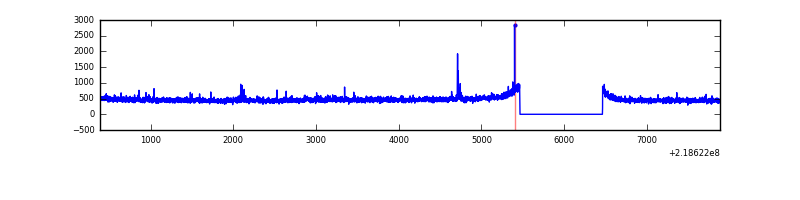 |
| C | 7496 | 6497 | 0 | 0 | 0.00% | 0.00% | 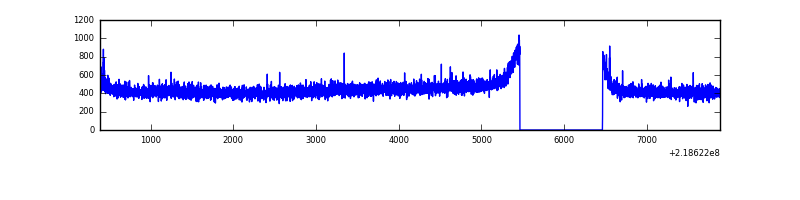 |
| D | 7496 | 6497 | 47 | 47 | 0.63% | 0.72% | 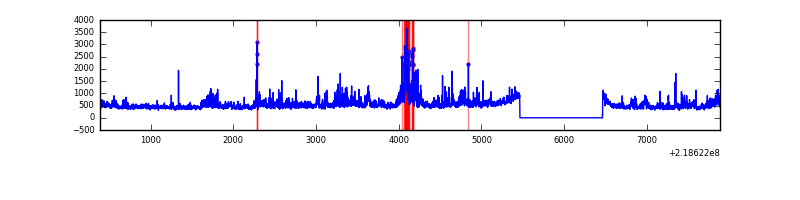 |
Top three noisy pixels from each quadrant. If the there are fewer than three noisy pixels in the level2.evt file, extra rows are filled as -1
| Pixel properties | Quadrant properties | ||||||
|---|---|---|---|---|---|---|---|
| Quadrant | DetID | PixID | Counts | Sigma | Mean | Median | Sigma |
| A | 8 | 15 | 7711 | 45.28 | 761 | 744 | 153.9 |
| A | 0 | 226 | 7260 | 42.35 | 761 | 744 | 153.9 |
| A | 12 | 194 | 7242 | 42.23 | 761 | 744 | 153.9 |
| B | 15 | 204 | 31546 | 209.98 | 766 | 749 | 146.7 |
| B | 0 | 219 | 19763 | 129.64 | 766 | 749 | 146.7 |
| B | 15 | 35 | 19208 | 125.85 | 766 | 749 | 146.7 |
| C | 9 | 54 | 6707 | 35.13 | 731 | 734 | 170.0 |
| C | 13 | 61 | 5772 | 29.63 | 731 | 734 | 170.0 |
| C | 1 | 16 | 4941 | 24.75 | 731 | 734 | 170.0 |
| D | 11 | 241 | 442513 | 2447.68 | 733 | 709 | 180.5 |
| D | 2 | 152 | 398047 | 2201.33 | 733 | 709 | 180.5 |
| D | 5 | 97 | 23902 | 128.49 | 733 | 709 | 180.5 |
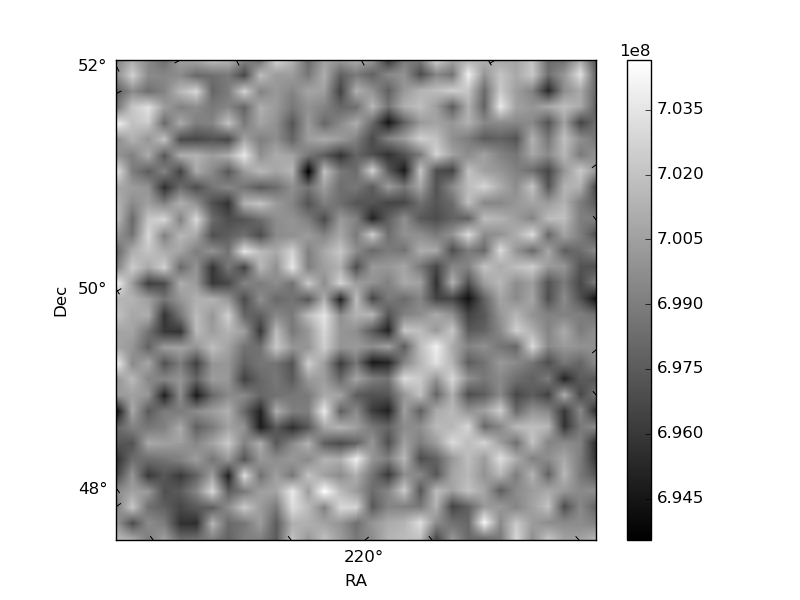
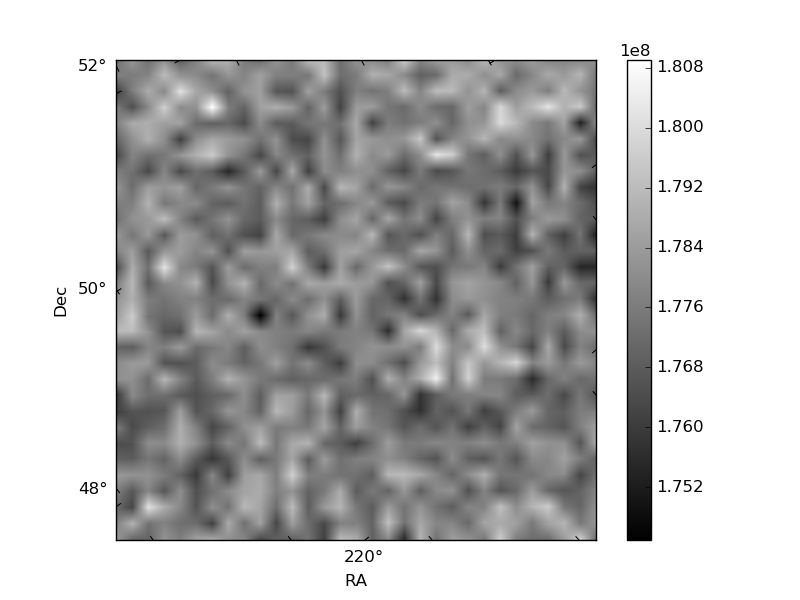
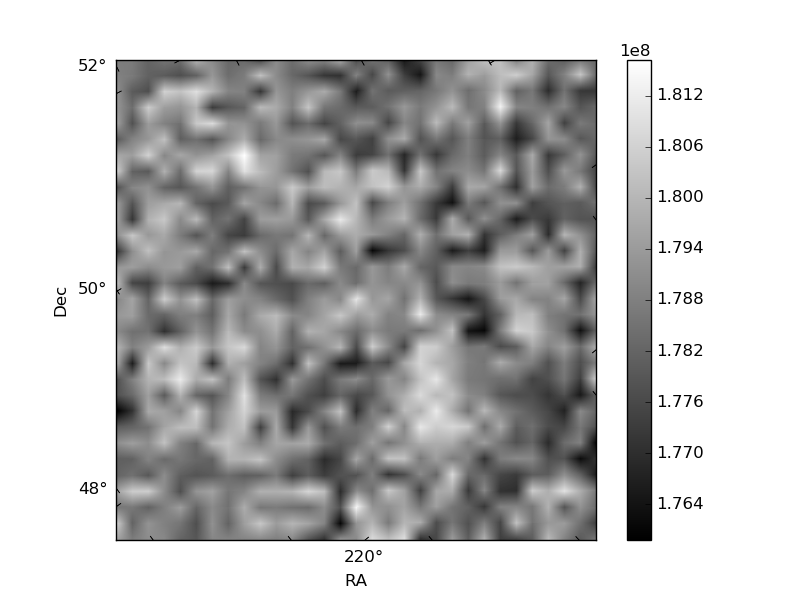
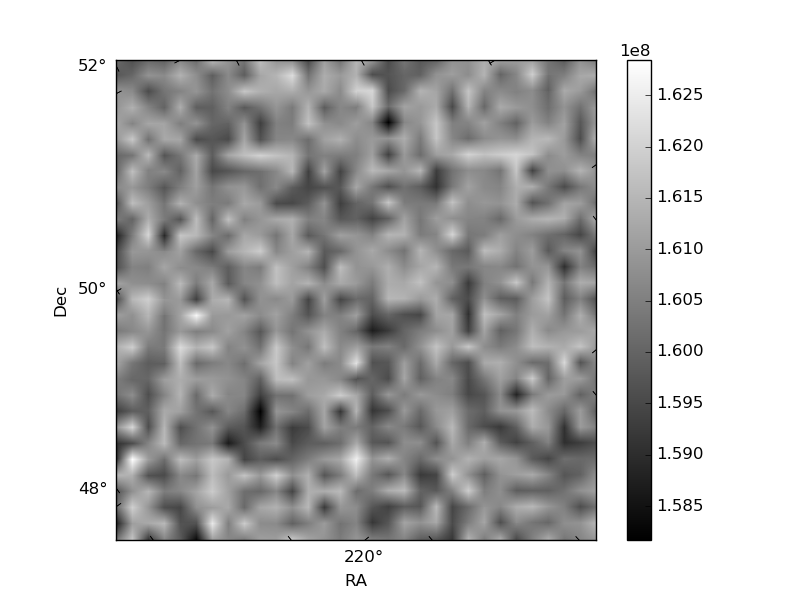
Histogram calculated using DETX and DETY for each event in the final _common_clean file
| Quadrant A | 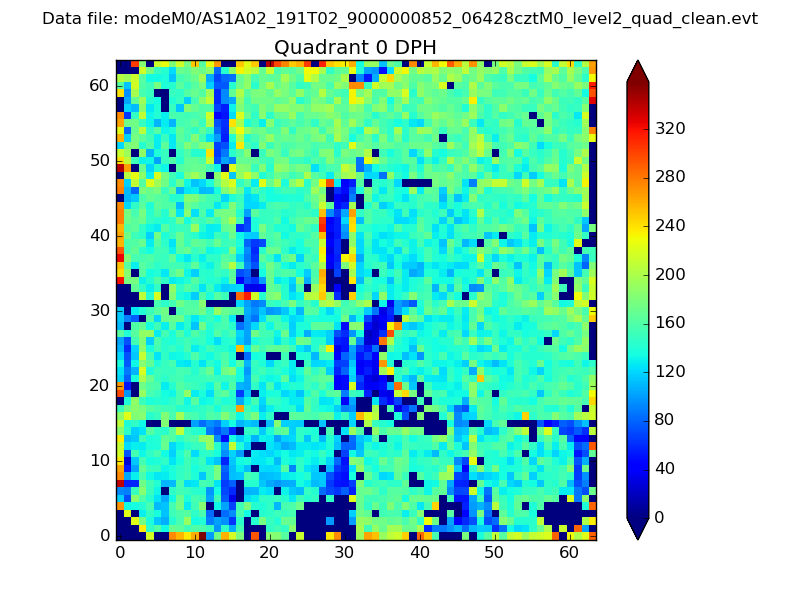 |
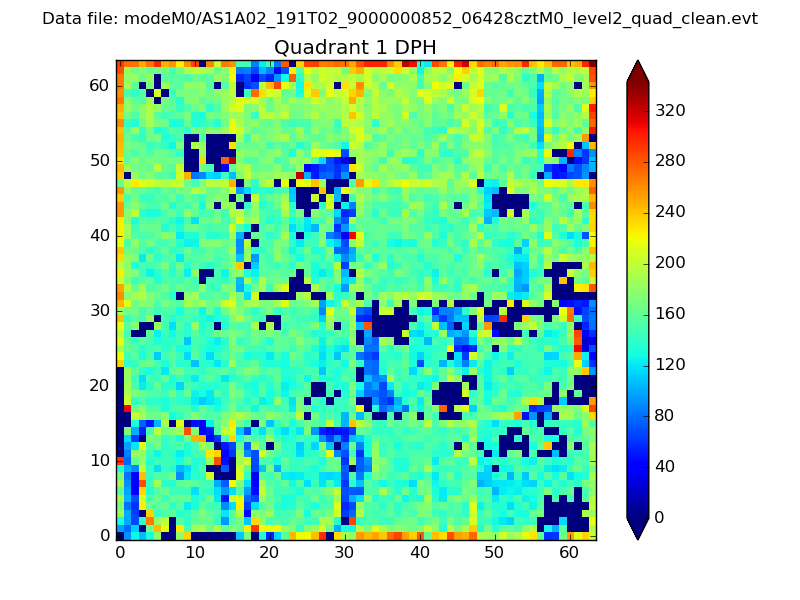 |
Quadrant B |
|---|---|---|---|
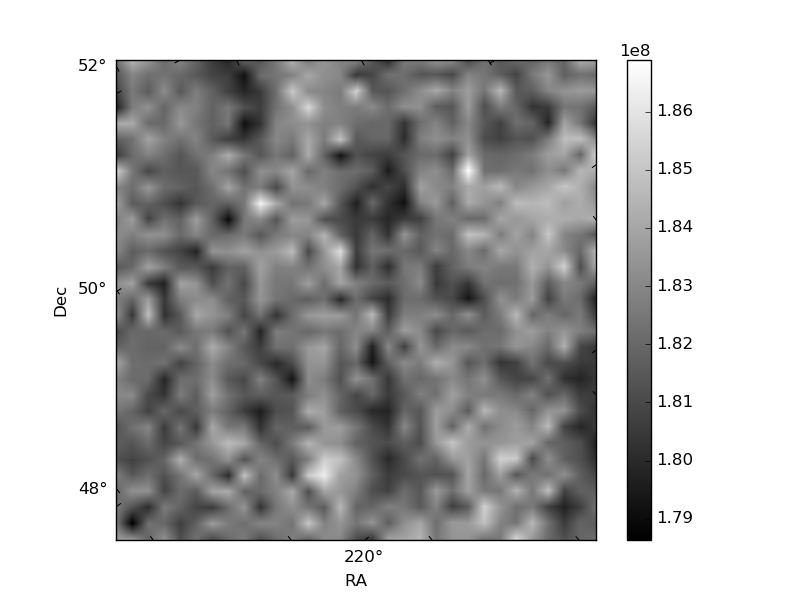
| Quadrant D | 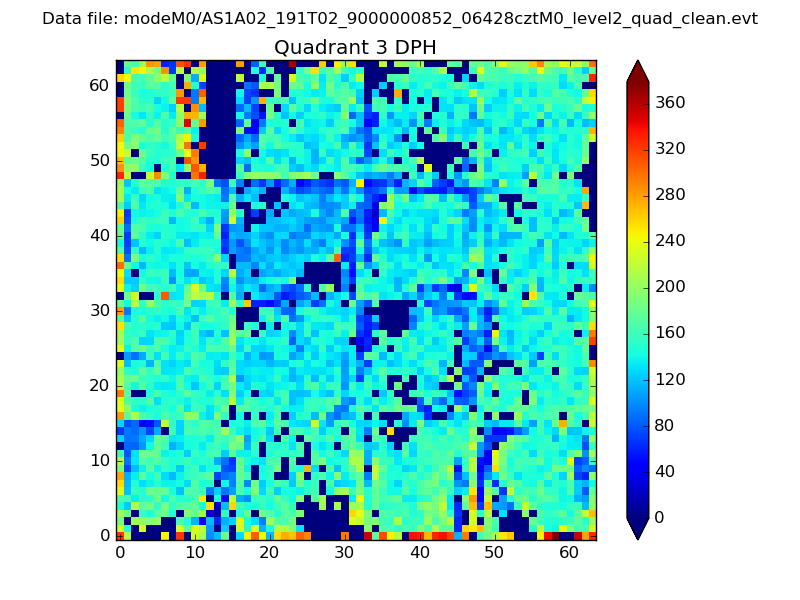 |
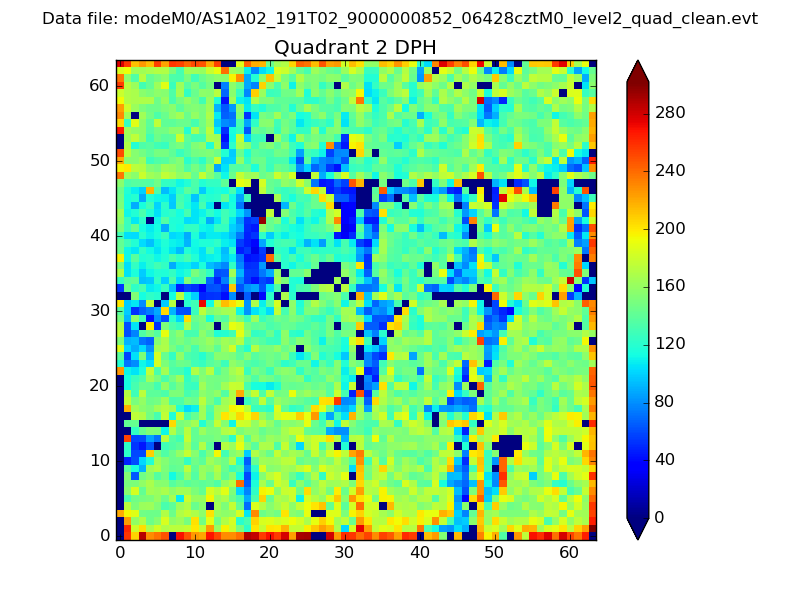 |
Quadrant C |
| Plot type | Count rate plots | Images |
|---|---|---|
| Comparison with Poisson distribution Blue bars denote a histogram of data divided into 1 sec bins. Red curve is a Poisson curve with rate = median count rate of data. |
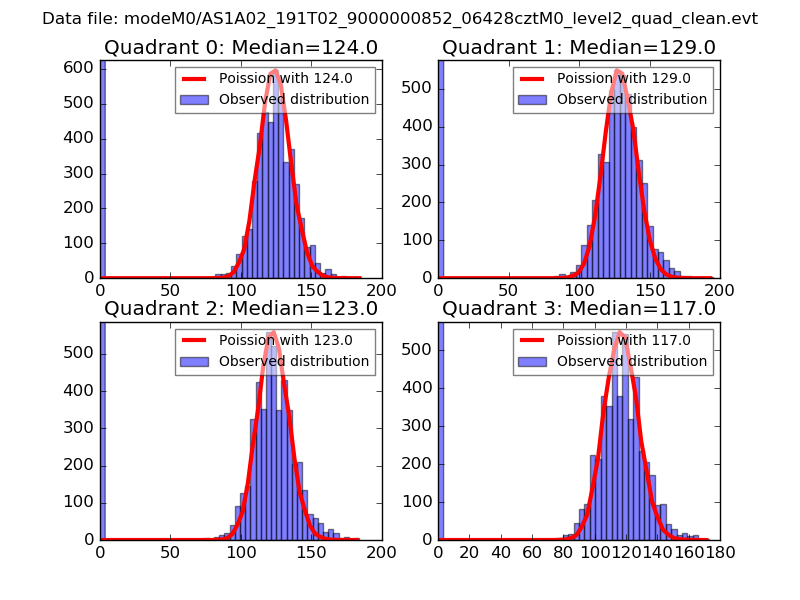 |
 |
| Quadrant-wise count rates Data is divided into 100 sec bins |
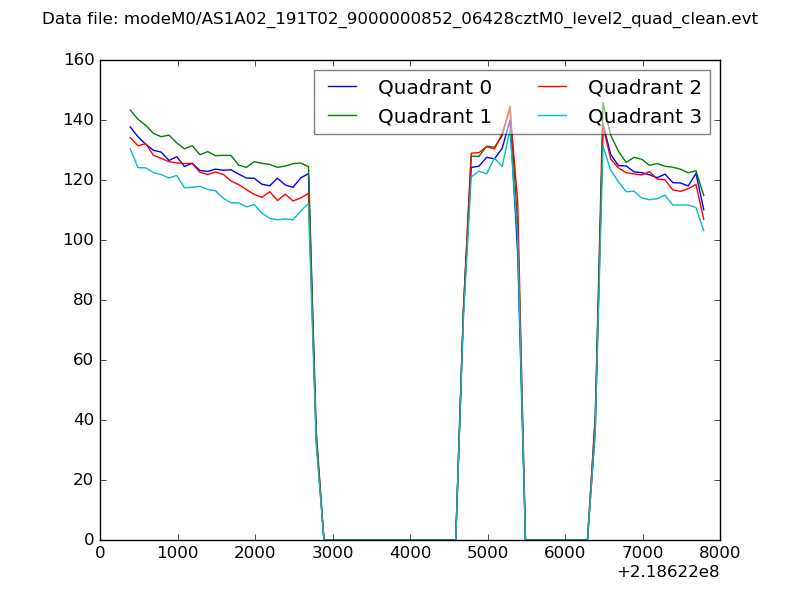 |
|
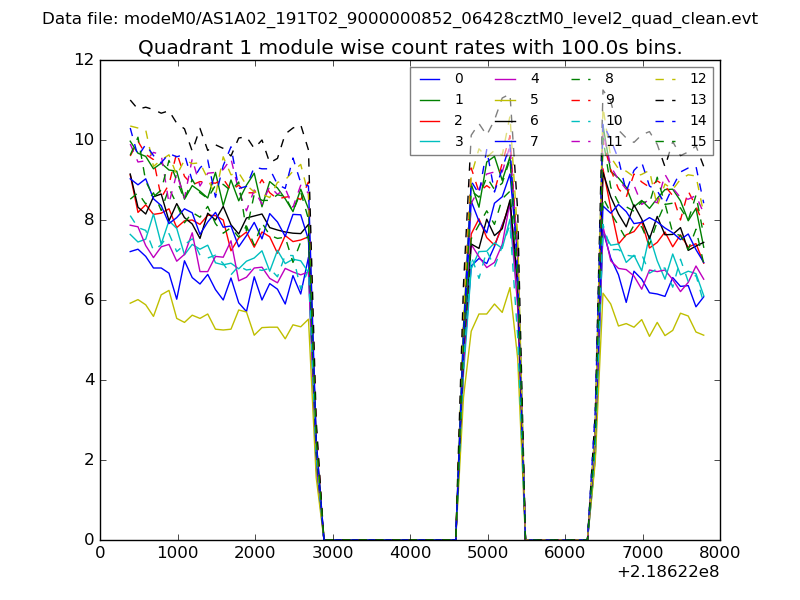
| Module-wise count rates for Quadrant A Data is divided into 100 sec bins |
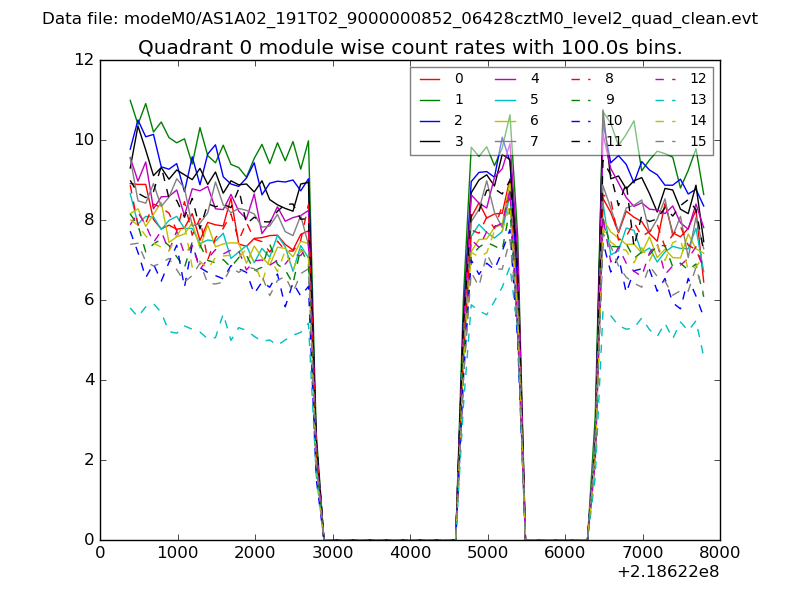 |
 |
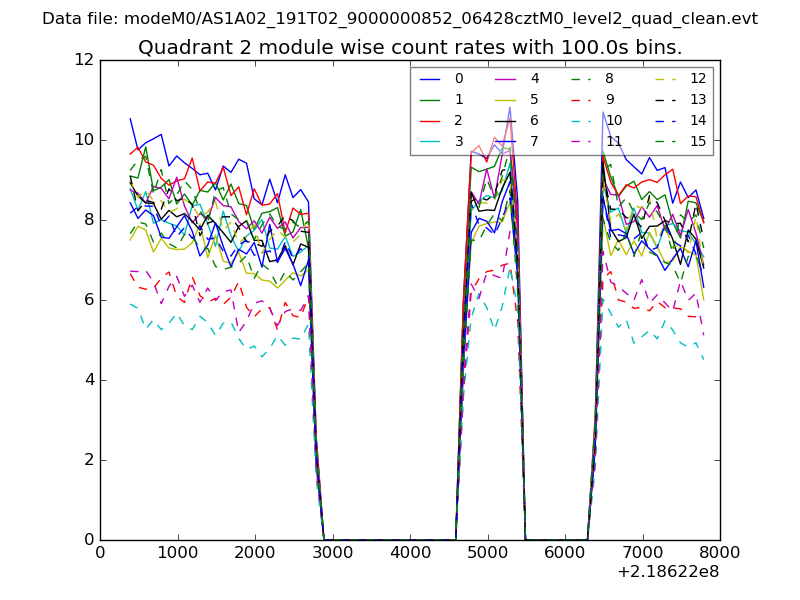
| Module-wise count rates for Quadrant B Data is divided into 100 sec bins |
 |
 |
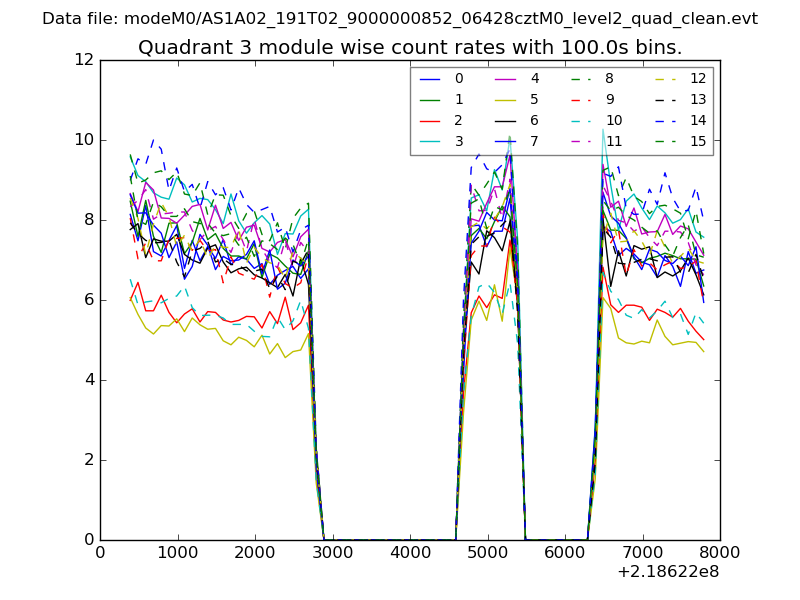
| Module-wise count rates for Quadrant C Data is divided into 100 sec bins |
 |
 |
| Module-wise count rates for Quadrant D Data is divided into 100 sec bins |
 |
 |
| Parameter | Plot |
|---|---|
| CZT HV Monitor | 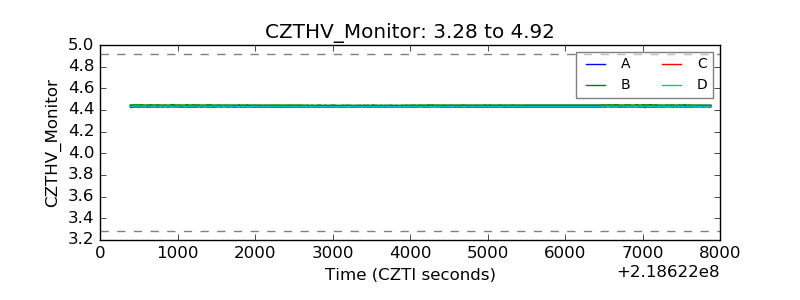 |
| D_VDD | 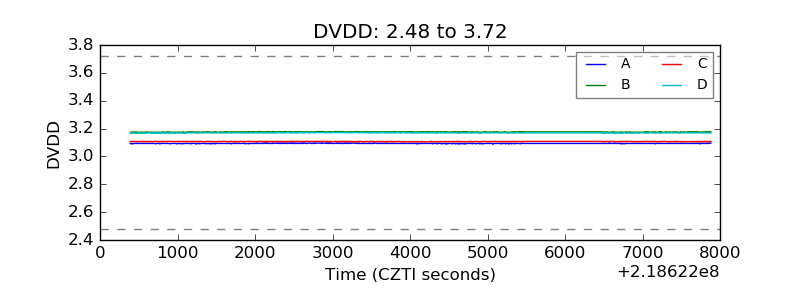 |
| Temperature 1 | 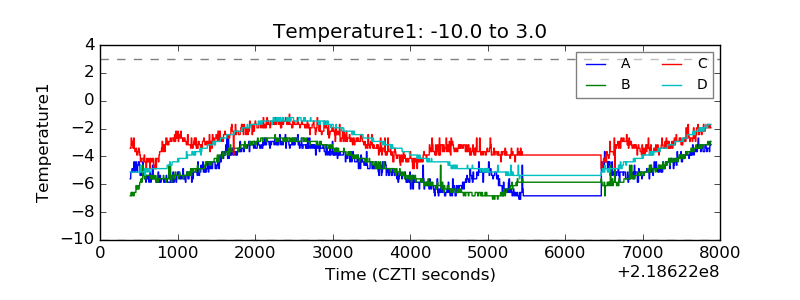 |
| Veto HV Monitor | 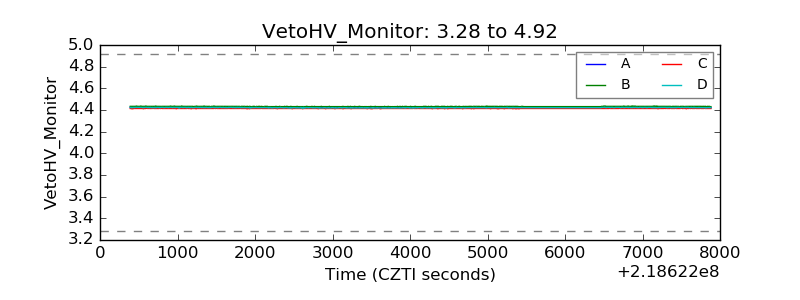 |
| Veto LLD | 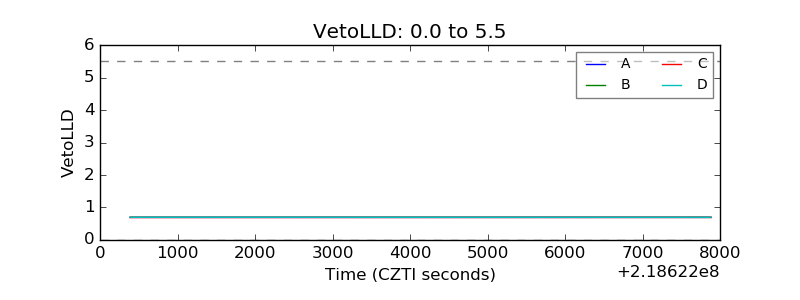 |
| Alpha Counter | 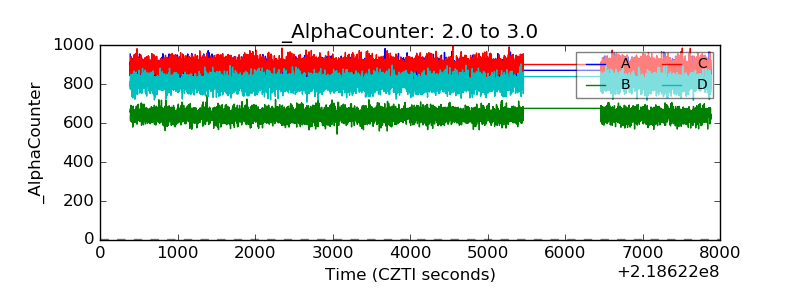 |
| _CPM_Rate | 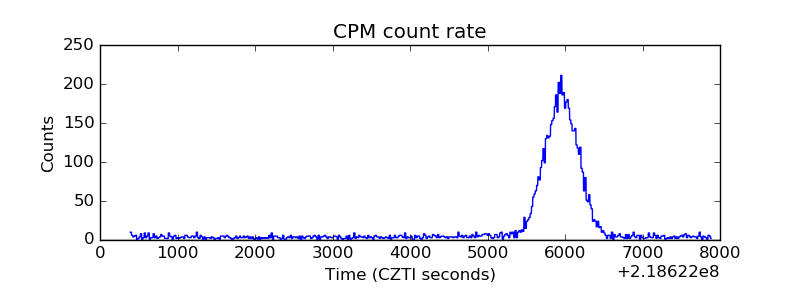 |
| CZT Counter | 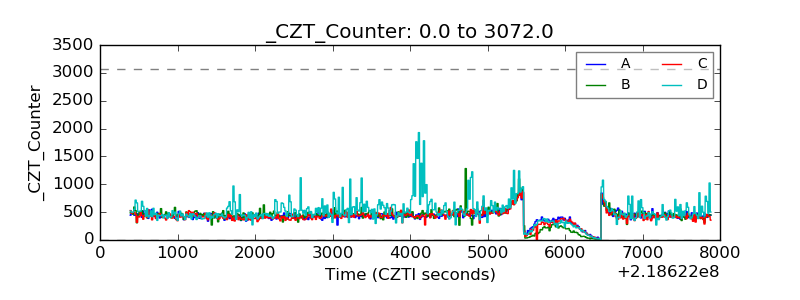 |
| +2.5 Volts monitor |  |
| +5 Volts monitor | 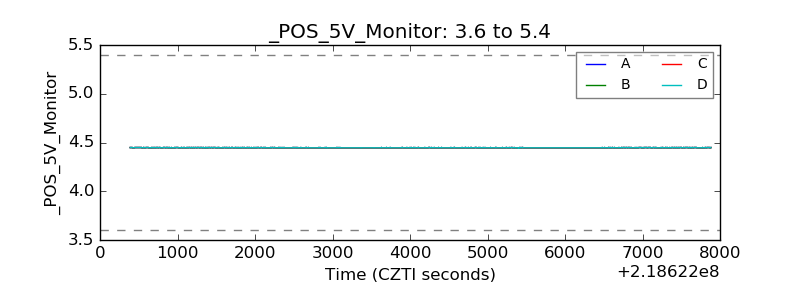 |
| _ROLL_ROT | 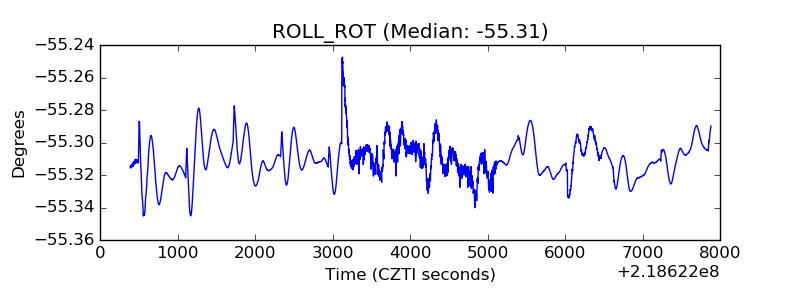 |
| _Roll_DEC | 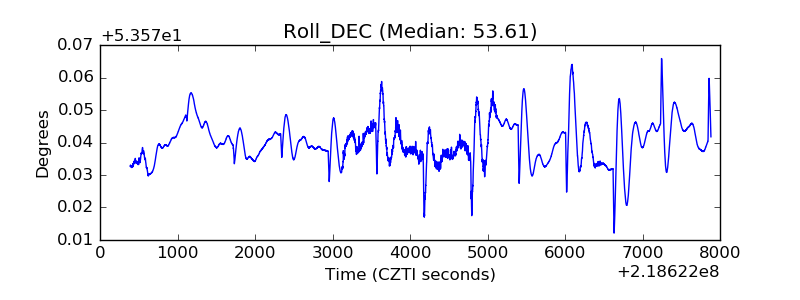 |
| _Roll_RA | 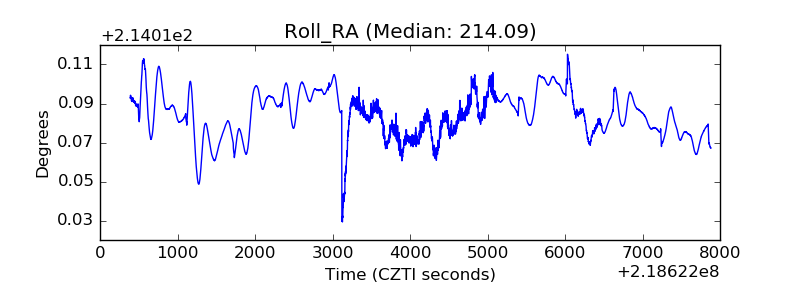 |
| Veto Counter | 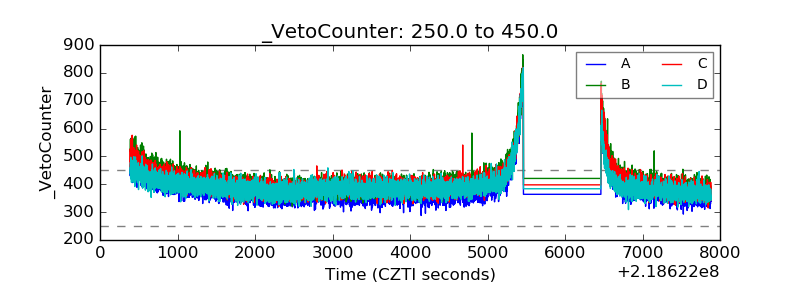 |