| Param | Original file | Final file |
|---|---|---|
| Filename | modeM0/AS1A02_191T02_9000000852_06429cztM0_level2.evt | modeM0/AS1A02_191T02_9000000852_06429cztM0_level2_quad_clean.evt |
| Size (bytes) | 485,291,520 | 97,335,360 |
| Size | 462.8 MB | 92.8 MB |
| Events in quadrant A | 3,160,095 | 620,159 |
| Events in quadrant B | 3,244,002 | 639,905 |
| Events in quadrant C | 3,070,427 | 614,505 |
| Events in quadrant D | 4,745,128 | 583,610 |
| Mode SS | |||
|---|---|---|---|
| Quadrant | BADHDUFLAG | Total packets | Discarded packets |
| A | 0 | 142 | 0 |
| B | 0 | 142 | 0 |
| C | 0 | 142 | 0 |
| D | 0 | 142 | 0 |
| Mode M0 | |||
|---|---|---|---|
| Quadrant | BADHDUFLAG | Total packets | Discarded packets |
| A | 0 | 14383 | 2 |
| B | 0 | 14419 | 1 |
| C | 0 | 14325 | 1 |
| D | 0 | 18939 | 1 |
| Mode M9 | |||
|---|---|---|---|
| Quadrant | BADHDUFLAG | Total packets | Discarded packets |
| A | 0 | 6 | 0 |
| B | 0 | 6 | 0 |
| C | 0 | 6 | 0 |
| D | 0 | 6 | 0 |
| Quadrant | Total seconds | Saturated seconds | Saturation percentage |
|---|---|---|---|
| A | 7031 | 116 | 1.649836% |
| B | 7031 | 102 | 1.450718% |
| C | 7031 | 76 | 1.080927% |
| D | 7031 | 196 | 2.787655% |
Noise dominated data is calculated using 1-second bins in cleaned event files. If a bin has >2000 counts, and if more than 50% of those come from <1% of pixels, then it is considered to be noise-dominated and hence unusable.
| Quadrant | # 1 sec bins | Bins with >0 counts | Bins with >2000 counts | High rate bins dominated by noise | Noise dominated (total time) | Noise dominated (detector-on time) | Marked lightcurve |
|---|---|---|---|---|---|---|---|
| A | 7646 | 7032 | 0 | 0 | 0.00% | 0.00% | 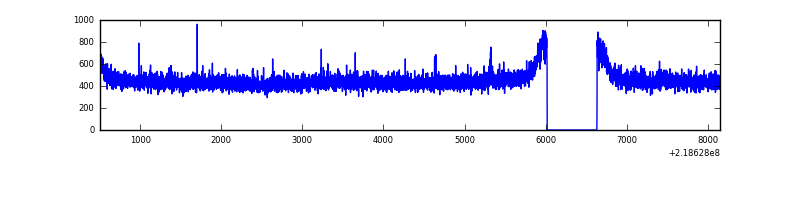 |
| B | 7646 | 7032 | 1 | 1 | 0.01% | 0.01% | 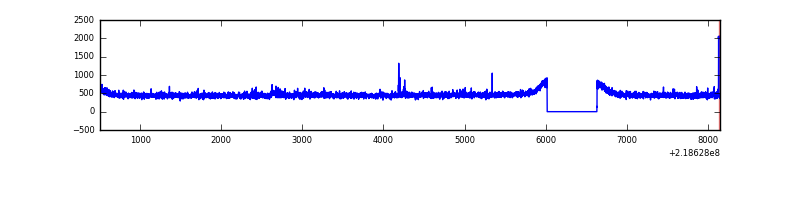 |
| C | 7646 | 7032 | 0 | 0 | 0.00% | 0.00% | 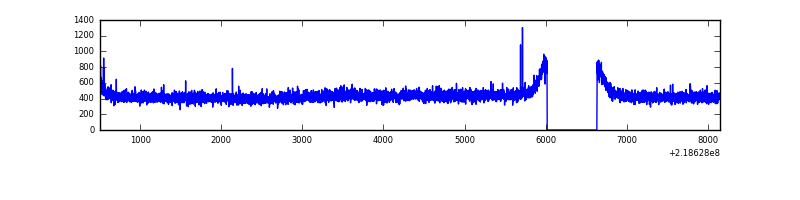 |
| D | 7646 | 7032 | 95 | 95 | 1.24% | 1.35% | 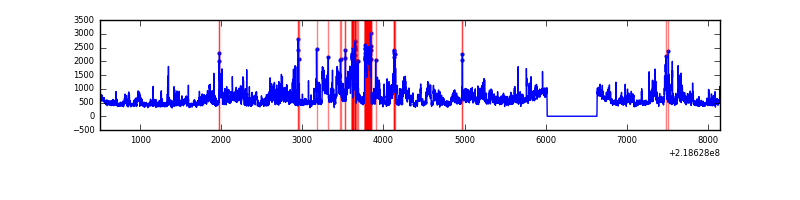 |
Top three noisy pixels from each quadrant. If the there are fewer than three noisy pixels in the level2.evt file, extra rows are filled as -1
| Pixel properties | Quadrant properties | ||||||
|---|---|---|---|---|---|---|---|
| Quadrant | DetID | PixID | Counts | Sigma | Mean | Median | Sigma |
| A | 0 | 226 | 7982 | 43.26 | 814 | 794 | 166.2 |
| A | 12 | 194 | 7775 | 42.01 | 814 | 794 | 166.2 |
| A | 8 | 15 | 6973 | 37.19 | 814 | 794 | 166.2 |
| B | 15 | 204 | 25829 | 157.82 | 819 | 800 | 158.6 |
| B | 0 | 219 | 19499 | 117.91 | 819 | 800 | 158.6 |
| B | 12 | 111 | 15819 | 94.7 | 819 | 800 | 158.6 |
| C | 9 | 54 | 7611 | 37.49 | 784 | 786 | 182.0 |
| C | 13 | 61 | 6264 | 30.09 | 784 | 786 | 182.0 |
| C | 3 | 202 | 1962 | 6.46 | 784 | 786 | 182.0 |
| D | 11 | 241 | 1270812 | 6623.49 | 783 | 756 | 191.8 |
| D | 2 | 152 | 402894 | 2097.2 | 783 | 756 | 191.8 |
| D | 5 | 97 | 29035 | 147.48 | 783 | 756 | 191.8 |
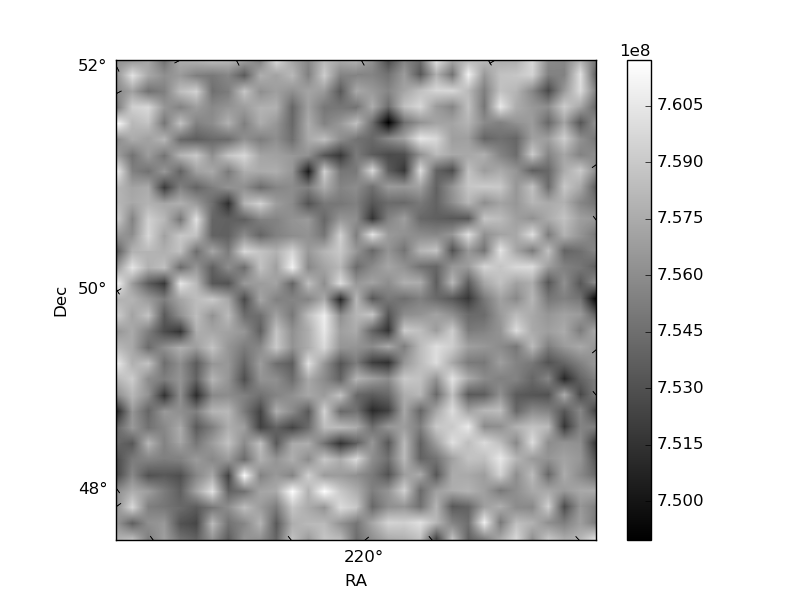
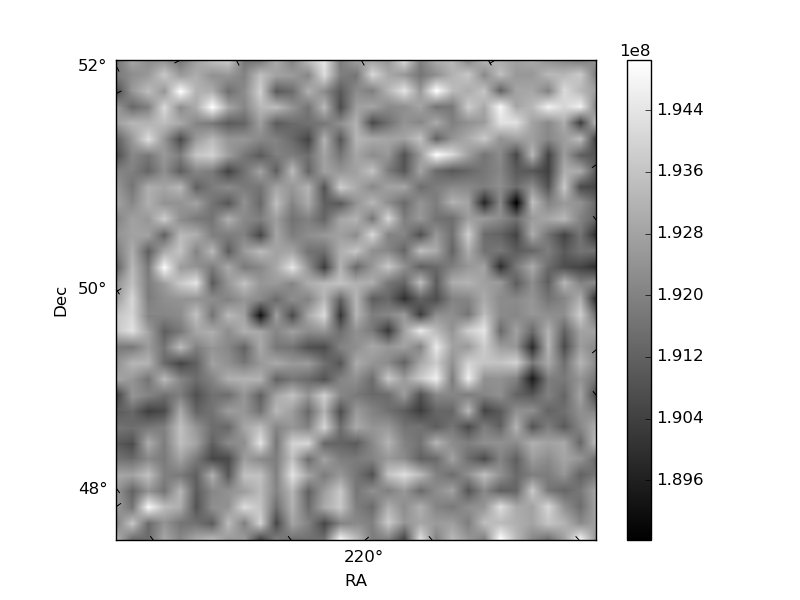
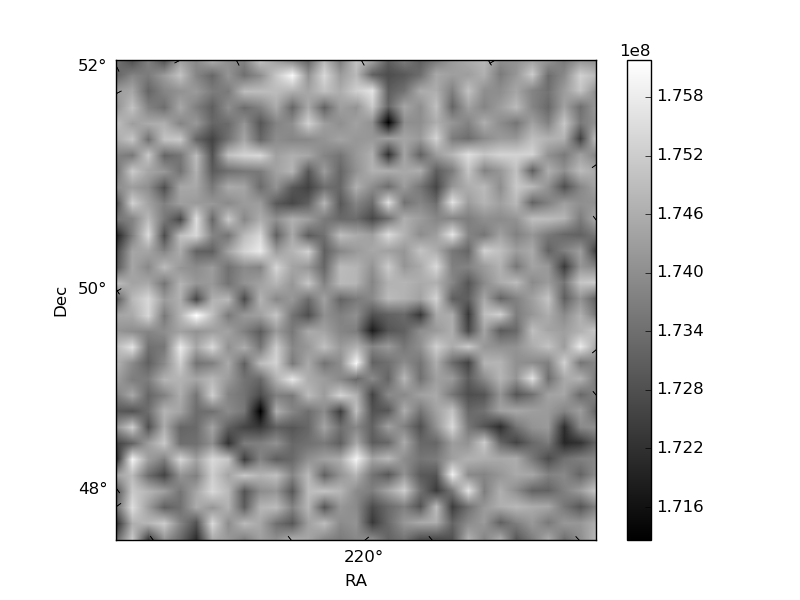
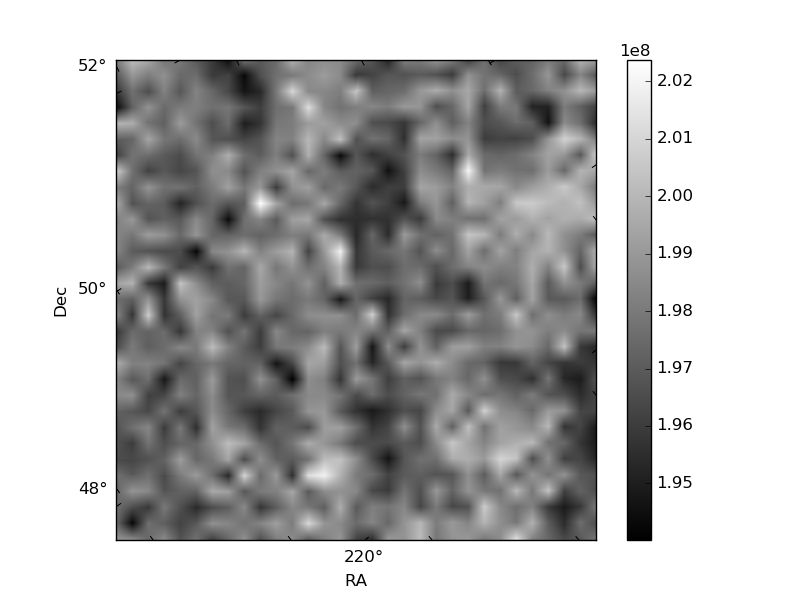
Histogram calculated using DETX and DETY for each event in the final _common_clean file
| Quadrant A | 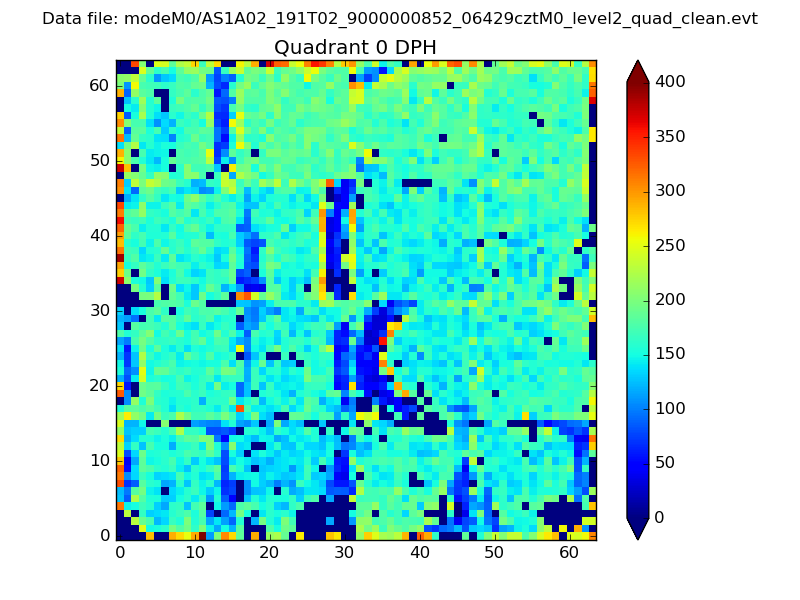 |
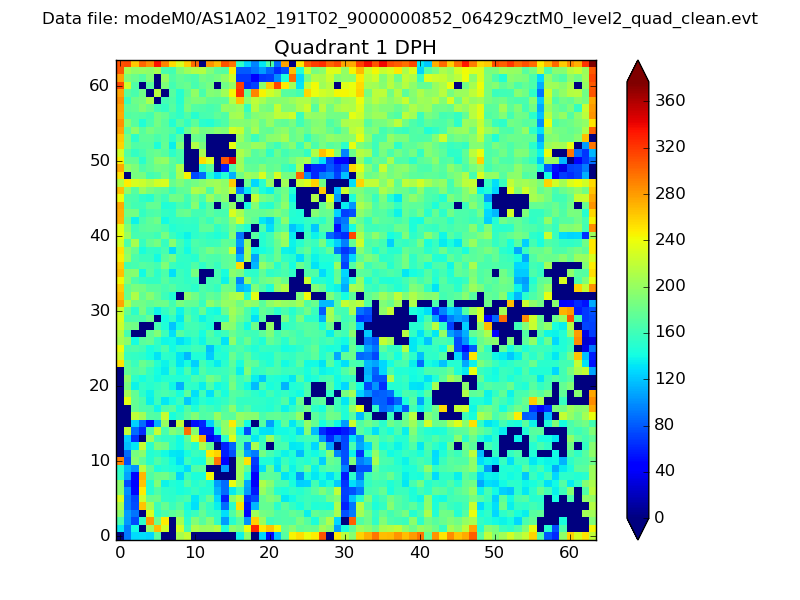 |
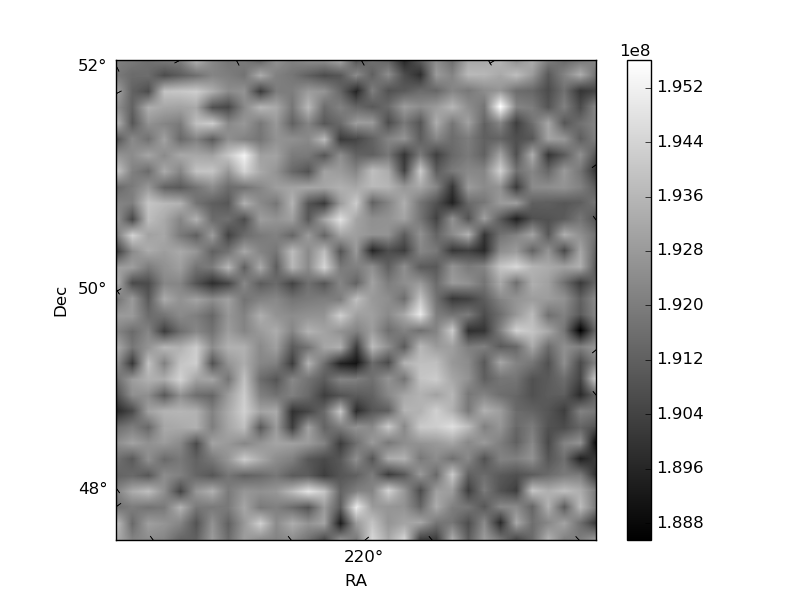
Quadrant B |
|---|---|---|---|
| Quadrant D | 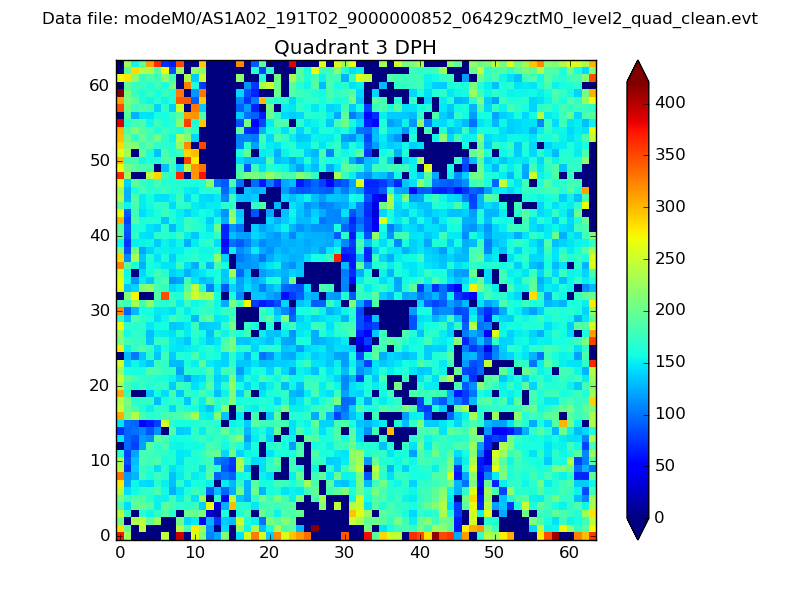 |
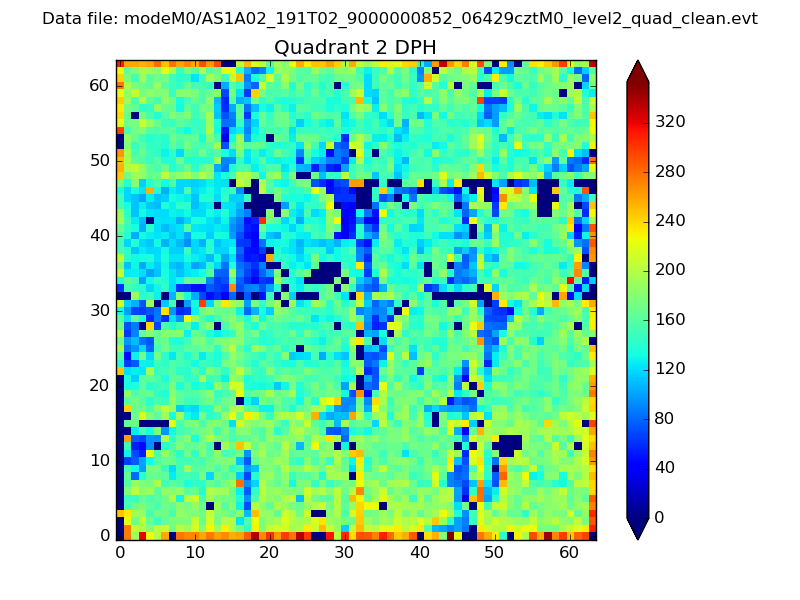 |
Quadrant C |
| Plot type | Count rate plots | Images |
|---|---|---|
| Comparison with Poisson distribution Blue bars denote a histogram of data divided into 1 sec bins. Red curve is a Poisson curve with rate = median count rate of data. |
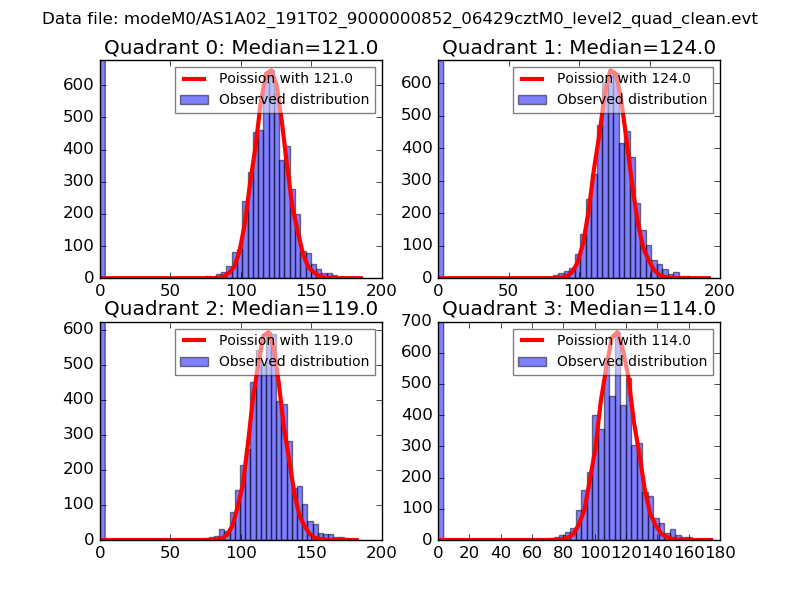 |
 |
| Quadrant-wise count rates Data is divided into 100 sec bins |
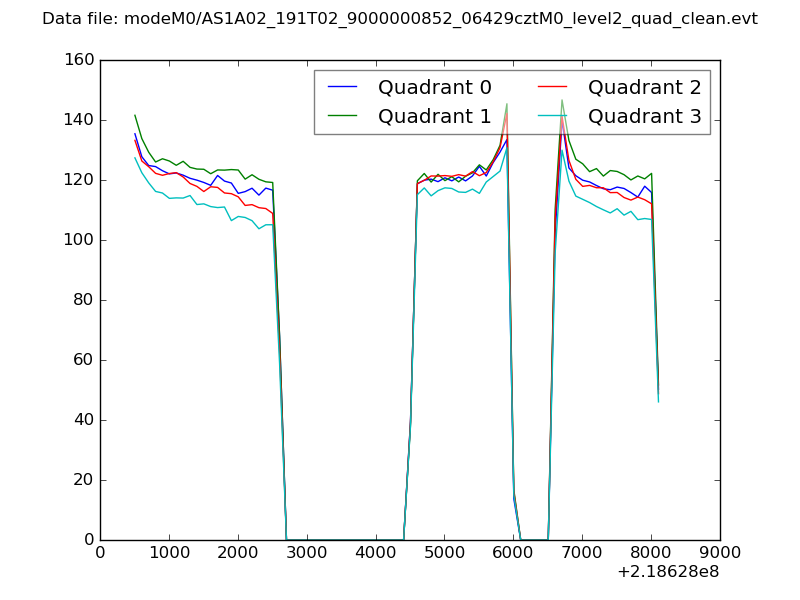 |
|
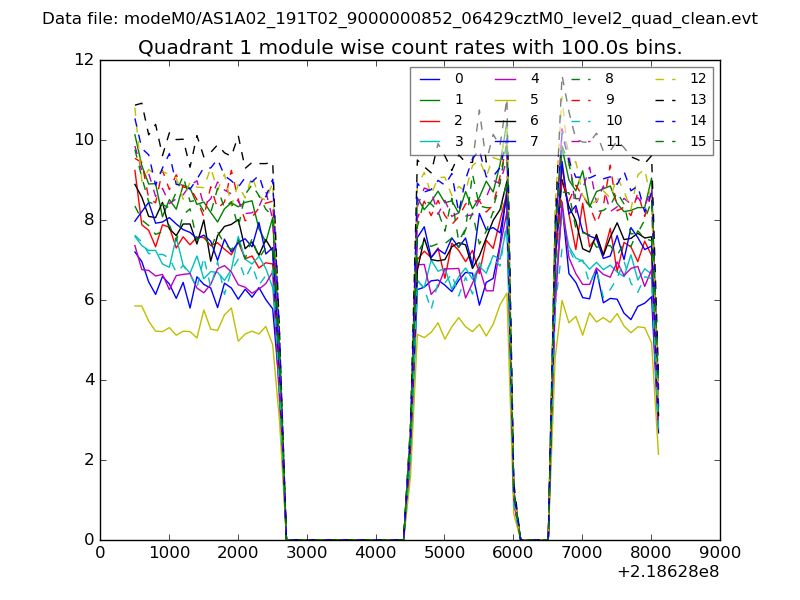
| Module-wise count rates for Quadrant A Data is divided into 100 sec bins |
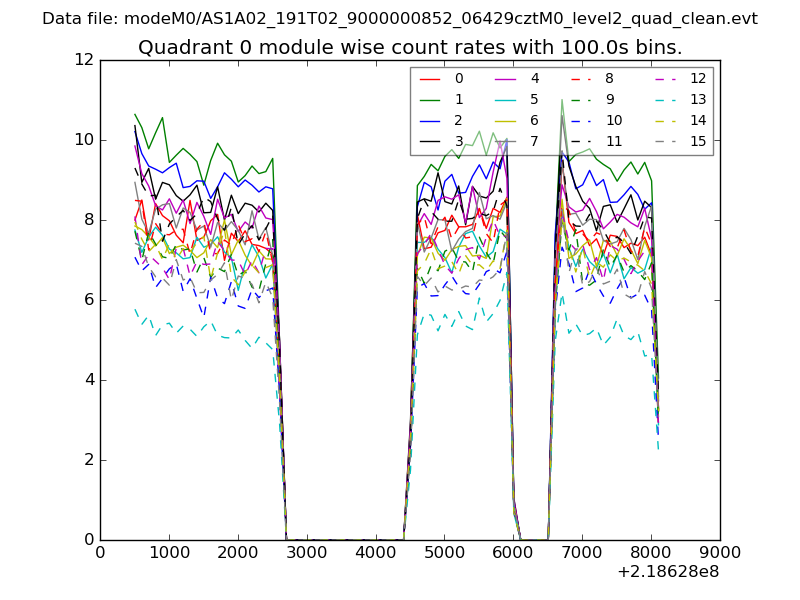 |
 |
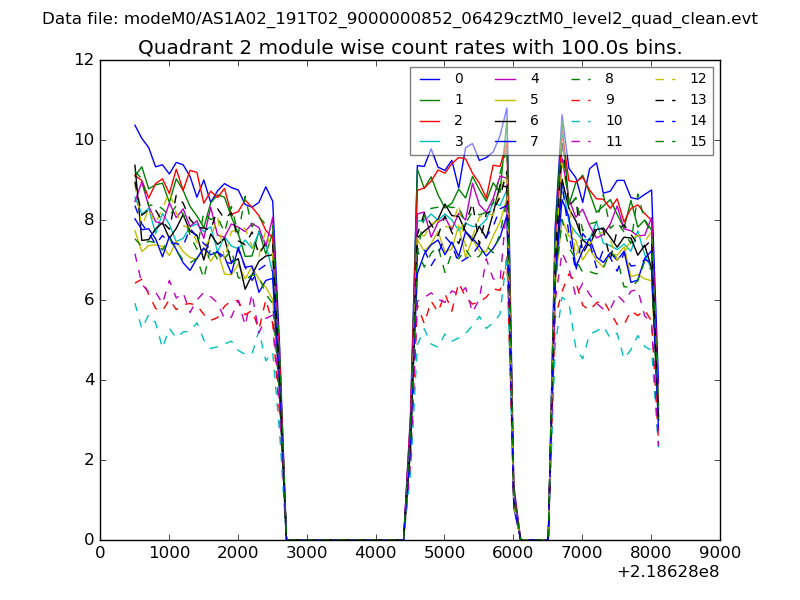
| Module-wise count rates for Quadrant B Data is divided into 100 sec bins |
 |
 |
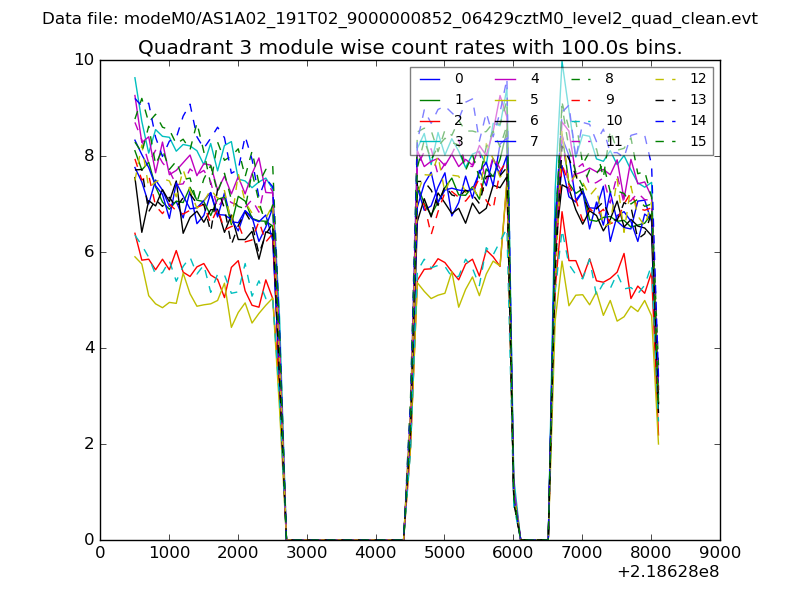
| Module-wise count rates for Quadrant C Data is divided into 100 sec bins |
 |
 |
| Module-wise count rates for Quadrant D Data is divided into 100 sec bins |
 |
 |
| Parameter | Plot |
|---|---|
| CZT HV Monitor | 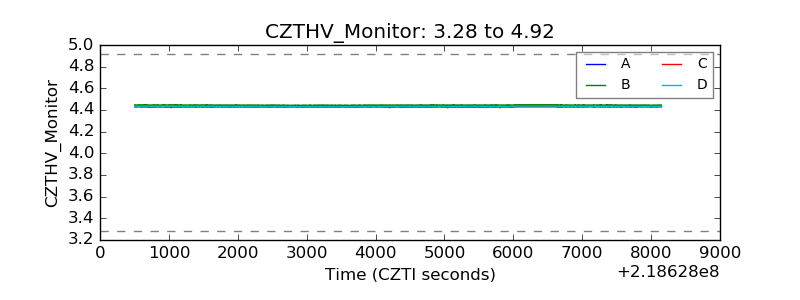 |
| D_VDD | 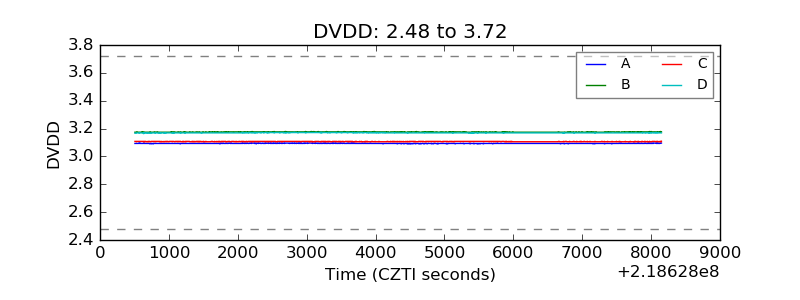 |
| Temperature 1 | 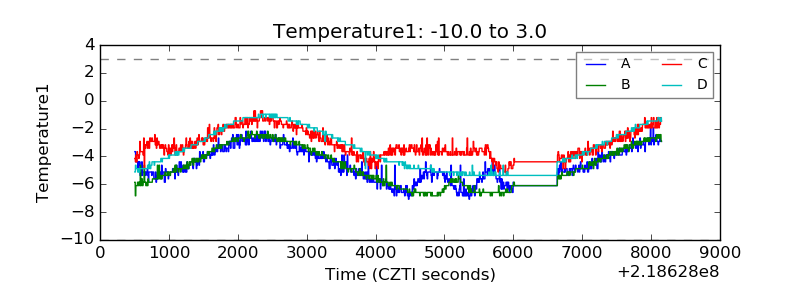 |
| Veto HV Monitor | 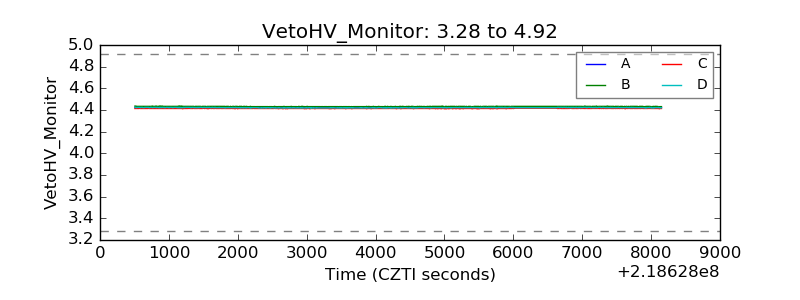 |
| Veto LLD | 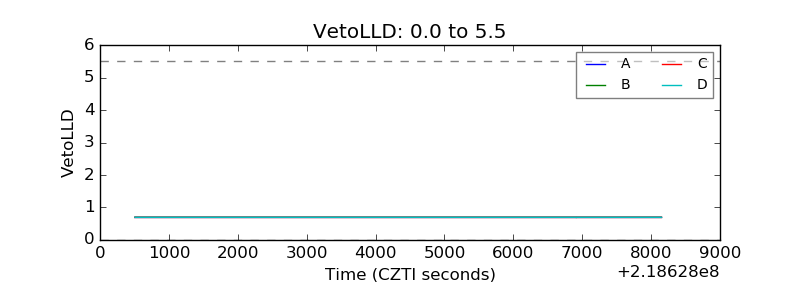 |
| Alpha Counter | 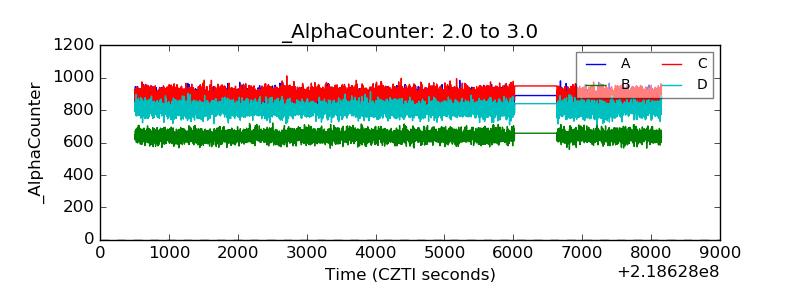 |
| _CPM_Rate | 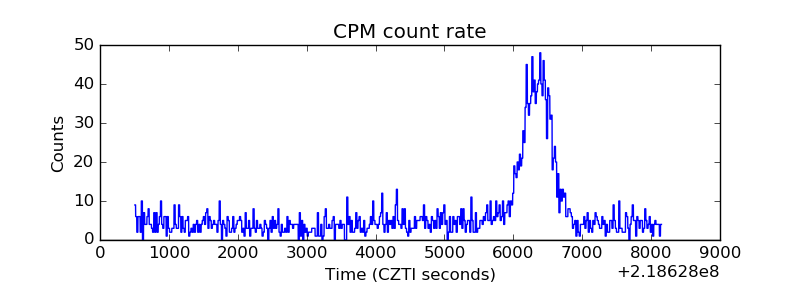 |
| CZT Counter | 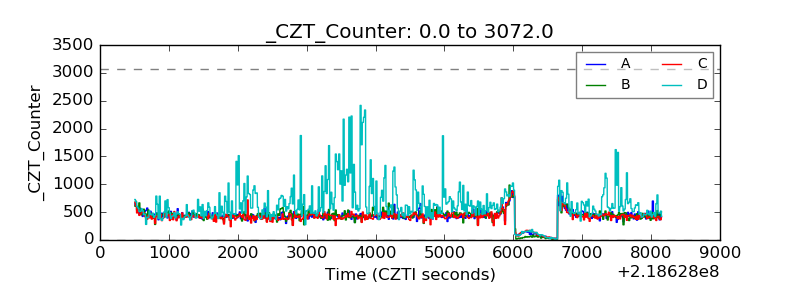 |
| +2.5 Volts monitor |  |
| +5 Volts monitor | 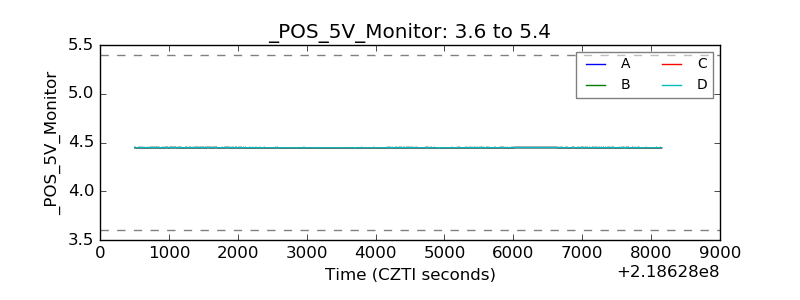 |
| _ROLL_ROT | 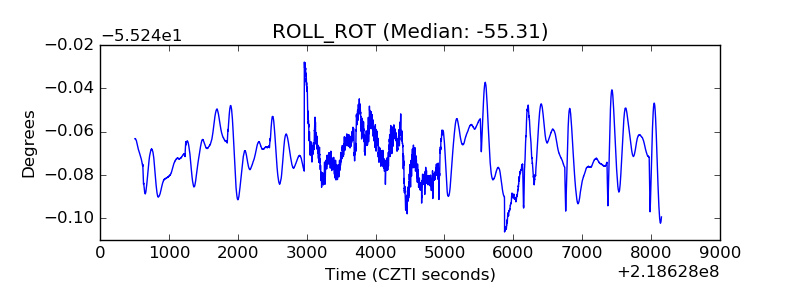 |
| _Roll_DEC | 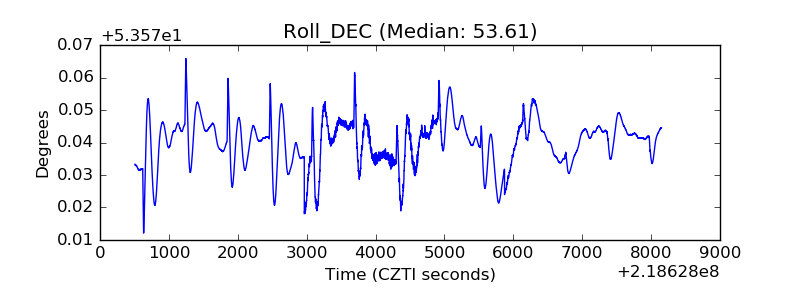 |
| _Roll_RA | 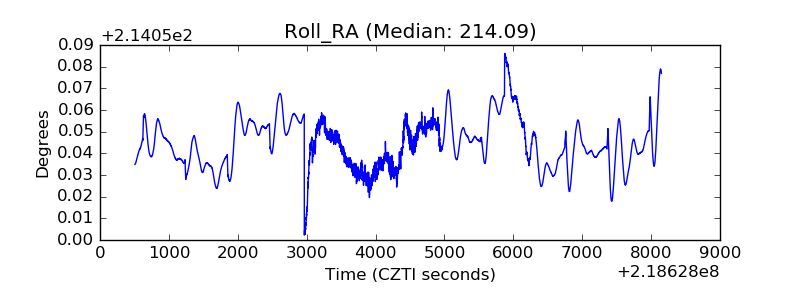 |
| Veto Counter | 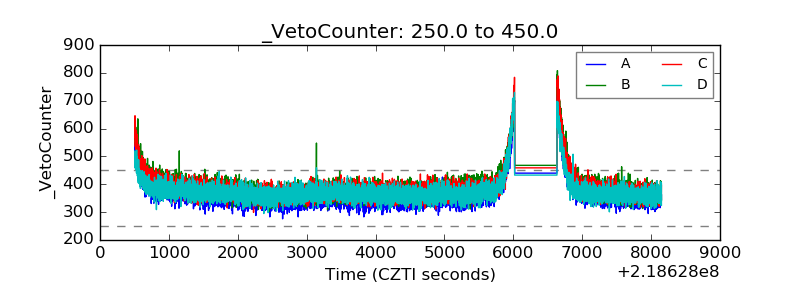 |