| Param | Original file | Final file |
|---|---|---|
| Filename | modeM0/AS1A02_191T02_9000000852_06430cztM0_level2.evt | modeM0/AS1A02_191T02_9000000852_06430cztM0_level2_quad_clean.evt |
| Size (bytes) | 446,967,360 | 93,409,920 |
| Size | 426.3 MB | 89.1 MB |
| Events in quadrant A | 3,126,014 | 592,566 |
| Events in quadrant B | 3,275,709 | 607,576 |
| Events in quadrant C | 3,044,808 | 584,346 |
| Events in quadrant D | 3,614,492 | 557,513 |
| Mode SS | |||
|---|---|---|---|
| Quadrant | BADHDUFLAG | Total packets | Discarded packets |
| A | 0 | 142 | 0 |
| B | 0 | 142 | 0 |
| C | 0 | 142 | 0 |
| D | 0 | 142 | 0 |
| Mode M0 | |||
|---|---|---|---|
| Quadrant | BADHDUFLAG | Total packets | Discarded packets |
| A | 0 | 14297 | 2 |
| B | 0 | 14538 | 1 |
| C | 0 | 14266 | 1 |
| D | 0 | 15659 | 1 |
| Mode M9 | |||
|---|---|---|---|
| Quadrant | BADHDUFLAG | Total packets | Discarded packets |
| A | 0 | 2 | 0 |
| B | 0 | 2 | 0 |
| C | 0 | 2 | 0 |
| D | 0 | 2 | 0 |
| Quadrant | Total seconds | Saturated seconds | Saturation percentage |
|---|---|---|---|
| A | 6988 | 105 | 1.502576% |
| B | 6988 | 133 | 1.903263% |
| C | 6988 | 93 | 1.330853% |
| D | 6988 | 107 | 1.531196% |
Noise dominated data is calculated using 1-second bins in cleaned event files. If a bin has >2000 counts, and if more than 50% of those come from <1% of pixels, then it is considered to be noise-dominated and hence unusable.
| Quadrant | # 1 sec bins | Bins with >0 counts | Bins with >2000 counts | High rate bins dominated by noise | Noise dominated (total time) | Noise dominated (detector-on time) | Marked lightcurve |
|---|---|---|---|---|---|---|---|
| A | 7198 | 6989 | 0 | 0 | 0.00% | 0.00% | 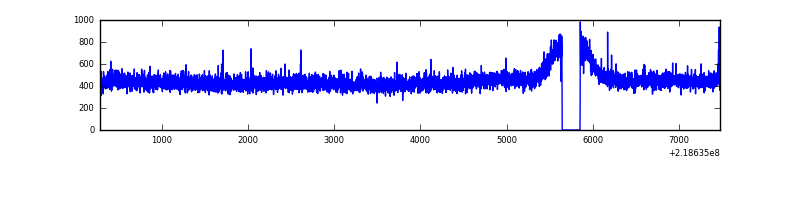 |
| B | 7198 | 6989 | 11 | 11 | 0.15% | 0.16% | 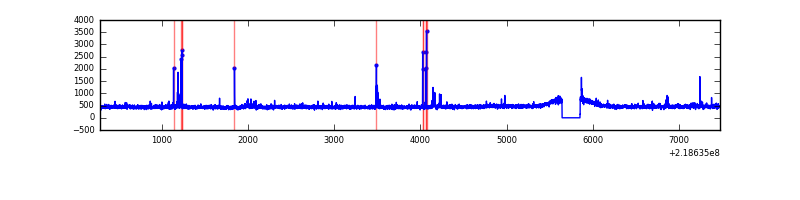 |
| C | 7198 | 6989 | 0 | 0 | 0.00% | 0.00% | 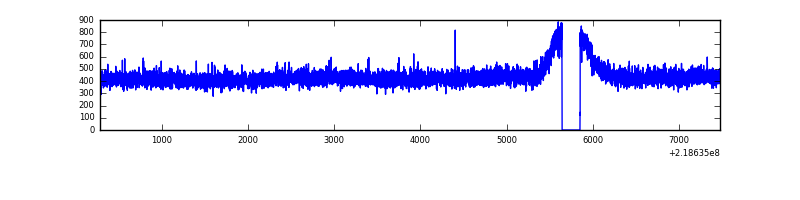 |
| D | 7198 | 6989 | 16 | 16 | 0.22% | 0.23% | 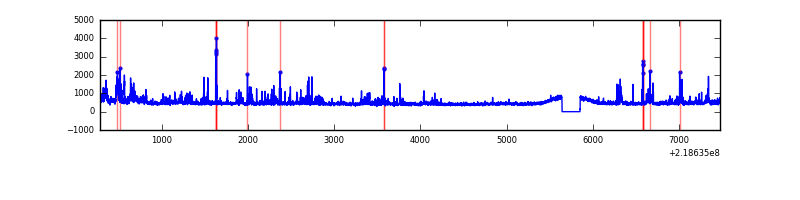 |
Top three noisy pixels from each quadrant. If the there are fewer than three noisy pixels in the level2.evt file, extra rows are filled as -1
| Pixel properties | Quadrant properties | ||||||
|---|---|---|---|---|---|---|---|
| Quadrant | DetID | PixID | Counts | Sigma | Mean | Median | Sigma |
| A | 8 | 15 | 8537 | 46.97 | 806 | 785 | 165.0 |
| A | 0 | 226 | 7935 | 43.32 | 806 | 785 | 165.0 |
| A | 12 | 194 | 7662 | 41.67 | 806 | 785 | 165.0 |
| B | 0 | 219 | 41835 | 262.68 | 812 | 794 | 156.2 |
| B | 15 | 204 | 33699 | 210.61 | 812 | 794 | 156.2 |
| B | 0 | 228 | 30256 | 188.57 | 812 | 794 | 156.2 |
| C | 13 | 61 | 6155 | 29.77 | 777 | 781 | 180.5 |
| C | 8 | 128 | 6082 | 29.37 | 777 | 781 | 180.5 |
| C | 8 | 112 | 2848 | 11.45 | 777 | 781 | 180.5 |
| D | 2 | 152 | 347194 | 1827.97 | 778 | 755 | 189.5 |
| D | 11 | 241 | 199515 | 1048.75 | 778 | 755 | 189.5 |
| D | 2 | 14 | 30662 | 157.8 | 778 | 755 | 189.5 |
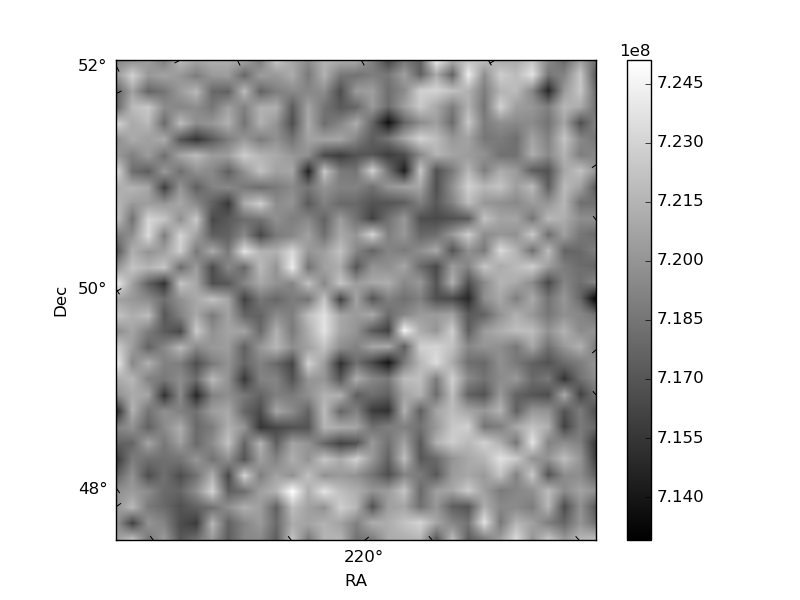
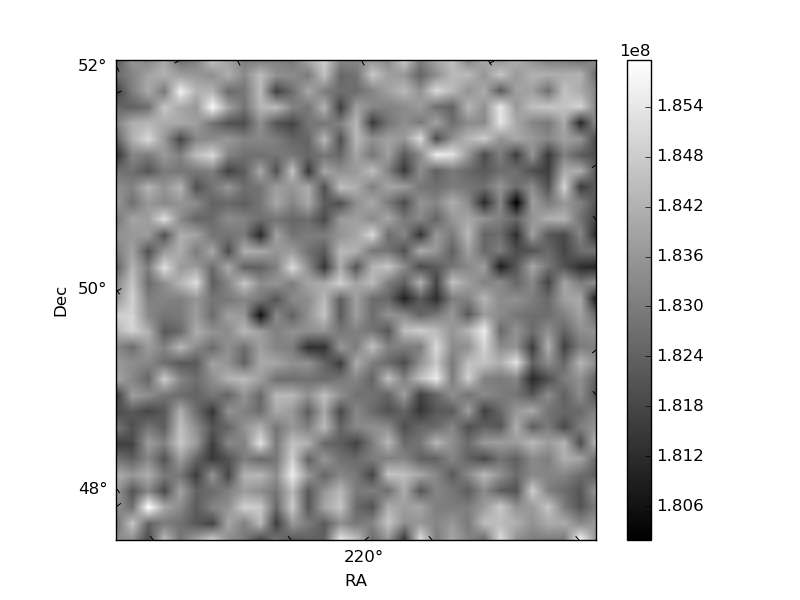
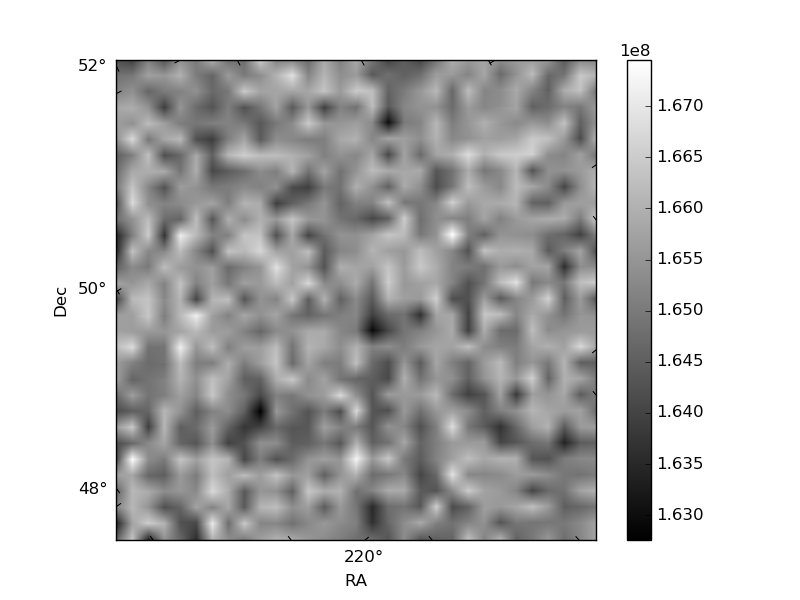
Histogram calculated using DETX and DETY for each event in the final _common_clean file
| Quadrant A | 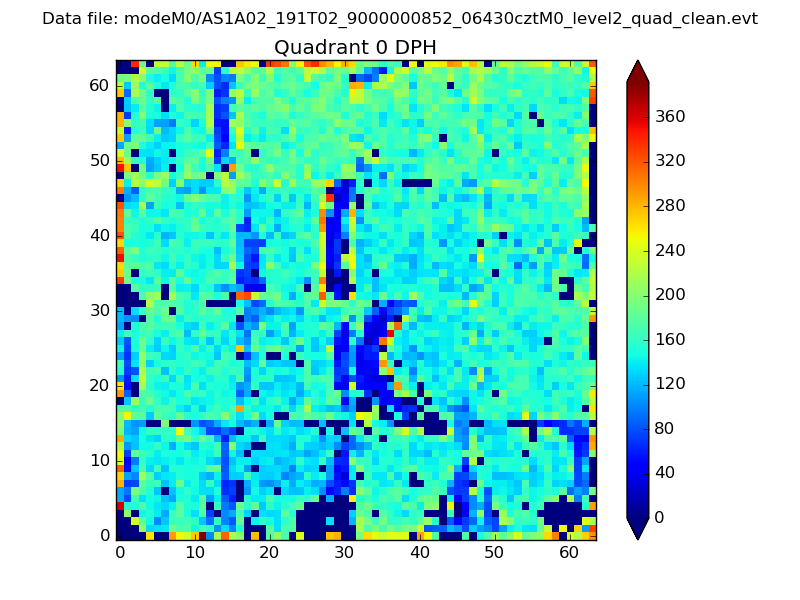 |
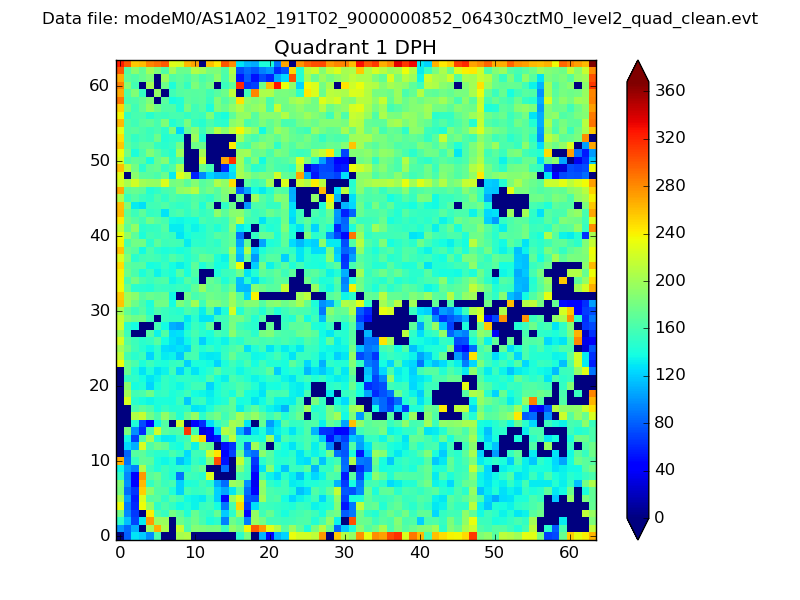 |
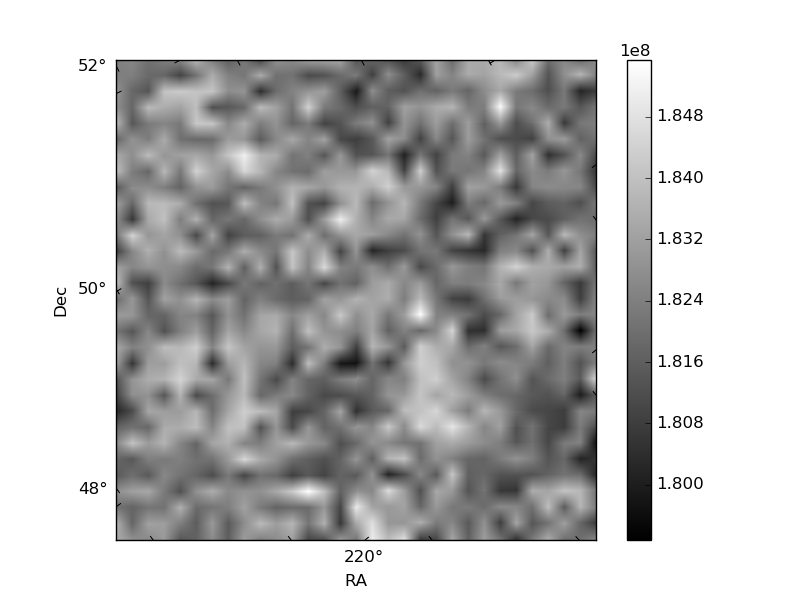
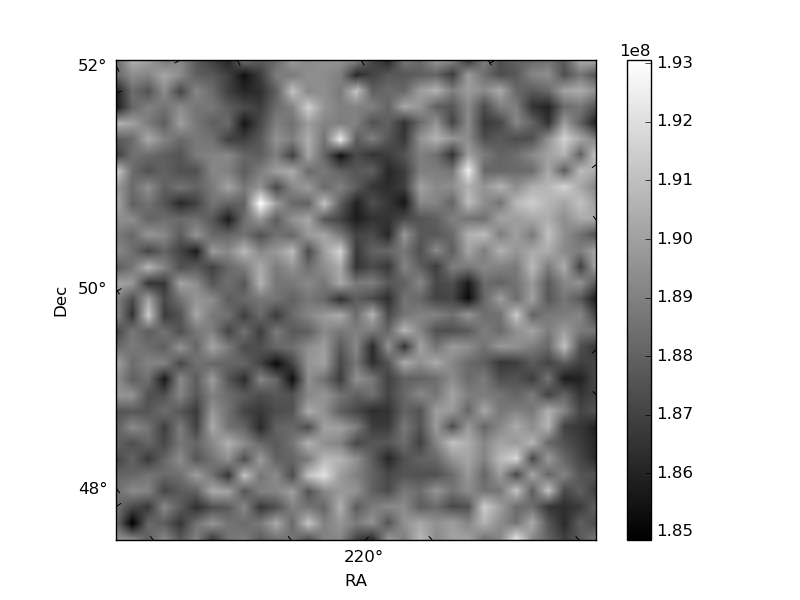
Quadrant B |
|---|---|---|---|
| Quadrant D | 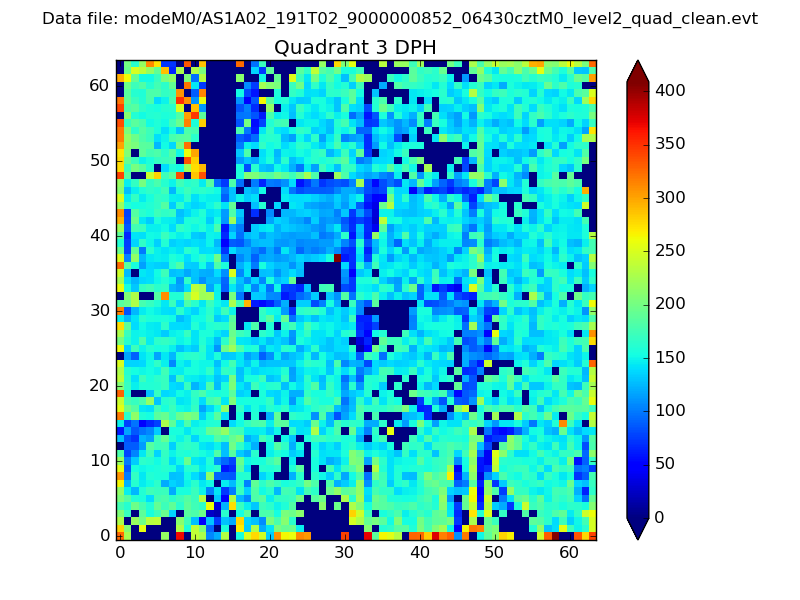 |
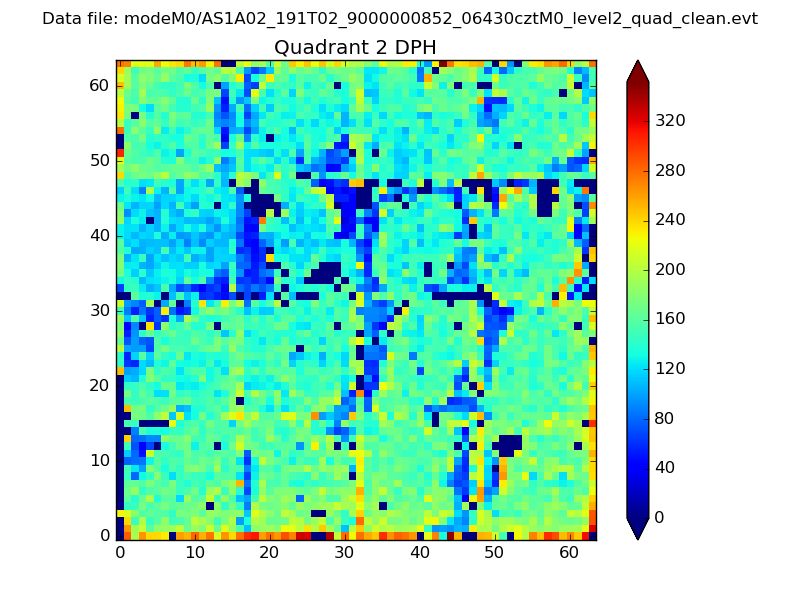 |
Quadrant C |
| Plot type | Count rate plots | Images |
|---|---|---|
| Comparison with Poisson distribution Blue bars denote a histogram of data divided into 1 sec bins. Red curve is a Poisson curve with rate = median count rate of data. |
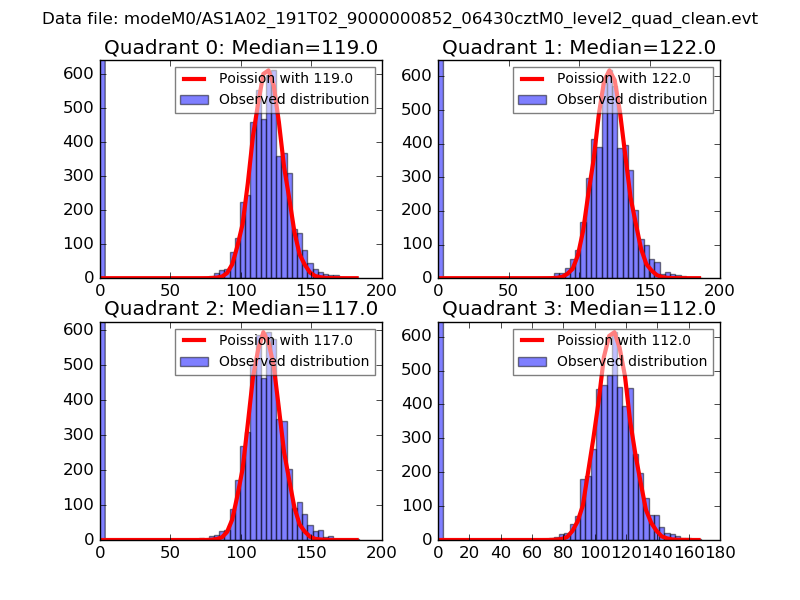 |
 |
| Quadrant-wise count rates Data is divided into 100 sec bins |
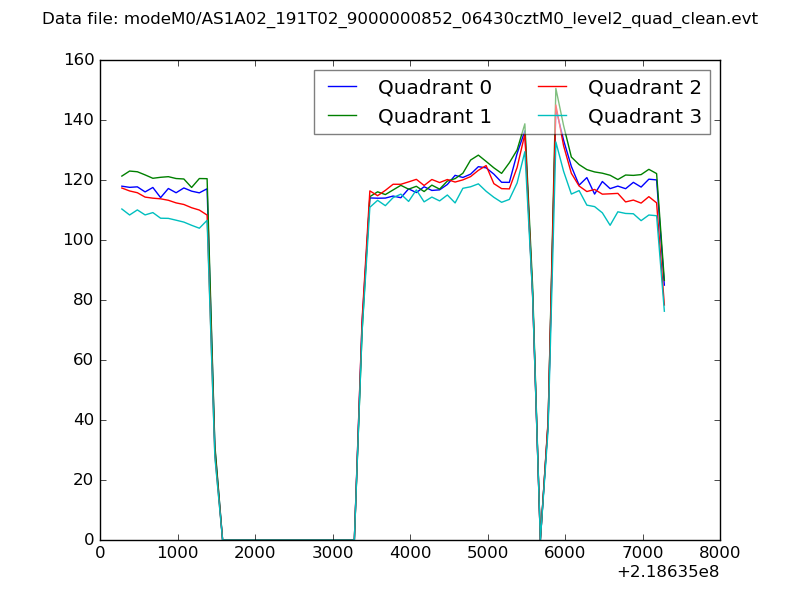 |
|
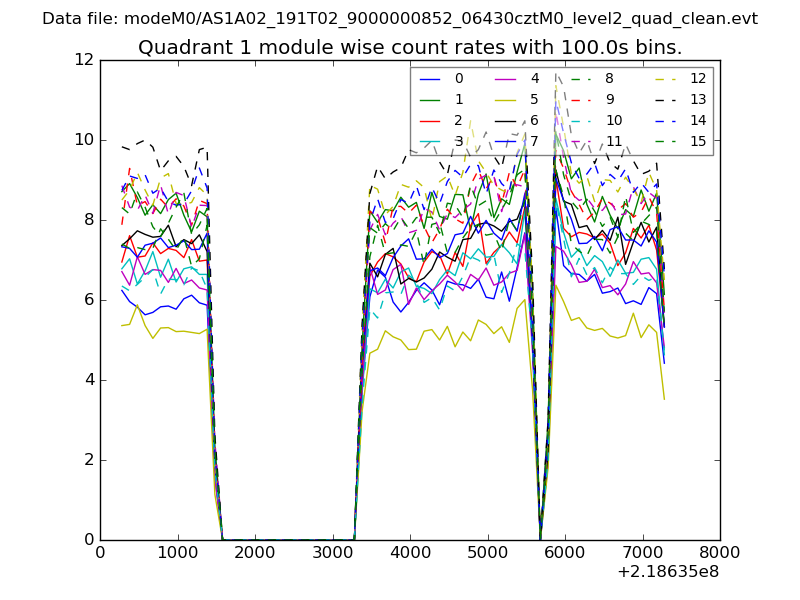
| Module-wise count rates for Quadrant A Data is divided into 100 sec bins |
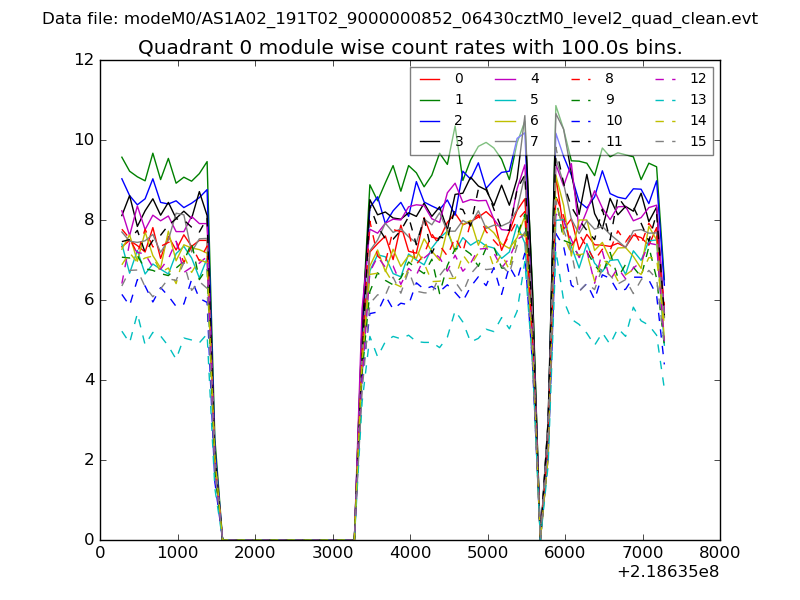 |
 |
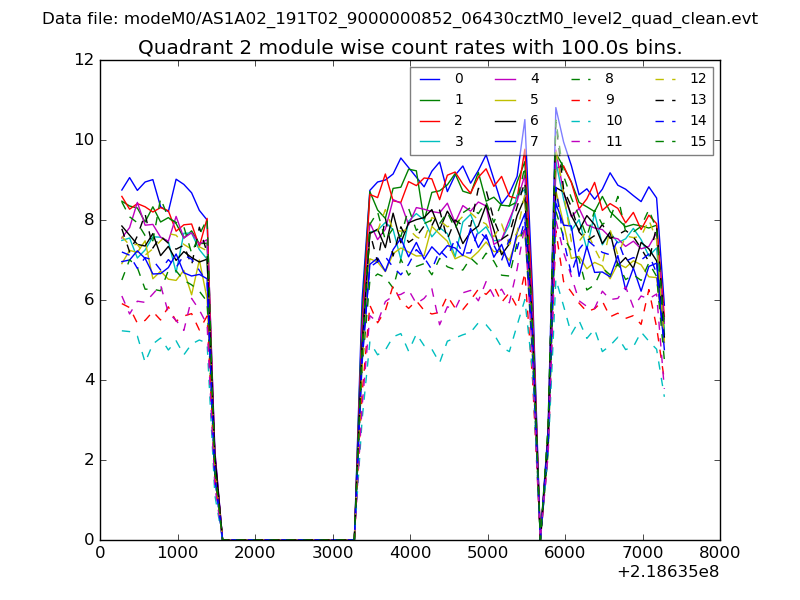
| Module-wise count rates for Quadrant B Data is divided into 100 sec bins |
 |
 |
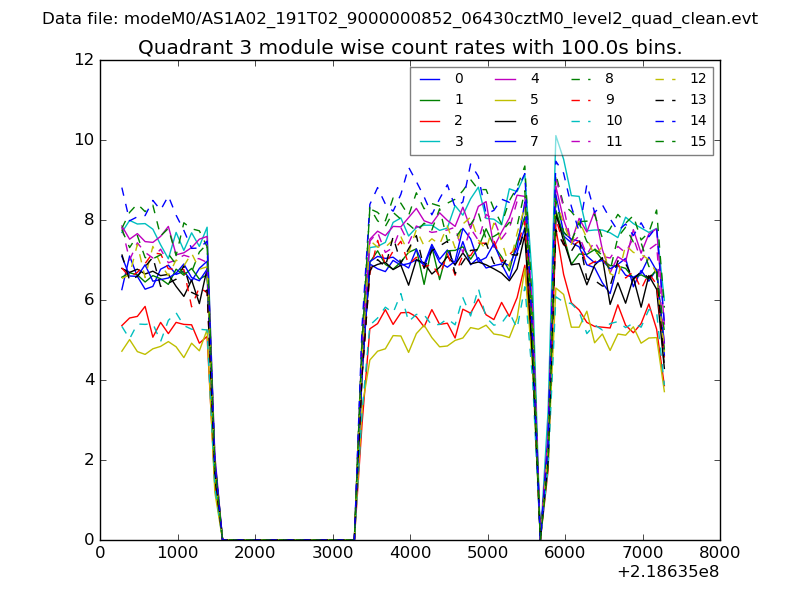
| Module-wise count rates for Quadrant C Data is divided into 100 sec bins |
 |
 |
| Module-wise count rates for Quadrant D Data is divided into 100 sec bins |
 |
 |
| Parameter | Plot |
|---|---|
| CZT HV Monitor | 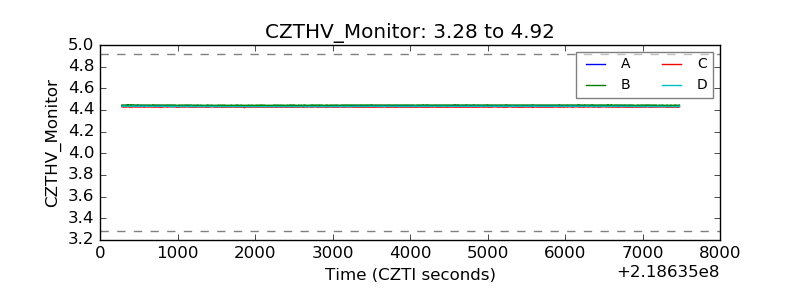 |
| D_VDD | 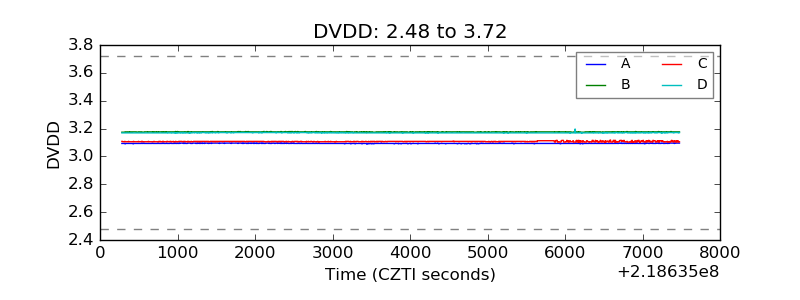 |
| Temperature 1 | 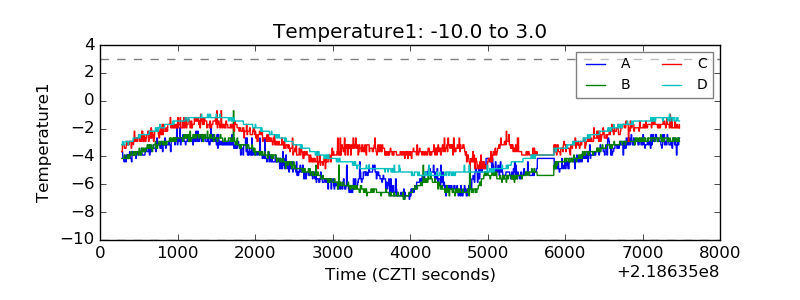 |
| Veto HV Monitor | 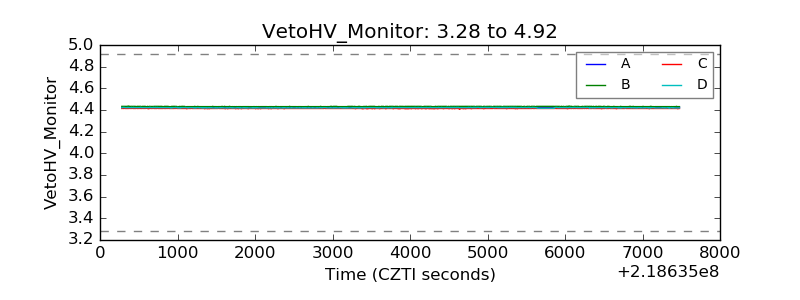 |
| Veto LLD | 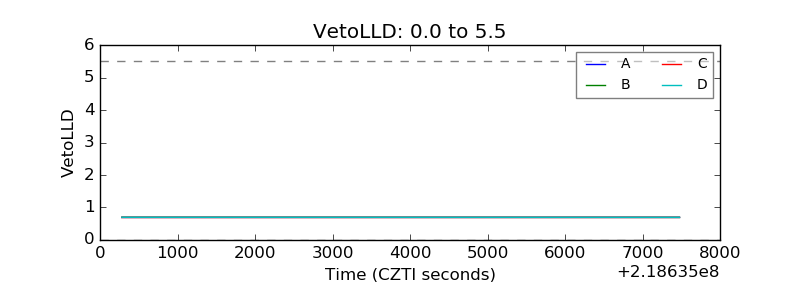 |
| Alpha Counter | 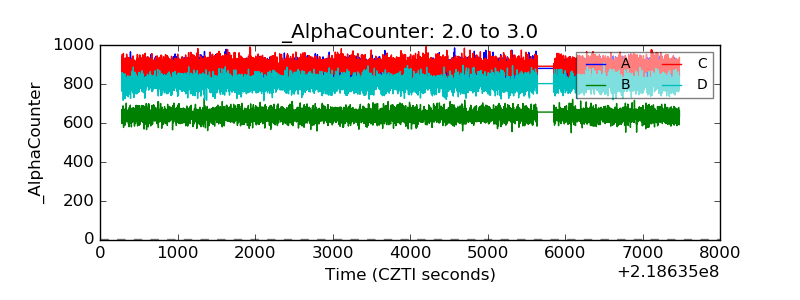 |
| _CPM_Rate | 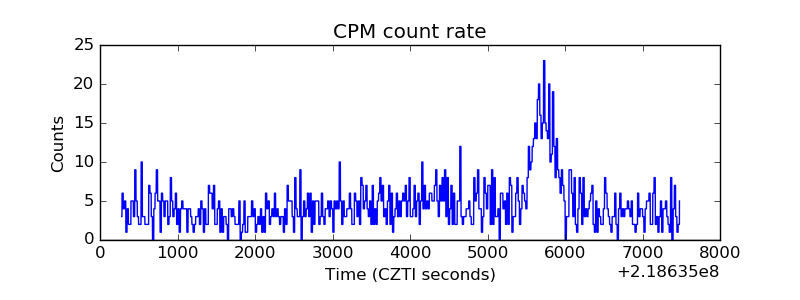 |
| CZT Counter | 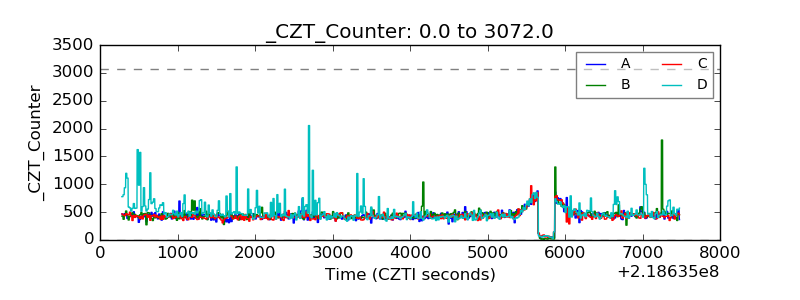 |
| +2.5 Volts monitor | 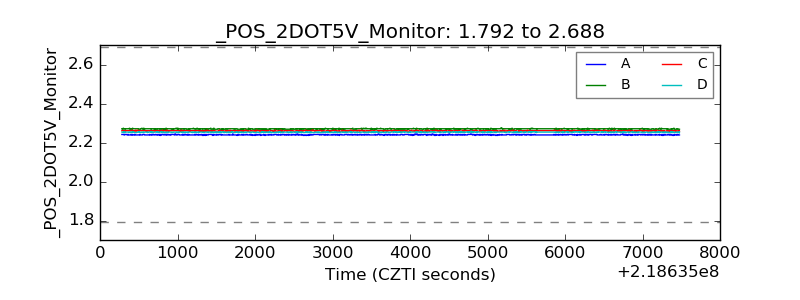 |
| +5 Volts monitor |  |
| _ROLL_ROT | 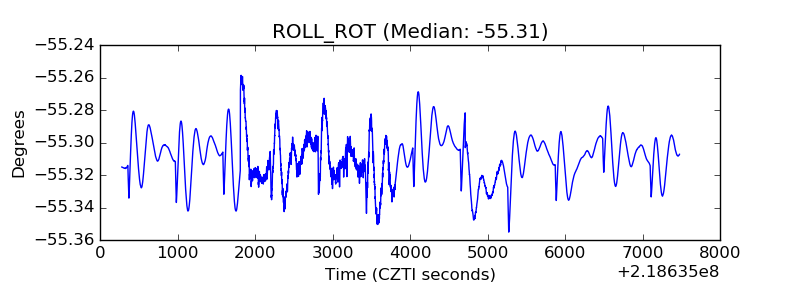 |
| _Roll_DEC | 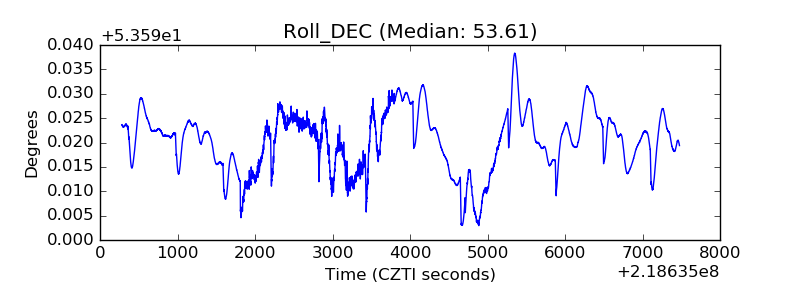 |
| _Roll_RA | 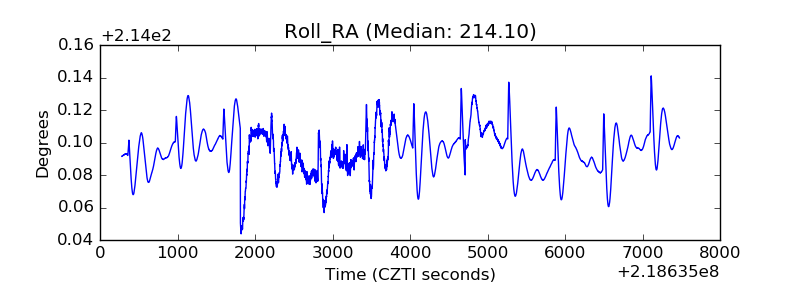 |
| Veto Counter | 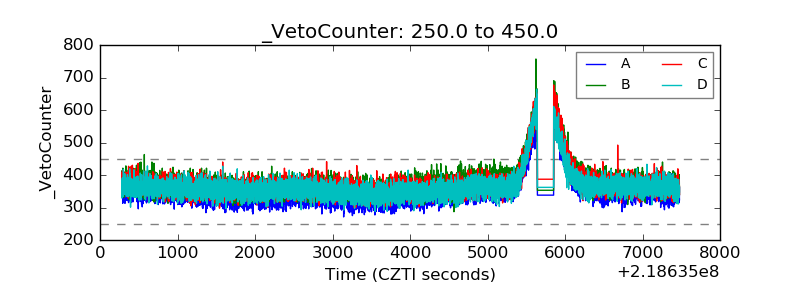 |