| Param | Original file | Final file |
|---|---|---|
| Filename | modeM0/AS1A02_191T02_9000000852_06434cztM0_level2.evt | modeM0/AS1A02_191T02_9000000852_06434cztM0_level2_quad_clean.evt |
| Size (bytes) | 706,452,480 | 134,956,800 |
| Size | 673.7 MB | 128.7 MB |
| Events in quadrant A | 5,020,584 | 826,861 |
| Events in quadrant B | 5,367,355 | 847,158 |
| Events in quadrant C | 4,923,140 | 826,093 |
| Events in quadrant D | 5,311,507 | 799,157 |
| Mode SS | |||
|---|---|---|---|
| Quadrant | BADHDUFLAG | Total packets | Discarded packets |
| A | 0 | 234 | 0 |
| B | 0 | 234 | 0 |
| C | 0 | 234 | 0 |
| D | 0 | 234 | 0 |
| Mode M0 | |||
|---|---|---|---|
| Quadrant | BADHDUFLAG | Total packets | Discarded packets |
| A | 0 | 23053 | 4 |
| B | 0 | 23740 | 3 |
| C | 0 | 22994 | 3 |
| D | 0 | 24066 | 3 |
| Mode M9 | |||
|---|---|---|---|
| Quadrant | BADHDUFLAG | Total packets | Discarded packets |
| A | 0 | 12 | 0 |
| B | 0 | 12 | 0 |
| C | 0 | 12 | 0 |
| D | 0 | 12 | 0 |
| Quadrant | Total seconds | Saturated seconds | Saturation percentage |
|---|---|---|---|
| A | 11379 | 63 | 0.553651% |
| B | 11379 | 89 | 0.782143% |
| C | 11379 | 40 | 0.351525% |
| D | 11379 | 84 | 0.738202% |
Noise dominated data is calculated using 1-second bins in cleaned event files. If a bin has >2000 counts, and if more than 50% of those come from <1% of pixels, then it is considered to be noise-dominated and hence unusable.
| Quadrant | # 1 sec bins | Bins with >0 counts | Bins with >2000 counts | High rate bins dominated by noise | Noise dominated (total time) | Noise dominated (detector-on time) | Marked lightcurve |
|---|---|---|---|---|---|---|---|
| A | 12689 | 11381 | 0 | 0 | 0.00% | 0.00% | 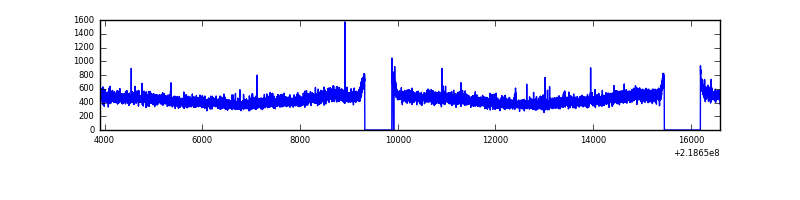 |
| B | 12689 | 11381 | 3 | 3 | 0.02% | 0.03% | 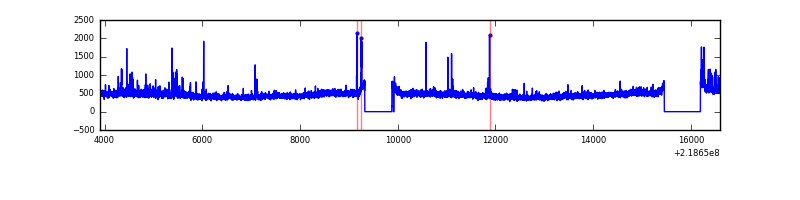 |
| C | 12689 | 11381 | 1 | 1 | 0.01% | 0.01% |  |
| D | 12689 | 11381 | 26 | 26 | 0.20% | 0.23% | 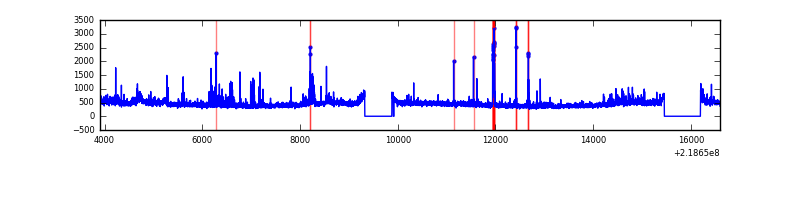 |
Top three noisy pixels from each quadrant. If the there are fewer than three noisy pixels in the level2.evt file, extra rows are filled as -1
| Pixel properties | Quadrant properties | ||||||
|---|---|---|---|---|---|---|---|
| Quadrant | DetID | PixID | Counts | Sigma | Mean | Median | Sigma |
| A | 8 | 15 | 18840 | 66.02 | 1295 | 1264 | 266.2 |
| A | 0 | 226 | 12532 | 42.33 | 1295 | 1264 | 266.2 |
| A | 12 | 194 | 11895 | 39.93 | 1295 | 1264 | 266.2 |
| B | 0 | 228 | 167620 | 662.45 | 1303 | 1273 | 251.1 |
| B | 15 | 204 | 76304 | 298.8 | 1303 | 1273 | 251.1 |
| B | 12 | 111 | 25564 | 96.74 | 1303 | 1273 | 251.1 |
| C | 8 | 128 | 10219 | 30.96 | 1255 | 1258 | 289.4 |
| C | 13 | 61 | 9996 | 30.19 | 1255 | 1258 | 289.4 |
| C | 9 | 54 | 7397 | 21.21 | 1255 | 1258 | 289.4 |
| D | 2 | 152 | 281032 | 900.41 | 1259 | 1217 | 310.8 |
| D | 13 | 169 | 76043 | 240.78 | 1259 | 1217 | 310.8 |
| D | 2 | 136 | 69634 | 220.16 | 1259 | 1217 | 310.8 |
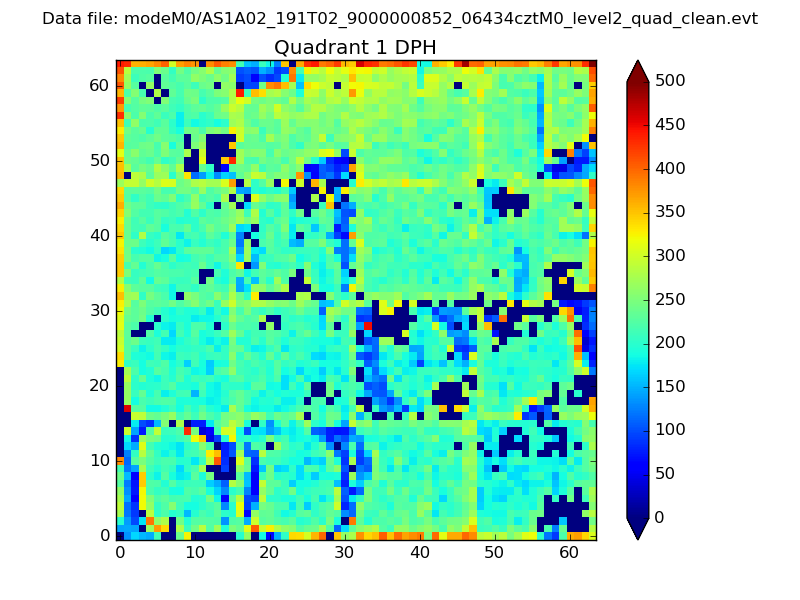
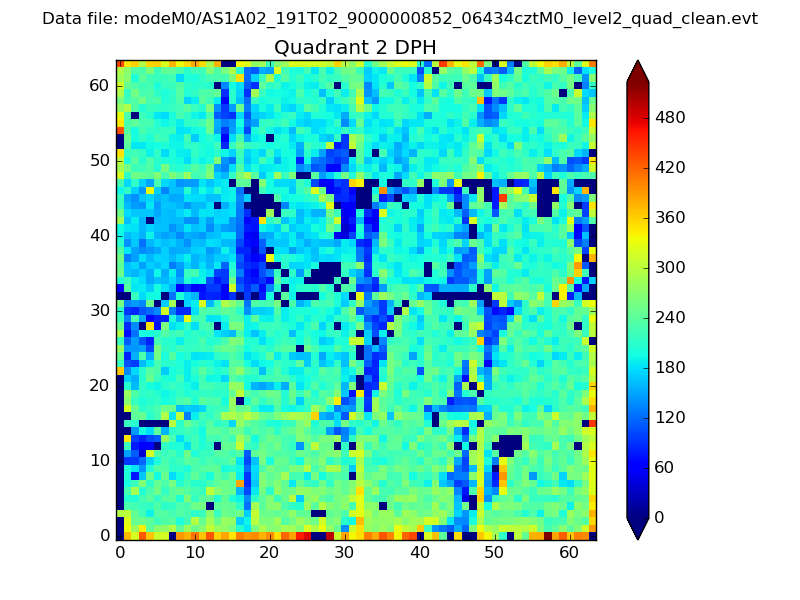
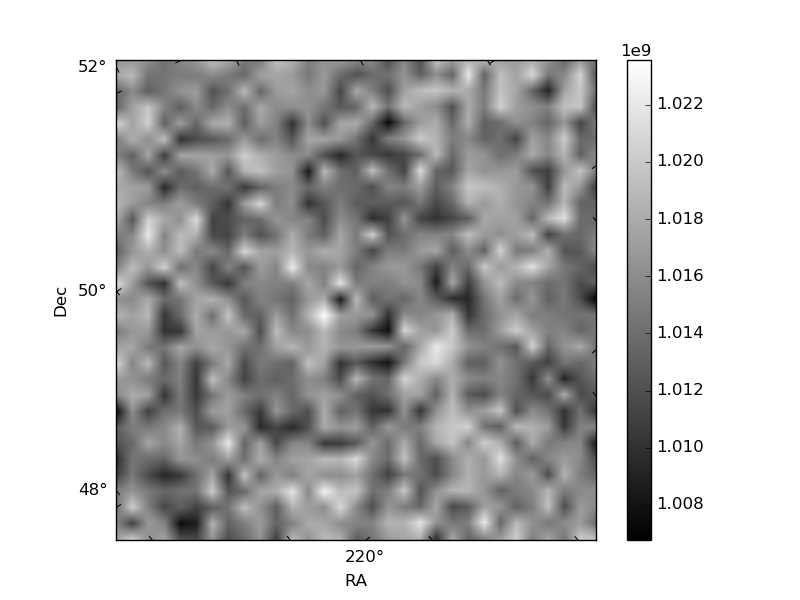
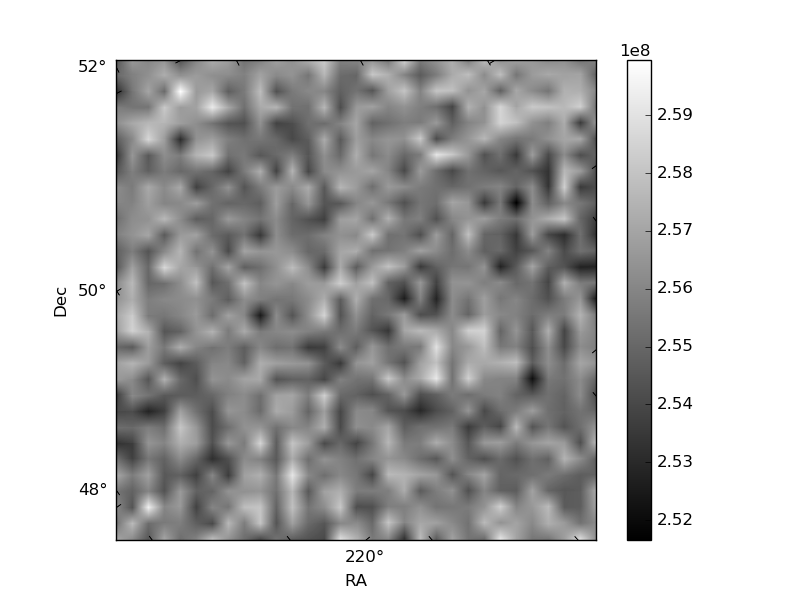
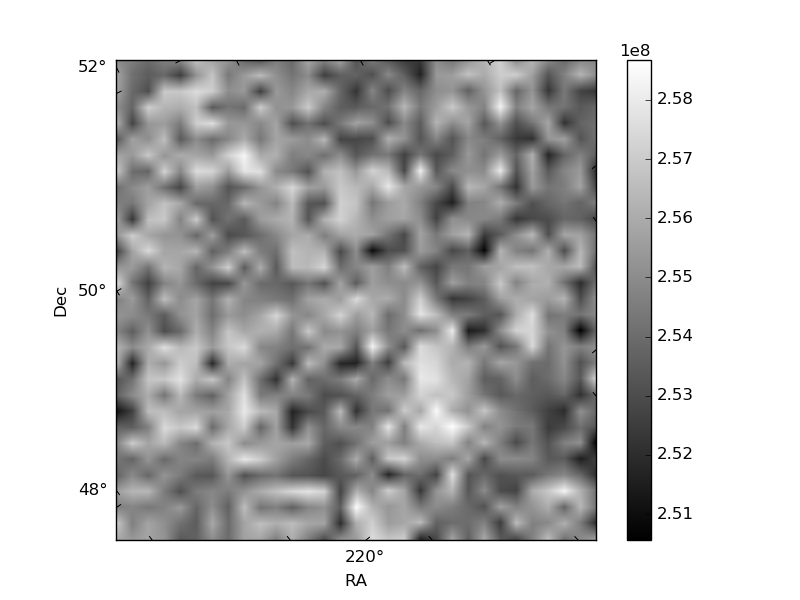
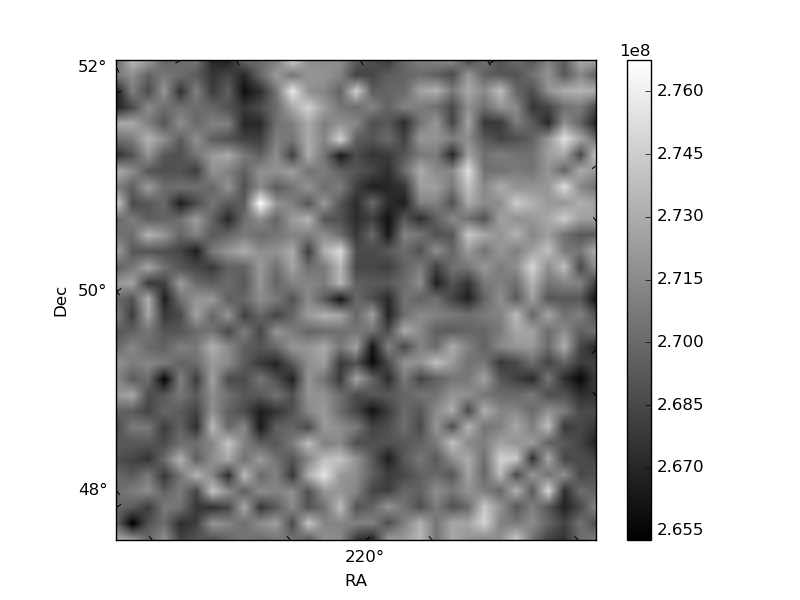
Histogram calculated using DETX and DETY for each event in the final _common_clean file
| Quadrant A | 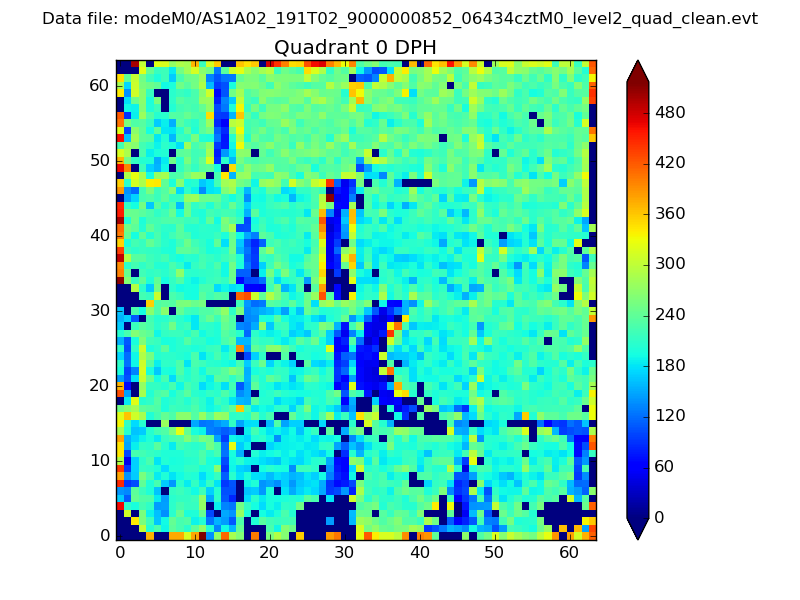 |
 |
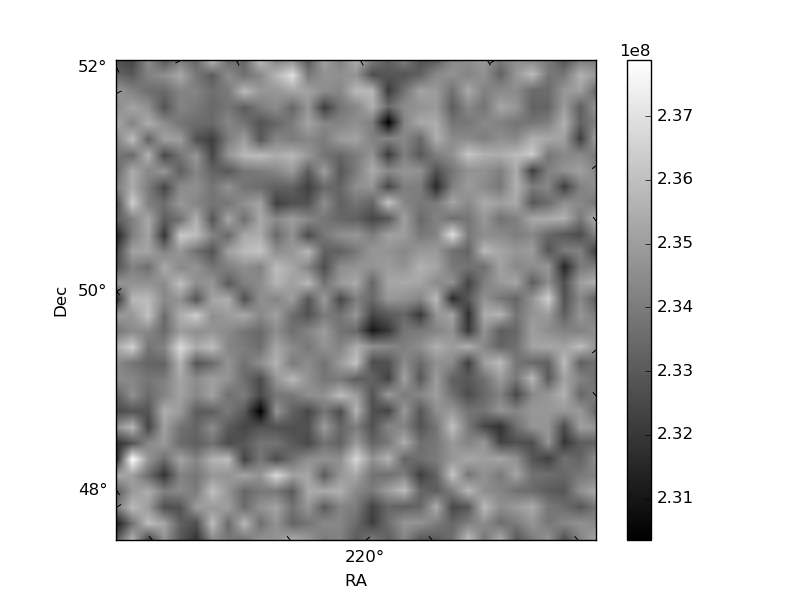
Quadrant B |
|---|---|---|---|
| Quadrant D | 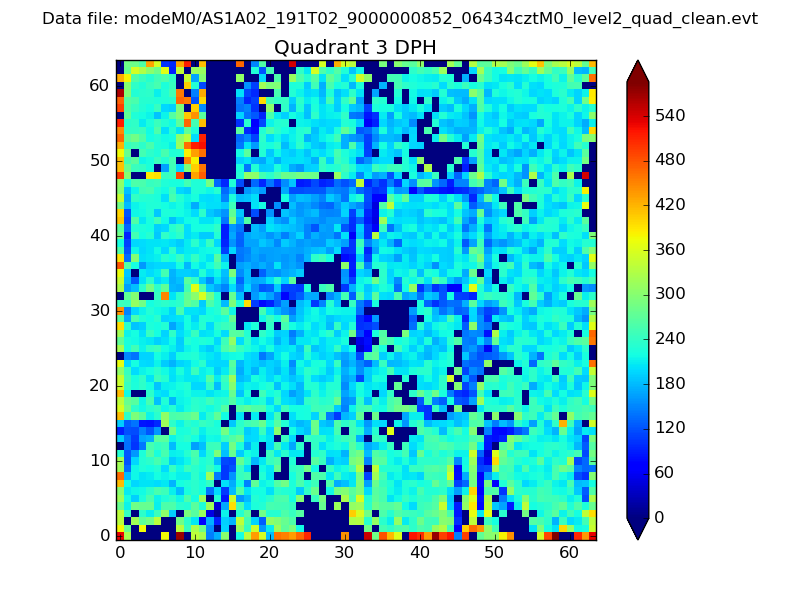 |
 |
Quadrant C |
| Plot type | Count rate plots | Images |
|---|---|---|
| Comparison with Poisson distribution Blue bars denote a histogram of data divided into 1 sec bins. Red curve is a Poisson curve with rate = median count rate of data. |
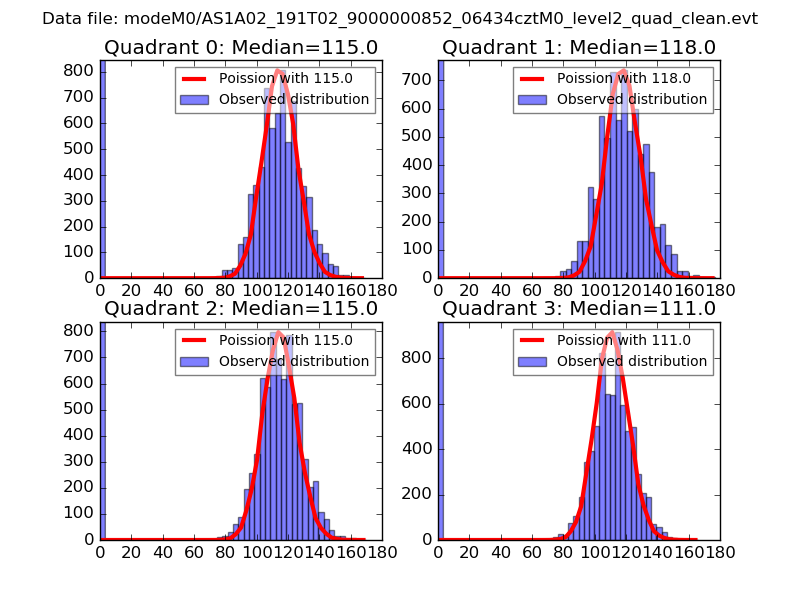 |
 |
| Quadrant-wise count rates Data is divided into 100 sec bins |
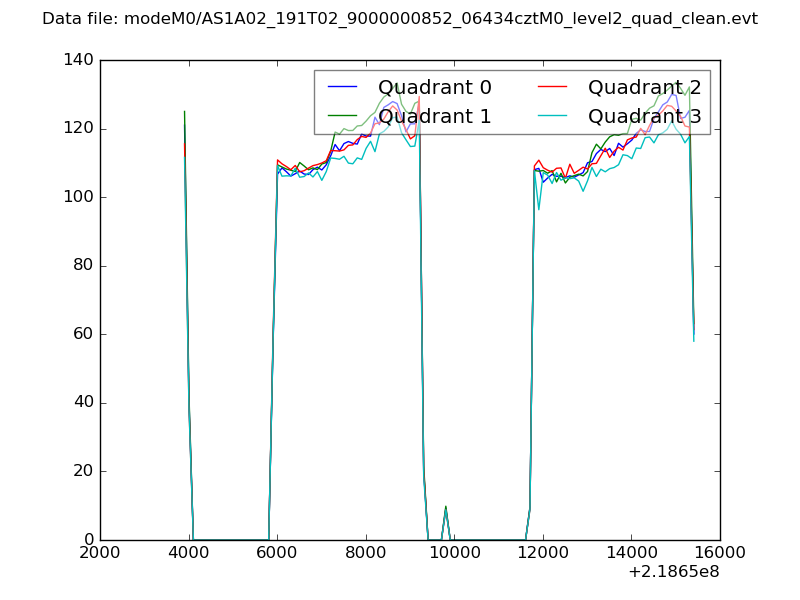 |
|
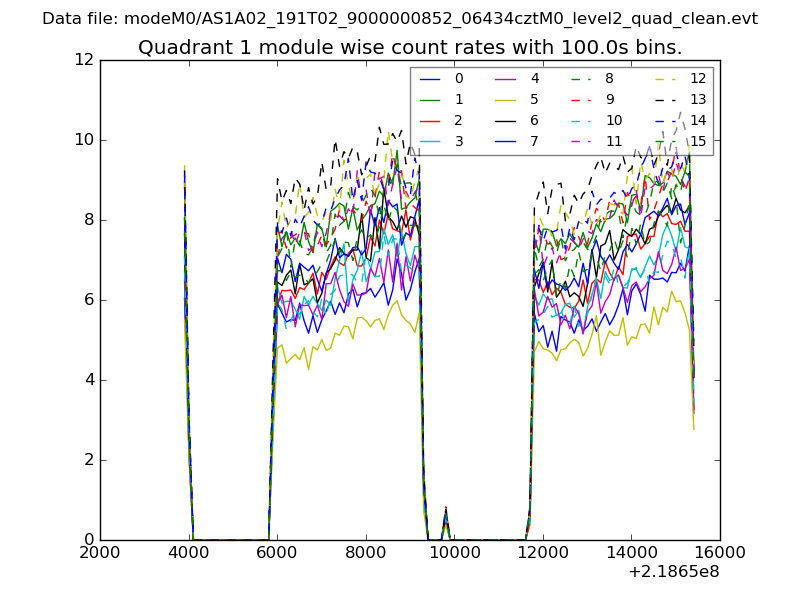
| Module-wise count rates for Quadrant A Data is divided into 100 sec bins |
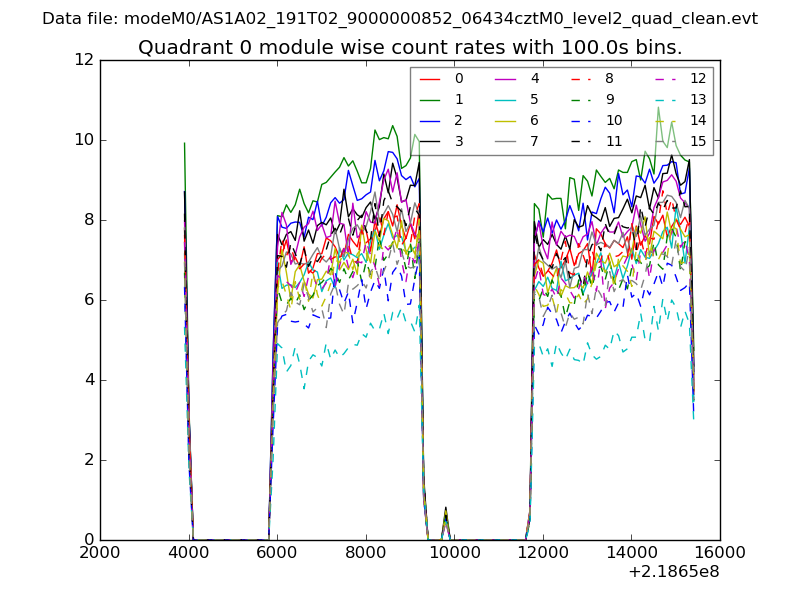 |
 |
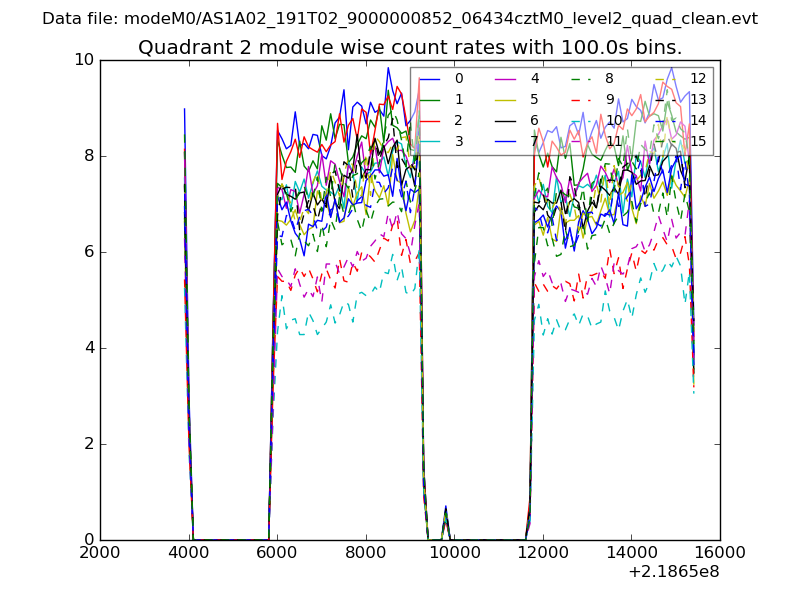
| Module-wise count rates for Quadrant B Data is divided into 100 sec bins |
 |
 |
| Module-wise count rates for Quadrant C Data is divided into 100 sec bins |
 |
 |
| Module-wise count rates for Quadrant D Data is divided into 100 sec bins |
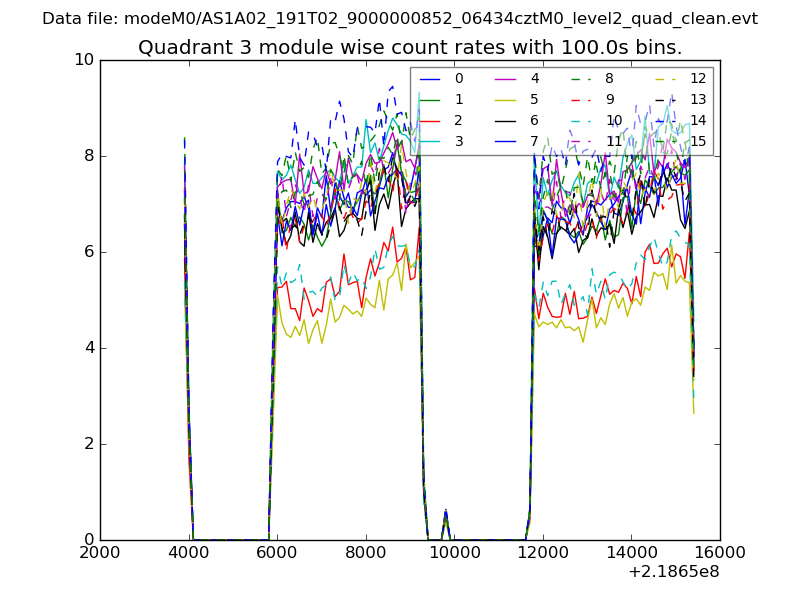 |
 |
| Parameter | Plot |
|---|---|
| CZT HV Monitor | 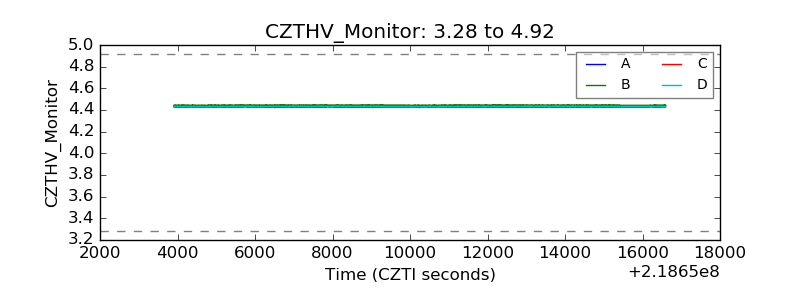 |
| D_VDD | 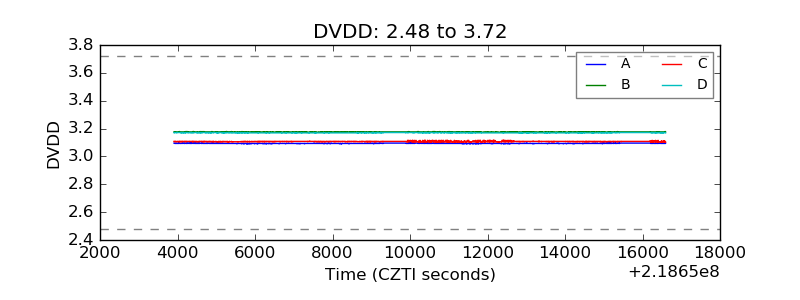 |
| Temperature 1 | 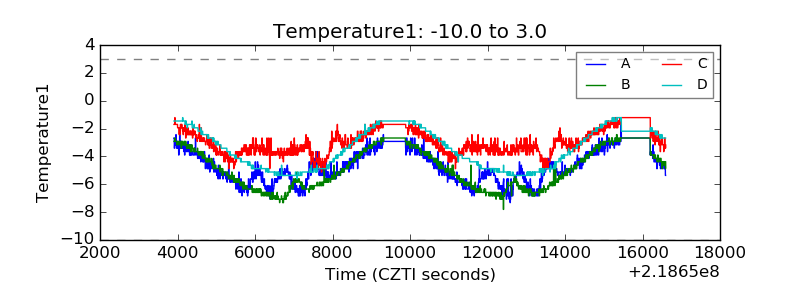 |
| Veto HV Monitor | 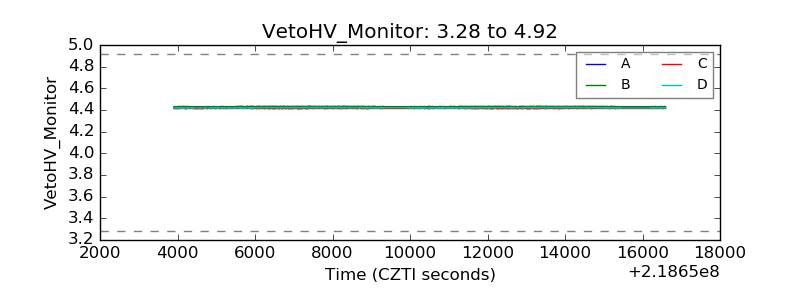 |
| Veto LLD | 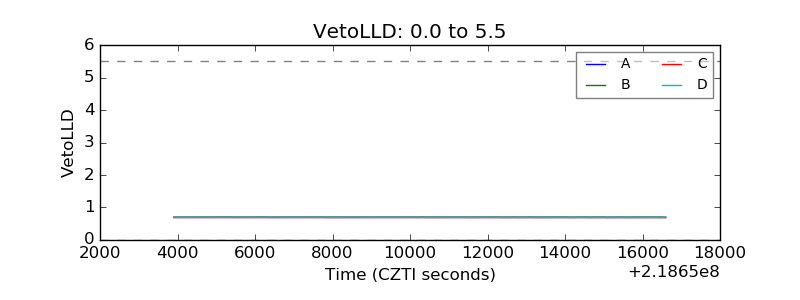 |
| Alpha Counter | 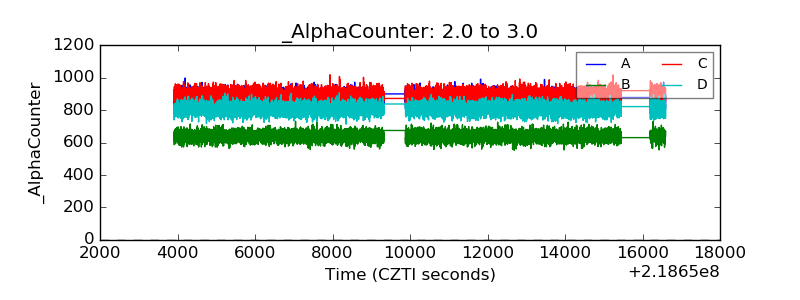 |
| _CPM_Rate | 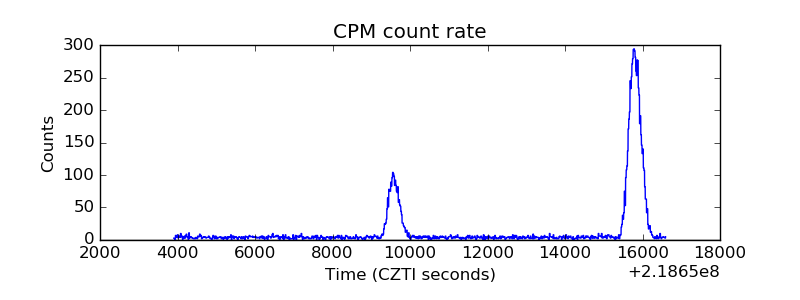 |
| CZT Counter | 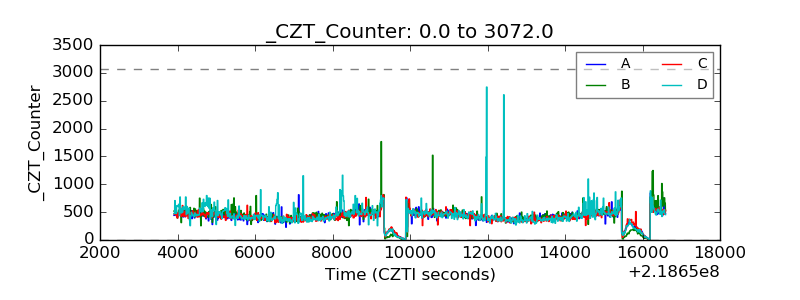 |
| +2.5 Volts monitor |  |
| +5 Volts monitor |  |
| _ROLL_ROT | 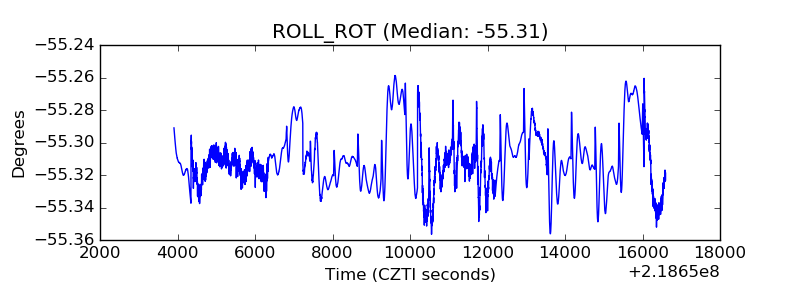 |
| _Roll_DEC | 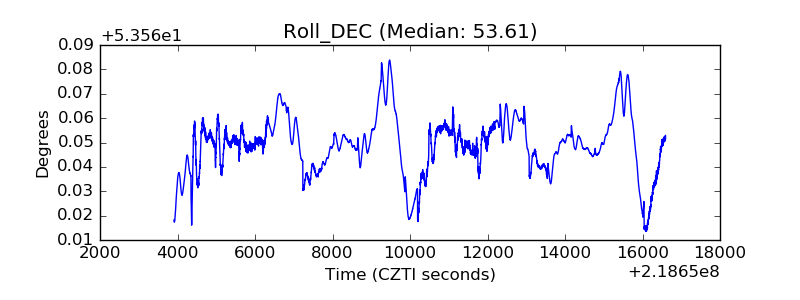 |
| _Roll_RA | 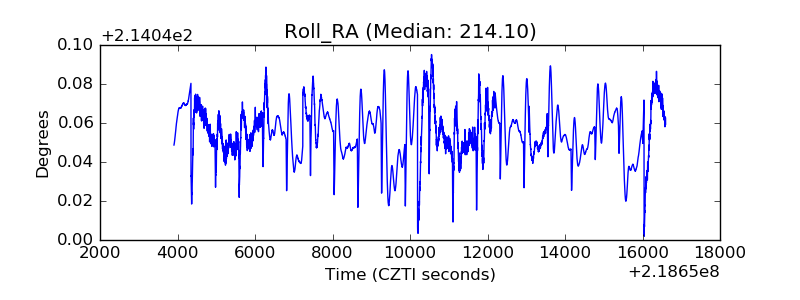 |
| Veto Counter | 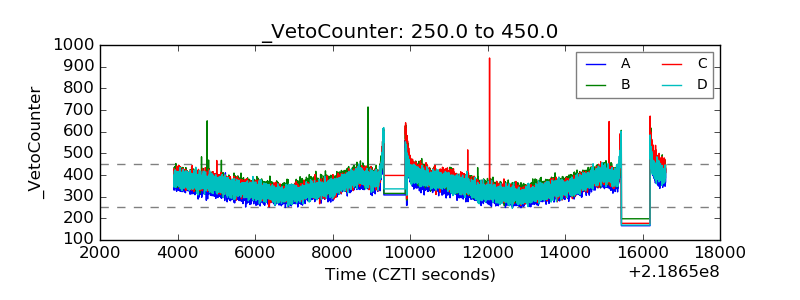 |