| Param | Original file | Final file |
|---|---|---|
| Filename | modeM0/AS1A02_191T02_9000000852_06435cztM0_level2.evt | modeM0/AS1A02_191T02_9000000852_06435cztM0_level2_quad_clean.evt |
| Size (bytes) | 186,554,880 | 29,039,040 |
| Size | 177.9 MB | 27.7 MB |
| Events in quadrant A | 1,284,811 | 166,043 |
| Events in quadrant B | 1,455,956 | 167,691 |
| Events in quadrant C | 1,296,315 | 168,785 |
| Events in quadrant D | 1,406,650 | 162,549 |
| Mode SS | |||
|---|---|---|---|
| Quadrant | BADHDUFLAG | Total packets | Discarded packets |
| A | 0 | 60 | 0 |
| B | 0 | 60 | 0 |
| C | 0 | 60 | 0 |
| D | 0 | 60 | 0 |
| Mode M0 | |||
|---|---|---|---|
| Quadrant | BADHDUFLAG | Total packets | Discarded packets |
| A | 0 | 6065 | 1 |
| B | 0 | 6549 | 1 |
| C | 0 | 6052 | 1 |
| D | 0 | 6420 | 1 |
| Mode M9 | |||
|---|---|---|---|
| Quadrant | BADHDUFLAG | Total packets | Discarded packets |
| A | 0 | 1 | 0 |
| B | 0 | 1 | 0 |
| C | 0 | 1 | 0 |
| D | 0 | 2 | 0 |
| Quadrant | Total seconds | Saturated seconds | Saturation percentage |
|---|---|---|---|
| A | 2998 | 2 | 0.066711% |
| B | 2998 | 14 | 0.466978% |
| C | 2998 | 6 | 0.200133% |
| D | 2998 | 13 | 0.433622% |
Noise dominated data is calculated using 1-second bins in cleaned event files. If a bin has >2000 counts, and if more than 50% of those come from <1% of pixels, then it is considered to be noise-dominated and hence unusable.
| Quadrant | # 1 sec bins | Bins with >0 counts | Bins with >2000 counts | High rate bins dominated by noise | Noise dominated (total time) | Noise dominated (detector-on time) | Marked lightcurve |
|---|---|---|---|---|---|---|---|
| A | 2997 | 2997 | 0 | 0 | 0.00% | 0.00% | 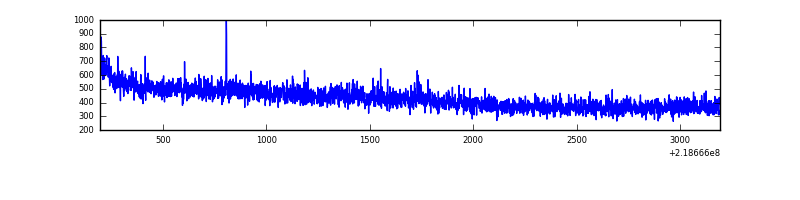 |
| B | 2997 | 2997 | 0 | 0 | 0.00% | 0.00% | 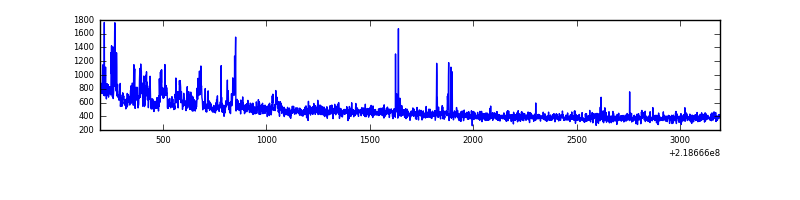 |
| C | 2997 | 2997 | 0 | 0 | 0.00% | 0.00% | 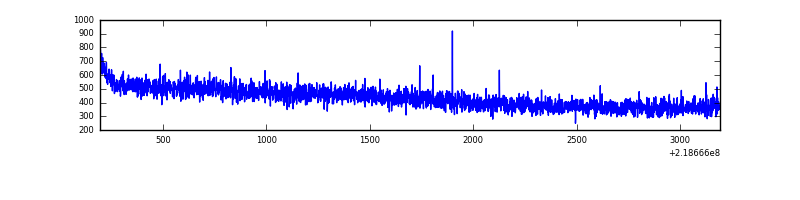 |
| D | 2997 | 2997 | 11 | 11 | 0.37% | 0.37% | 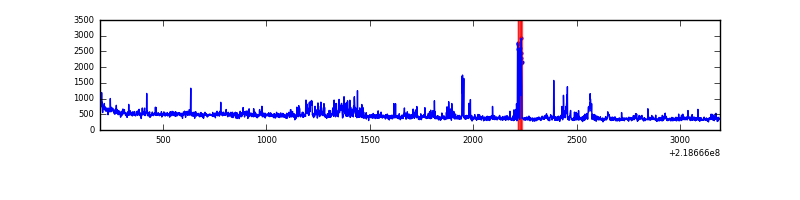 |
Top three noisy pixels from each quadrant. If the there are fewer than three noisy pixels in the level2.evt file, extra rows are filled as -1
| Pixel properties | Quadrant properties | ||||||
|---|---|---|---|---|---|---|---|
| Quadrant | DetID | PixID | Counts | Sigma | Mean | Median | Sigma |
| A | 10 | 133 | 4324 | 58.33 | 330 | 322 | 68.6 |
| A | 8 | 15 | 4139 | 55.63 | 330 | 322 | 68.6 |
| A | 0 | 226 | 3142 | 41.1 | 330 | 322 | 68.6 |
| B | 0 | 228 | 90197 | 1351.2 | 337 | 330 | 66.5 |
| B | 15 | 204 | 21576 | 319.44 | 337 | 330 | 66.5 |
| B | 3 | 220 | 15449 | 227.32 | 337 | 330 | 66.5 |
| C | 8 | 128 | 9237 | 113.35 | 328 | 329 | 78.6 |
| C | 8 | 112 | 4088 | 47.83 | 328 | 329 | 78.6 |
| C | 8 | 144 | 3216 | 36.73 | 328 | 329 | 78.6 |
| D | 2 | 152 | 78924 | 954.46 | 324 | 312 | 82.4 |
| D | 13 | 169 | 44596 | 537.67 | 324 | 312 | 82.4 |
| D | 13 | 172 | 14195 | 168.56 | 324 | 312 | 82.4 |
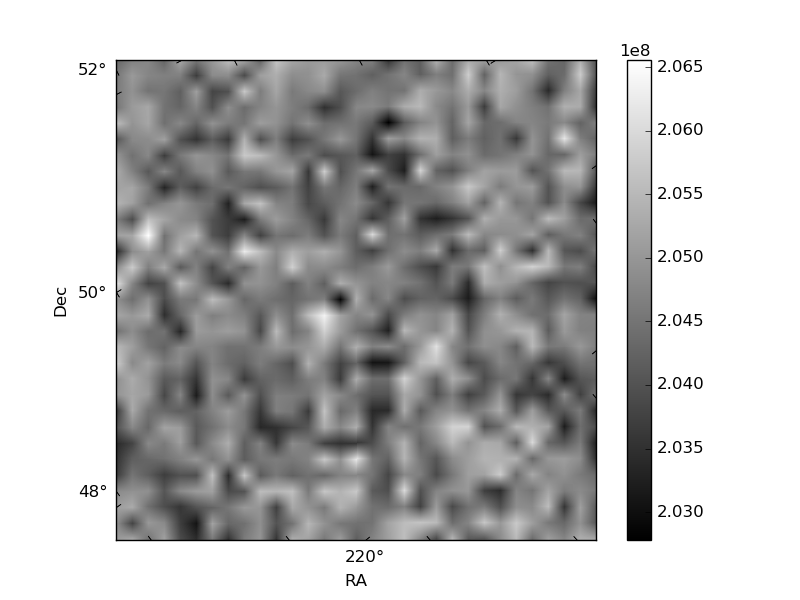
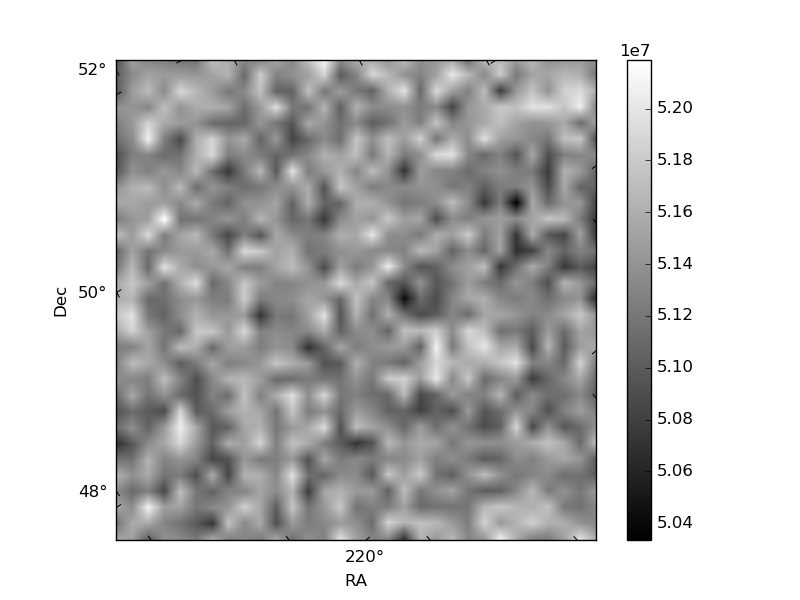
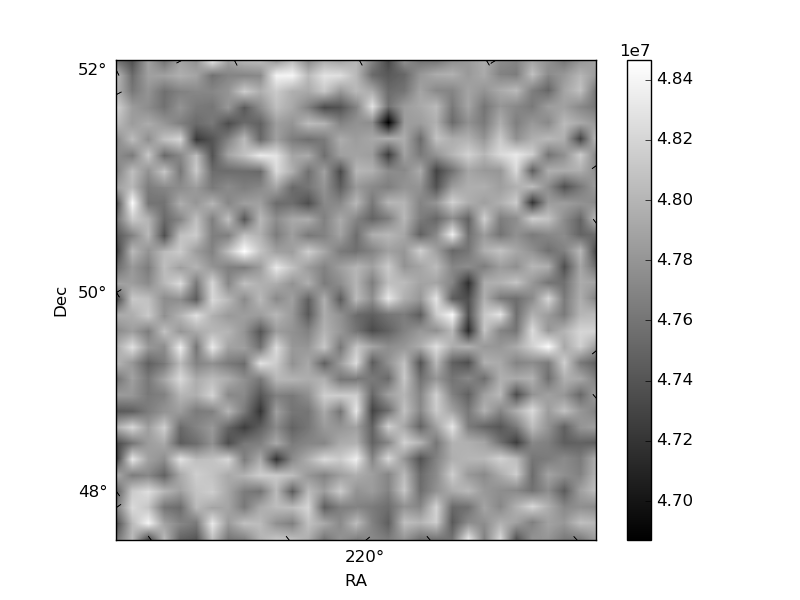
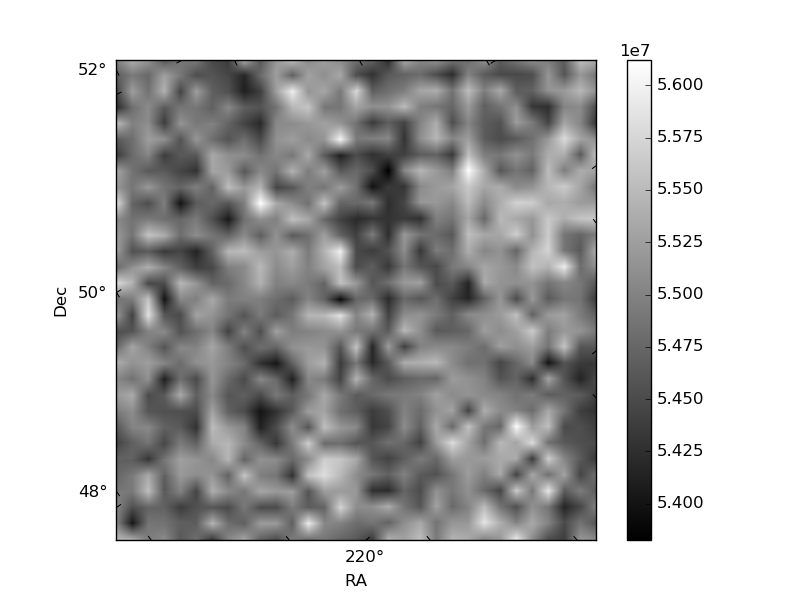
Histogram calculated using DETX and DETY for each event in the final _common_clean file
| Quadrant A | 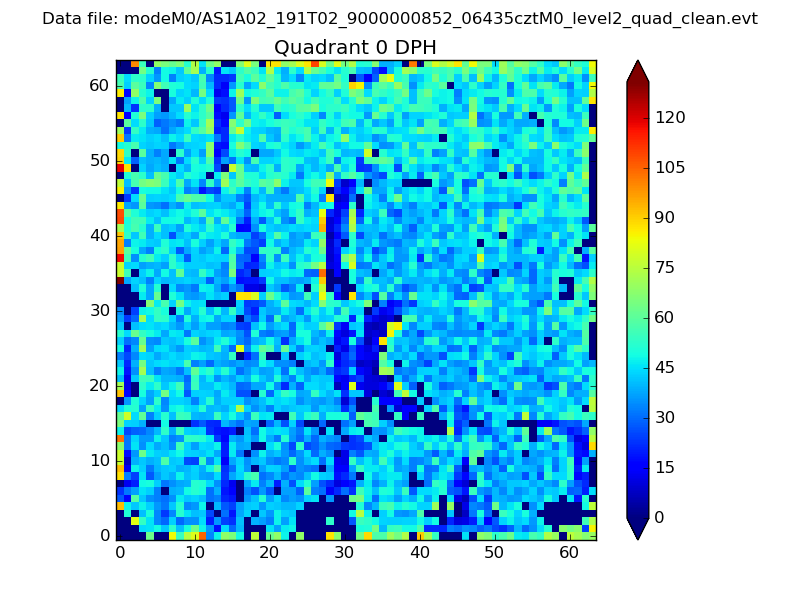 |
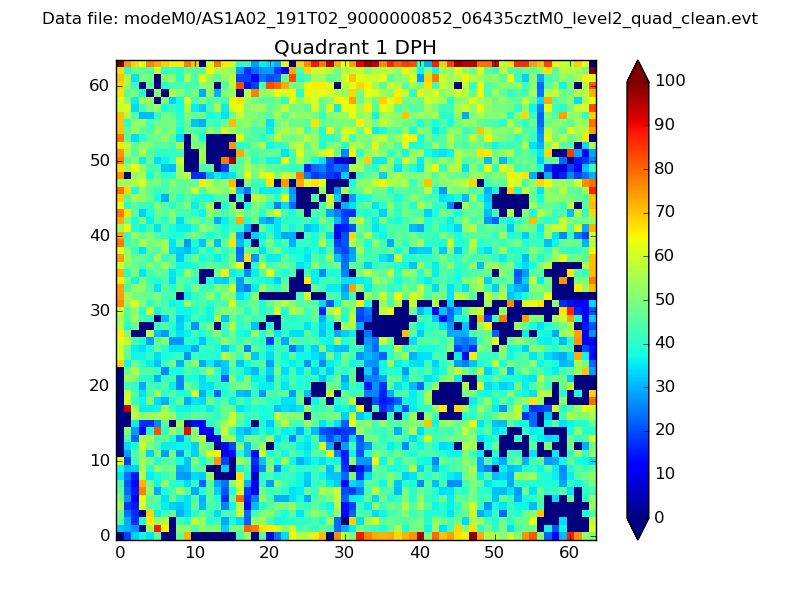 |
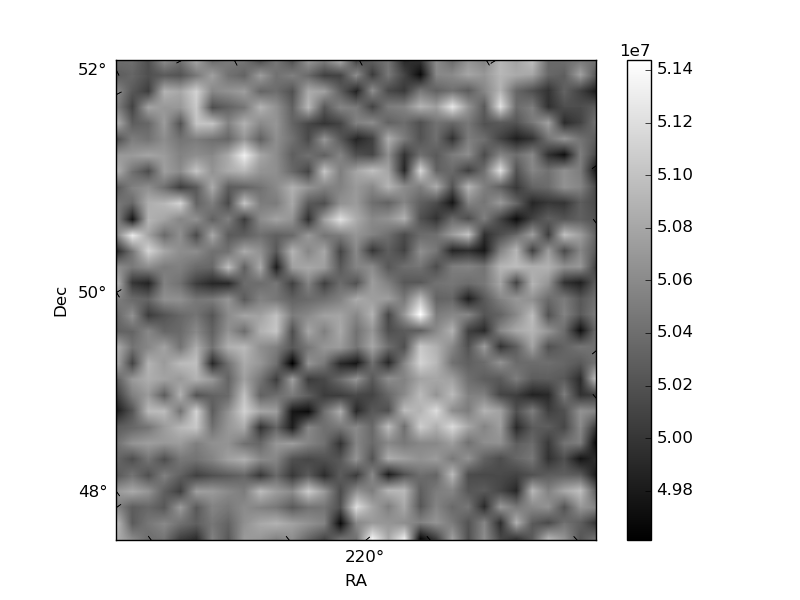
Quadrant B |
|---|---|---|---|
| Quadrant D | 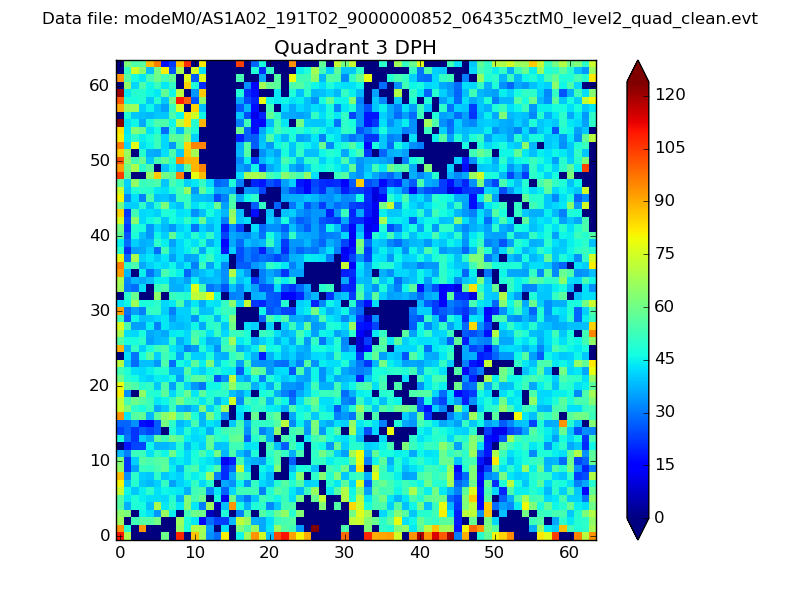 |
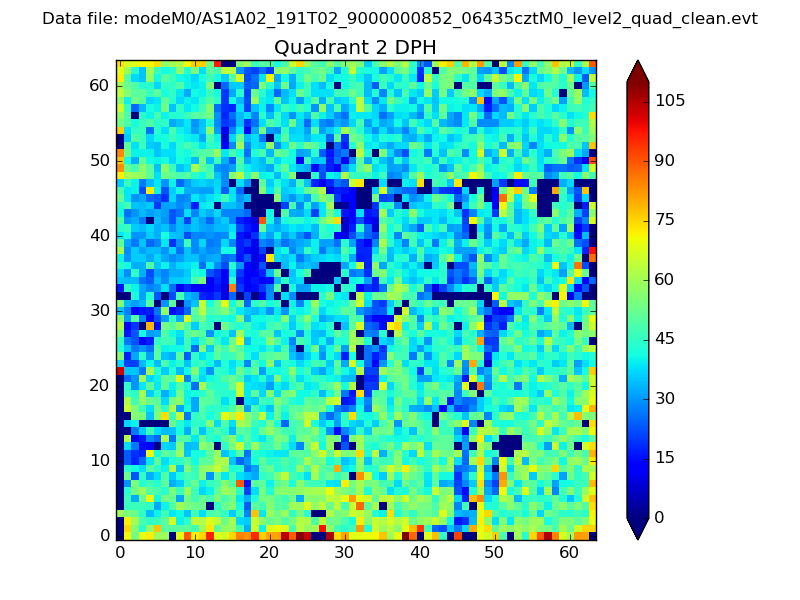 |
Quadrant C |
| Plot type | Count rate plots | Images |
|---|---|---|
| Comparison with Poisson distribution Blue bars denote a histogram of data divided into 1 sec bins. Red curve is a Poisson curve with rate = median count rate of data. |
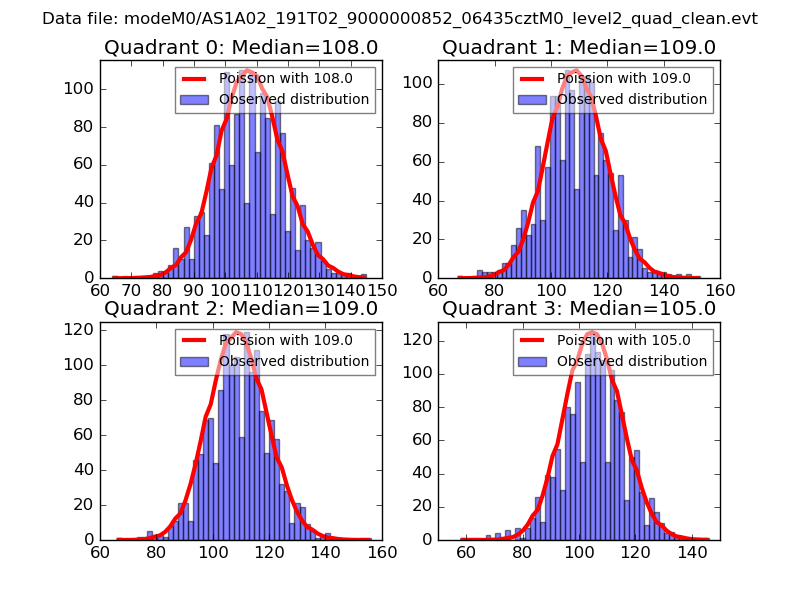 |
 |
| Quadrant-wise count rates Data is divided into 100 sec bins |
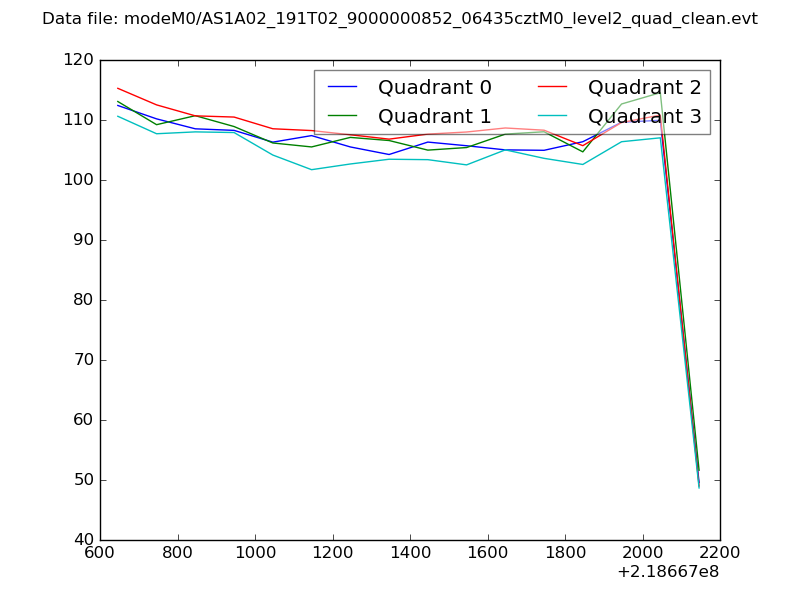 |
|
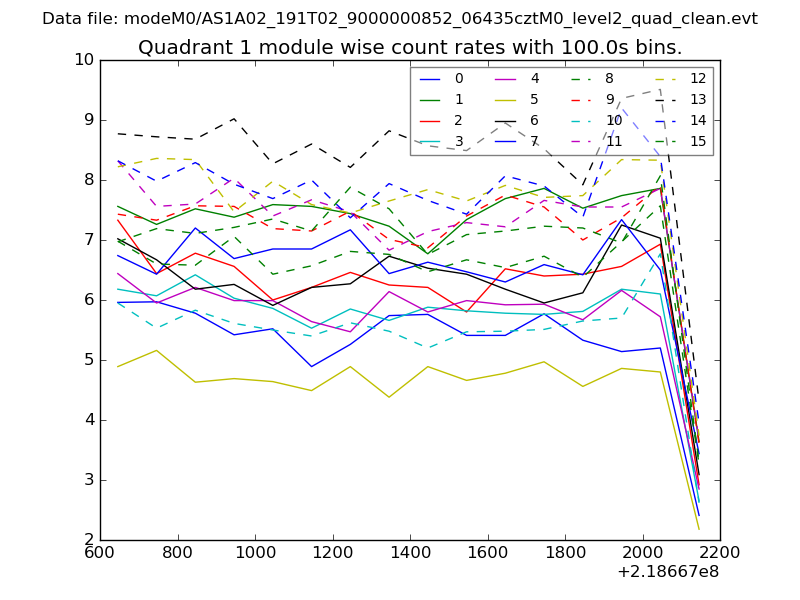
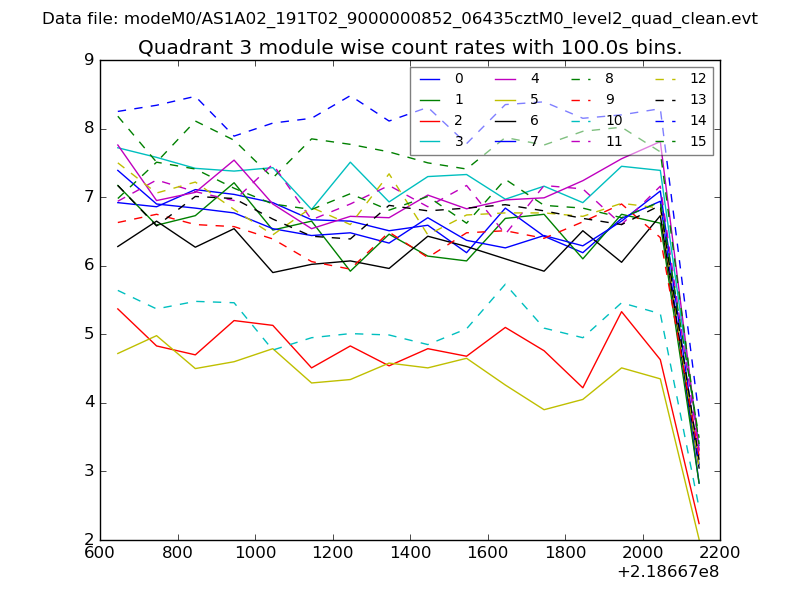
| Module-wise count rates for Quadrant A Data is divided into 100 sec bins |
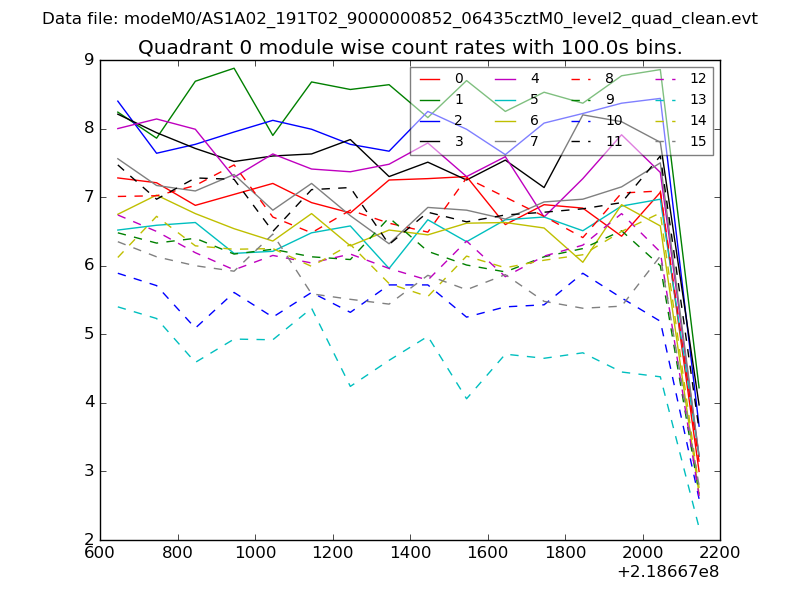 |
 |
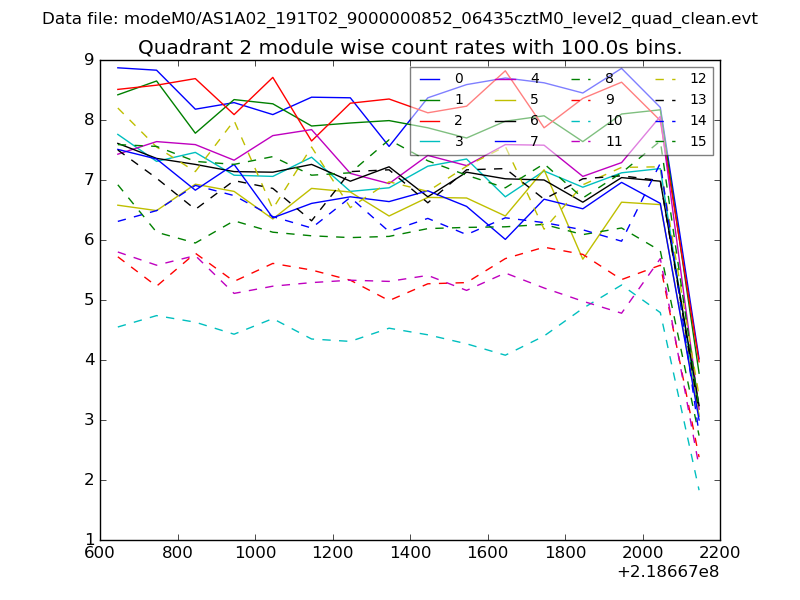
| Module-wise count rates for Quadrant B Data is divided into 100 sec bins |
 |
 |
| Module-wise count rates for Quadrant C Data is divided into 100 sec bins |
 |
 |
| Module-wise count rates for Quadrant D Data is divided into 100 sec bins |
 |
 |
| Parameter | Plot |
|---|---|
| CZT HV Monitor | 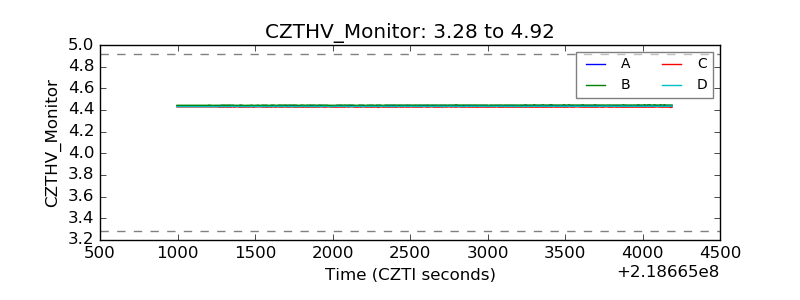 |
| D_VDD | 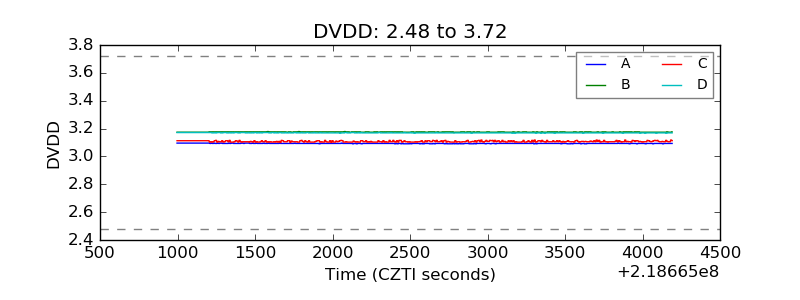 |
| Temperature 1 | 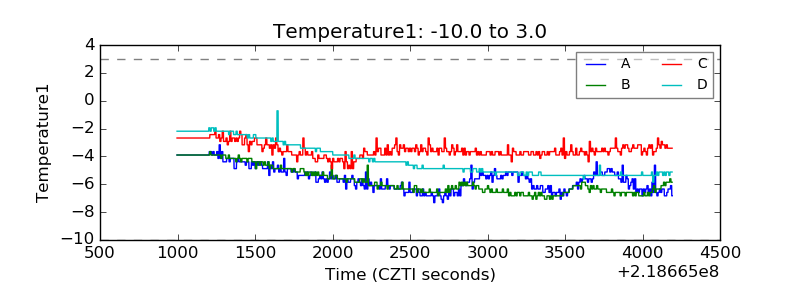 |
| Veto HV Monitor | 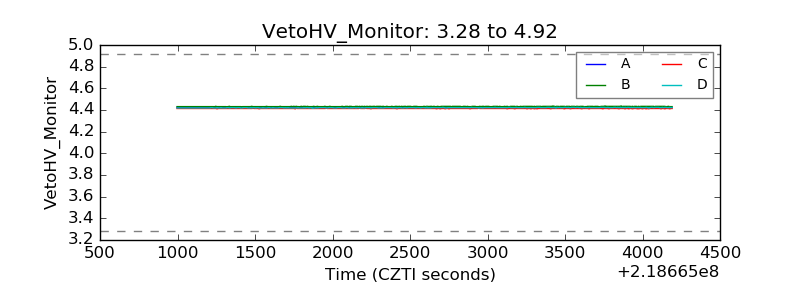 |
| Veto LLD | 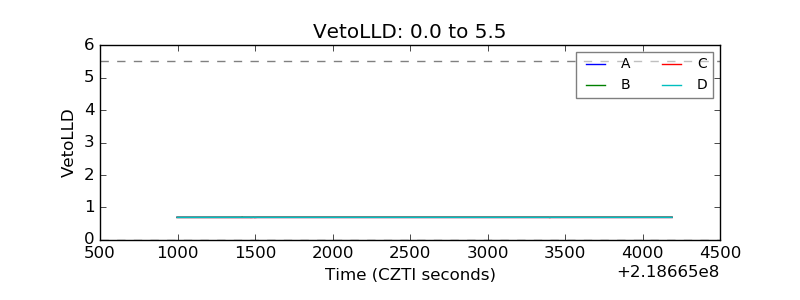 |
| Alpha Counter | 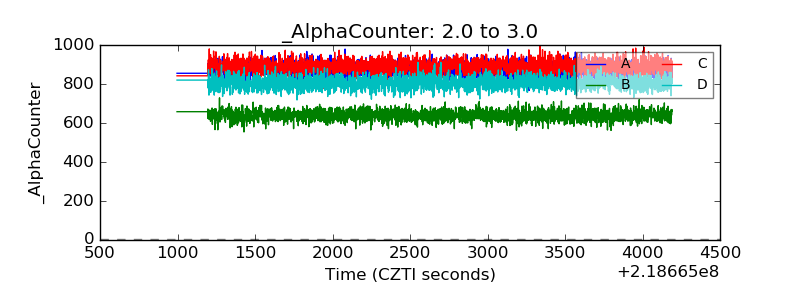 |
| _CPM_Rate | 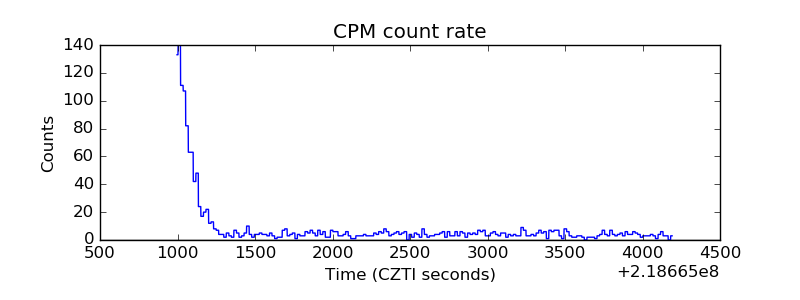 |
| CZT Counter | 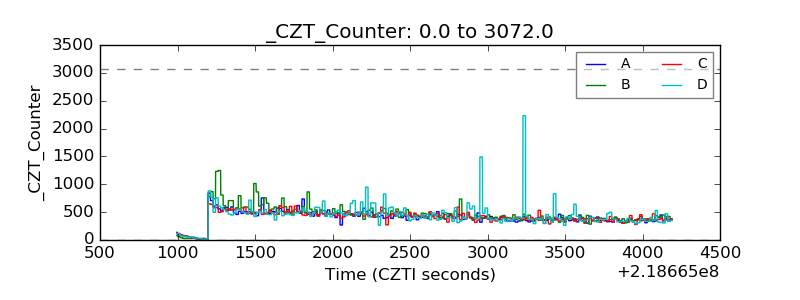 |
| +2.5 Volts monitor |  |
| +5 Volts monitor |  |
| _ROLL_ROT | 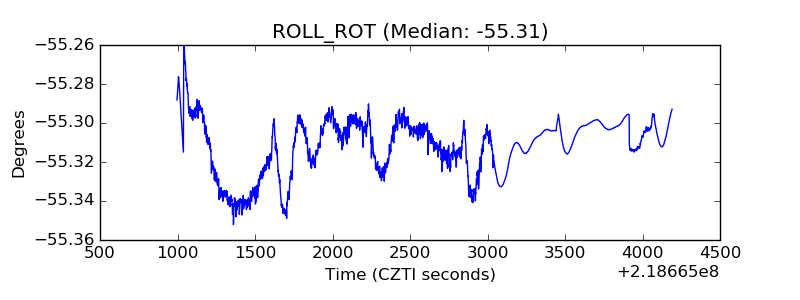 |
| _Roll_DEC | 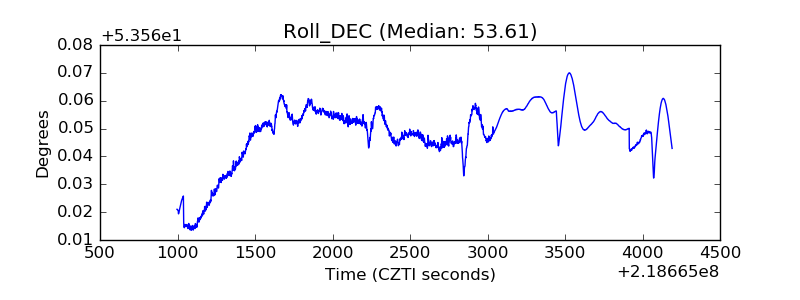 |
| _Roll_RA | 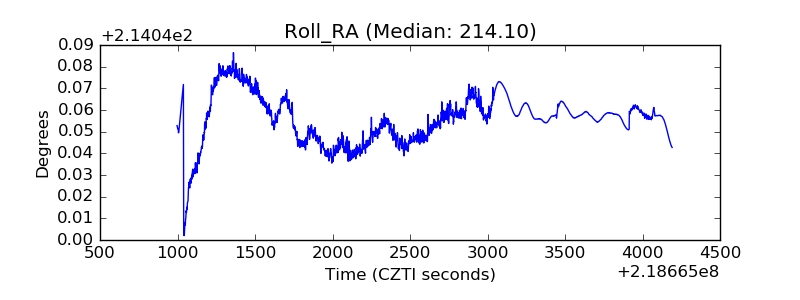 |
| Veto Counter | 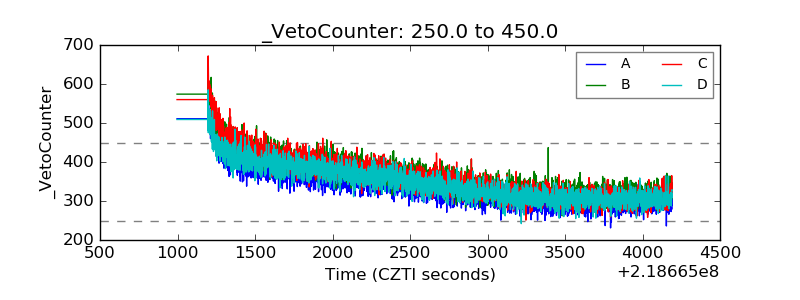 |