| Param | Original file | Final file |
|---|---|---|
| Filename | modeM0/AS1A02_191T01_9000000854_06435cztM0_level2.evt | modeM0/AS1A02_191T01_9000000854_06435cztM0_level2_quad_clean.evt |
| Size (bytes) | 234,524,160 | 46,713,600 |
| Size | 223.7 MB | 44.5 MB |
| Events in quadrant A | 1,629,796 | 294,933 |
| Events in quadrant B | 1,784,115 | 302,626 |
| Events in quadrant C | 1,604,108 | 292,474 |
| Events in quadrant D | 1,847,876 | 279,171 |
| Mode SS | |||
|---|---|---|---|
| Quadrant | BADHDUFLAG | Total packets | Discarded packets |
| A | 0 | 70 | 0 |
| B | 0 | 70 | 0 |
| C | 0 | 70 | 0 |
| D | 0 | 70 | 0 |
| Mode M0 | |||
|---|---|---|---|
| Quadrant | BADHDUFLAG | Total packets | Discarded packets |
| A | 0 | 7081 | 2 |
| B | 0 | 7565 | 1 |
| C | 0 | 7063 | 1 |
| D | 0 | 7758 | 1 |
| Mode M9 | |||
|---|---|---|---|
| Quadrant | BADHDUFLAG | Total packets | Discarded packets |
| A | 0 | 9 | 0 |
| B | 0 | 9 | 0 |
| C | 0 | 9 | 0 |
| D | 0 | 9 | 0 |
| Quadrant | Total seconds | Saturated seconds | Saturation percentage |
|---|---|---|---|
| A | 3460 | 27 | 0.780347% |
| B | 3460 | 63 | 1.820809% |
| C | 3460 | 22 | 0.635838% |
| D | 3460 | 48 | 1.387283% |
Noise dominated data is calculated using 1-second bins in cleaned event files. If a bin has >2000 counts, and if more than 50% of those come from <1% of pixels, then it is considered to be noise-dominated and hence unusable.
| Quadrant | # 1 sec bins | Bins with >0 counts | Bins with >2000 counts | High rate bins dominated by noise | Noise dominated (total time) | Noise dominated (detector-on time) | Marked lightcurve |
|---|---|---|---|---|---|---|---|
| A | 4360 | 3460 | 0 | 0 | 0.00% | 0.00% | 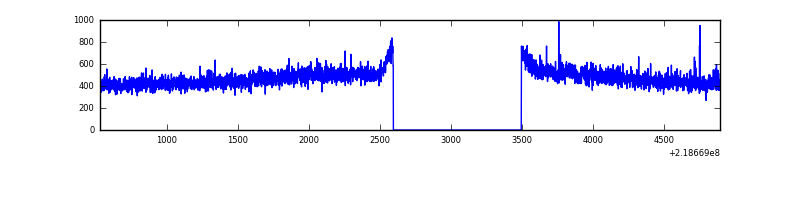 |
| B | 4360 | 3460 | 11 | 11 | 0.25% | 0.32% | 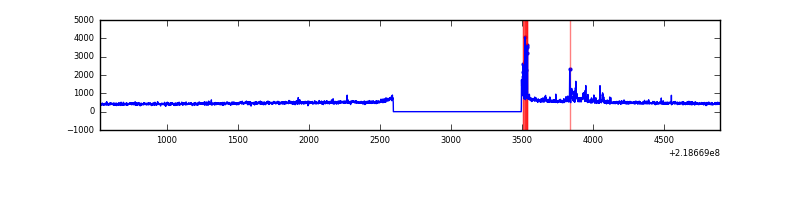 |
| C | 4360 | 3460 | 0 | 0 | 0.00% | 0.00% | 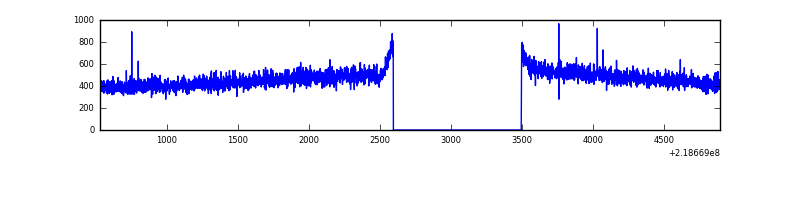 |
| D | 4360 | 3460 | 15 | 15 | 0.34% | 0.43% | 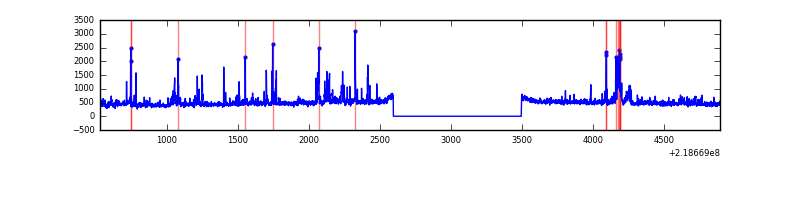 |
Top three noisy pixels from each quadrant. If the there are fewer than three noisy pixels in the level2.evt file, extra rows are filled as -1
| Pixel properties | Quadrant properties | ||||||
|---|---|---|---|---|---|---|---|
| Quadrant | DetID | PixID | Counts | Sigma | Mean | Median | Sigma |
| A | 0 | 226 | 4015 | 41.05 | 422 | 413 | 87.8 |
| A | 12 | 194 | 3944 | 40.24 | 422 | 413 | 87.8 |
| A | 8 | 15 | 2960 | 29.02 | 422 | 413 | 87.8 |
| B | 0 | 228 | 127293 | 1532.74 | 420 | 409 | 82.8 |
| B | 15 | 204 | 18159 | 214.42 | 420 | 409 | 82.8 |
| B | 12 | 111 | 8183 | 93.91 | 420 | 409 | 82.8 |
| C | 8 | 128 | 5454 | 52.63 | 407 | 408 | 95.9 |
| C | 1 | 16 | 3719 | 34.53 | 407 | 408 | 95.9 |
| C | 13 | 61 | 3220 | 29.33 | 407 | 408 | 95.9 |
| D | 2 | 152 | 207977 | 2033.05 | 408 | 395 | 102.1 |
| D | 2 | 136 | 24135 | 232.51 | 408 | 395 | 102.1 |
| D | 2 | 206 | 18824 | 180.49 | 408 | 395 | 102.1 |
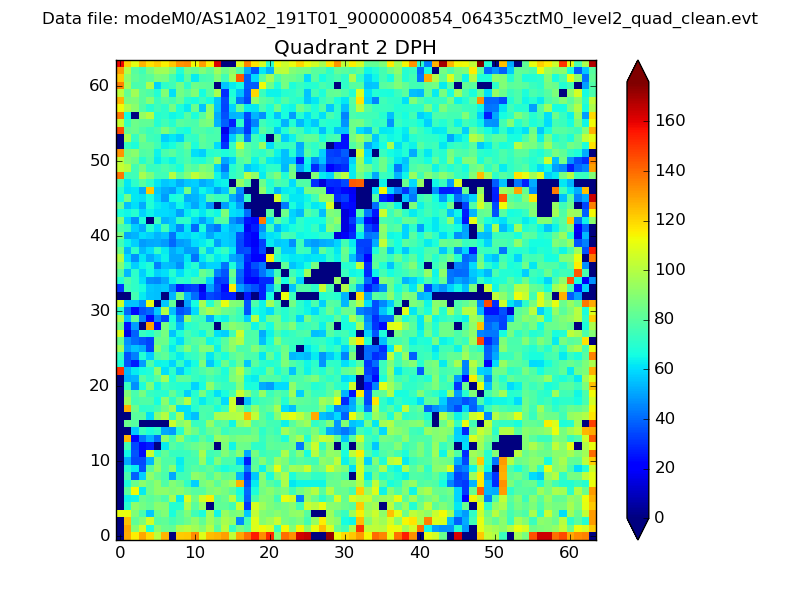
Histogram calculated using DETX and DETY for each event in the final _common_clean file
| Quadrant A | 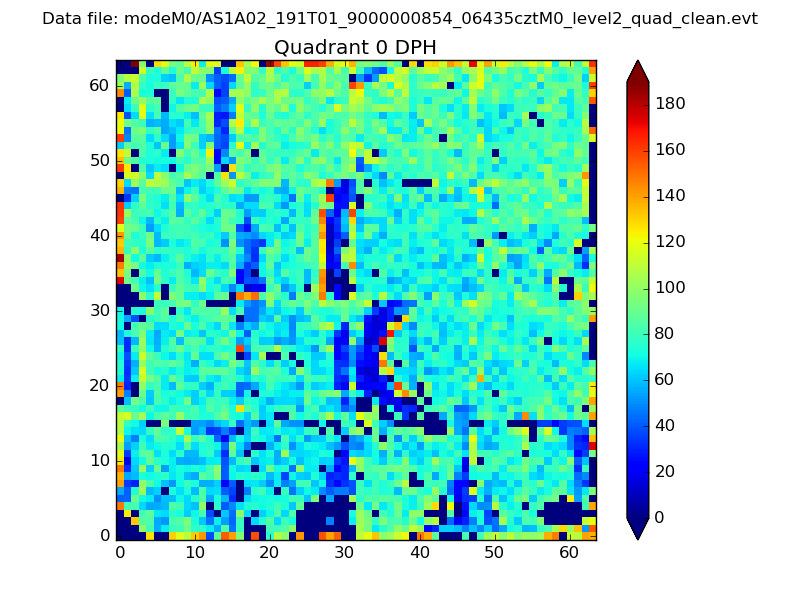 |
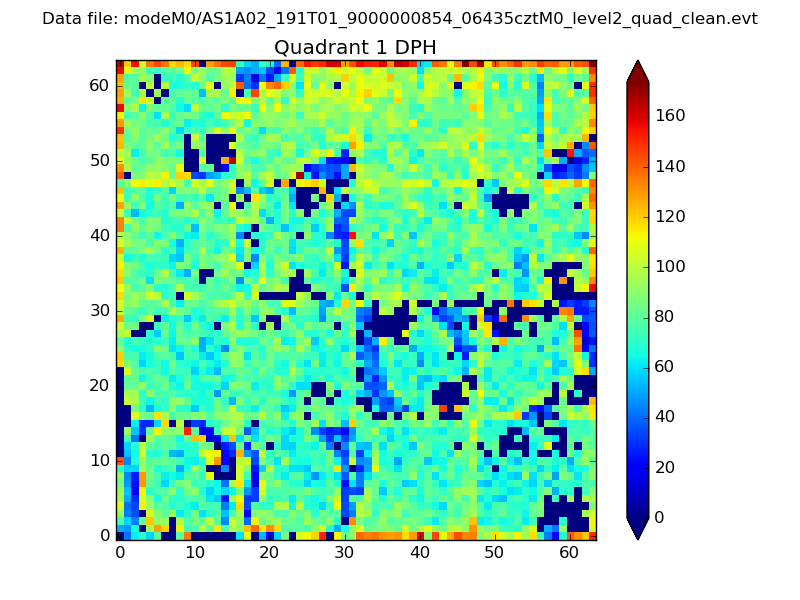 |
Quadrant B |
|---|---|---|---|
| Quadrant D | 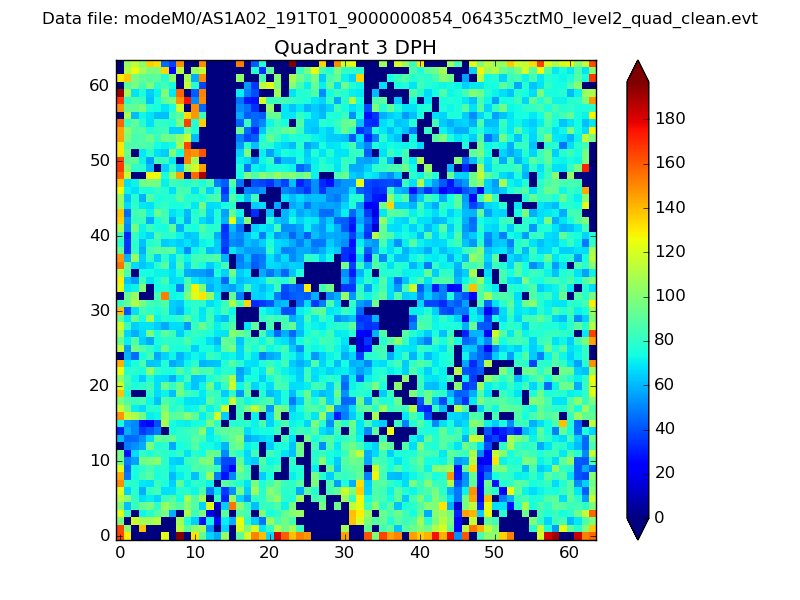 |
 |
Quadrant C |
| Plot type | Count rate plots | Images |
|---|---|---|
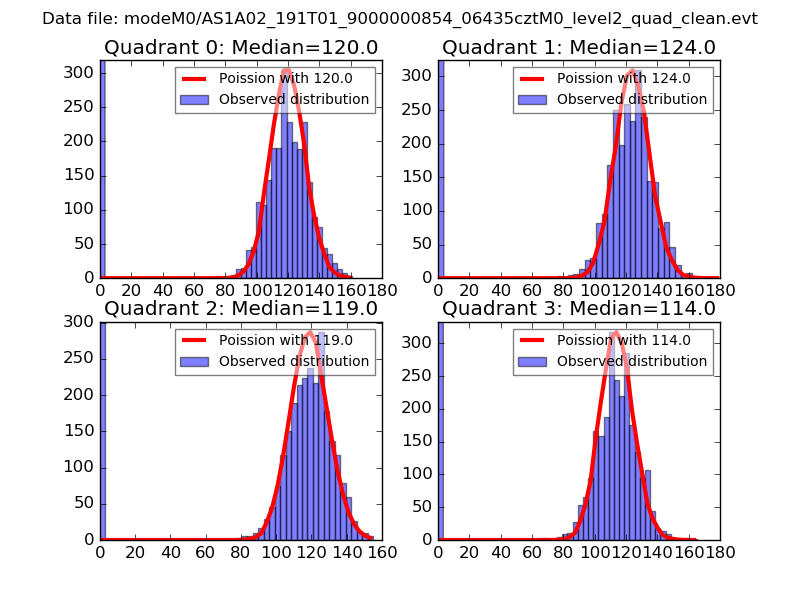
| Comparison with Poisson distribution Blue bars denote a histogram of data divided into 1 sec bins. Red curve is a Poisson curve with rate = median count rate of data. |
 |
 |
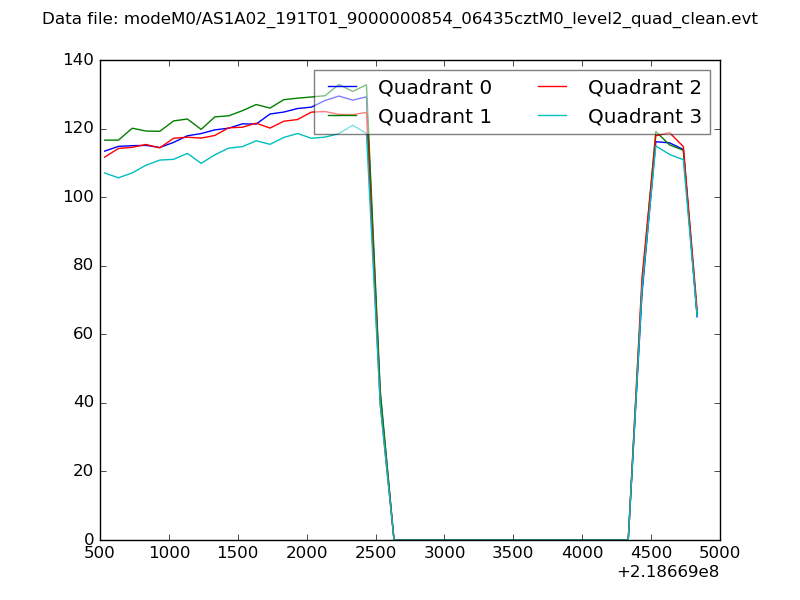
| Quadrant-wise count rates Data is divided into 100 sec bins |
 |
|
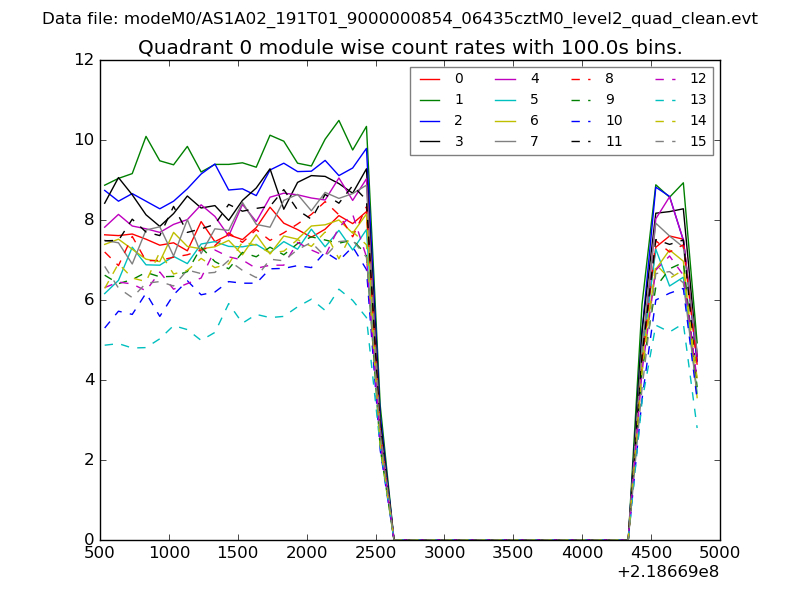
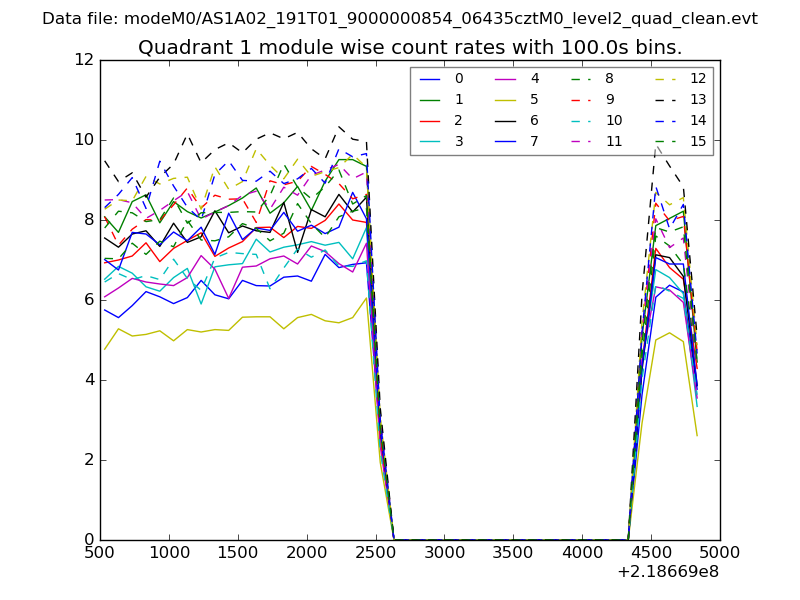
| Module-wise count rates for Quadrant A Data is divided into 100 sec bins |
 |
 |
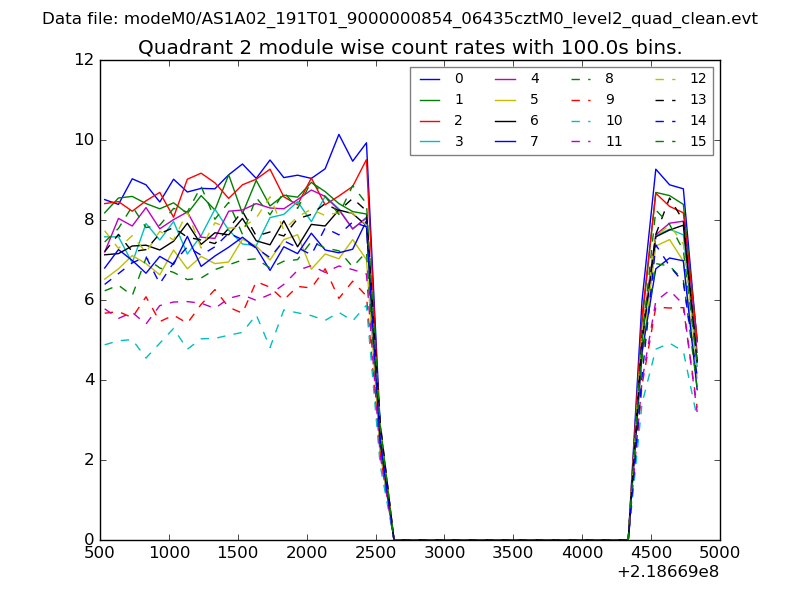
| Module-wise count rates for Quadrant B Data is divided into 100 sec bins |
 |
 |
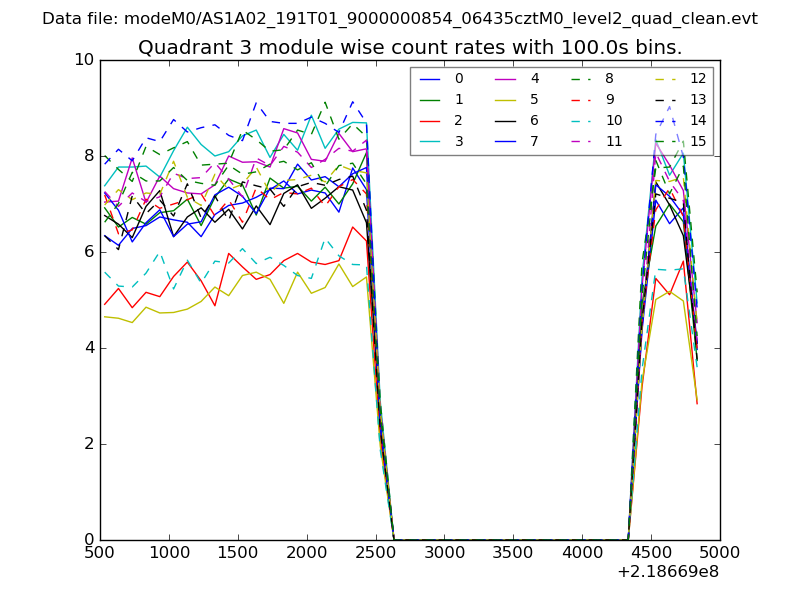
| Module-wise count rates for Quadrant C Data is divided into 100 sec bins |
 |
 |
| Module-wise count rates for Quadrant D Data is divided into 100 sec bins |
 |
 |
| Parameter | Plot |
|---|---|
| CZT HV Monitor | 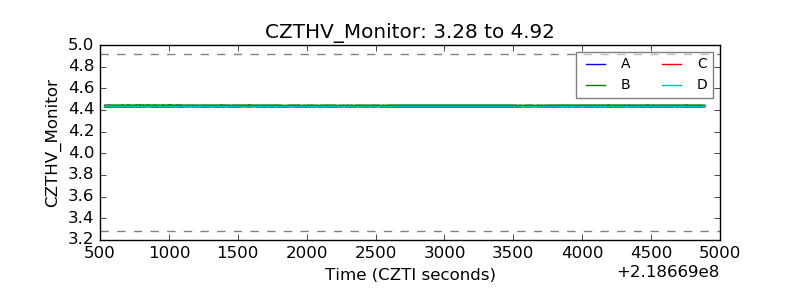 |
| D_VDD | 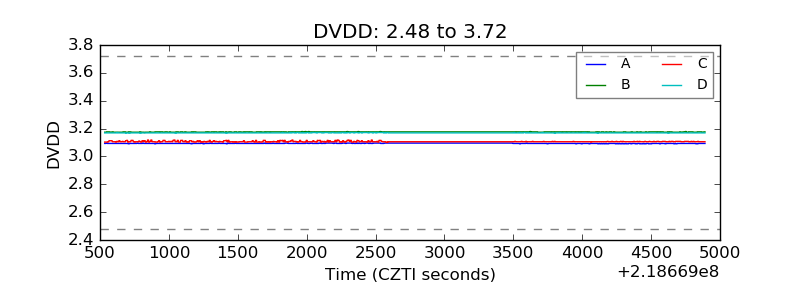 |
| Temperature 1 | 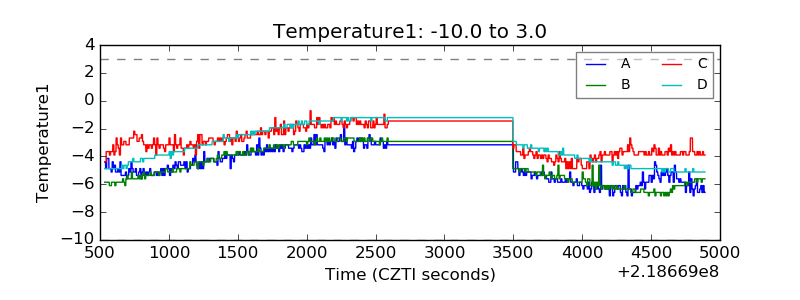 |
| Veto HV Monitor | 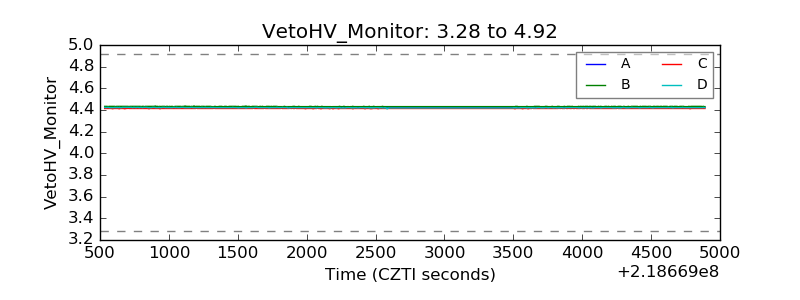 |
| Veto LLD | 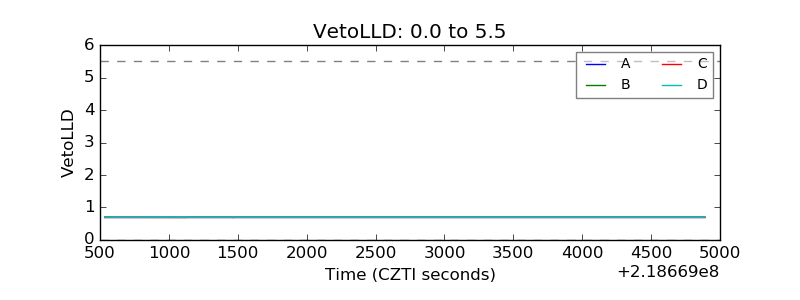 |
| Alpha Counter | 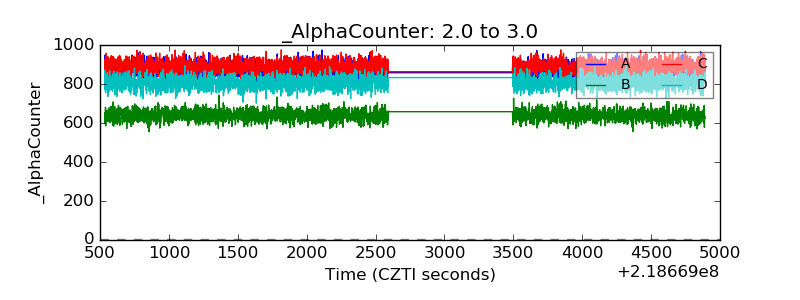 |
| _CPM_Rate | 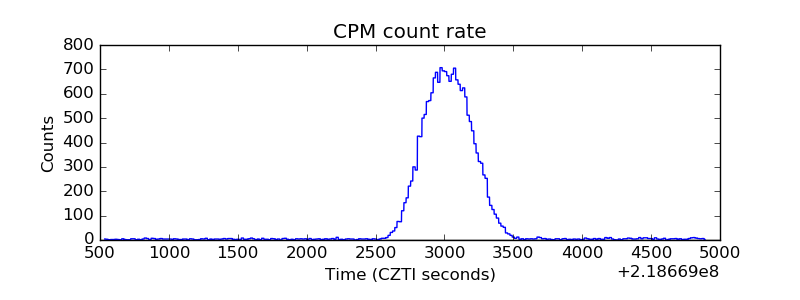 |
| CZT Counter | 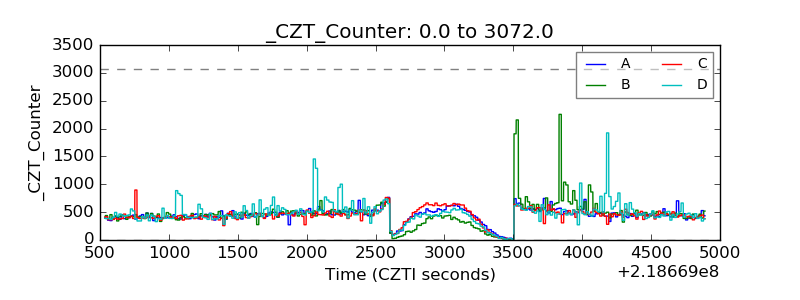 |
| +2.5 Volts monitor |  |
| +5 Volts monitor | 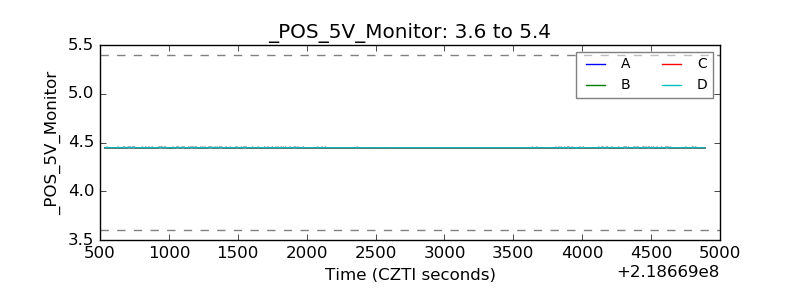 |
| _ROLL_ROT | 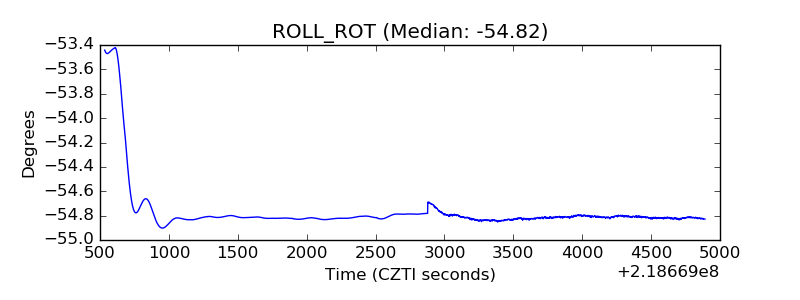 |
| _Roll_DEC | 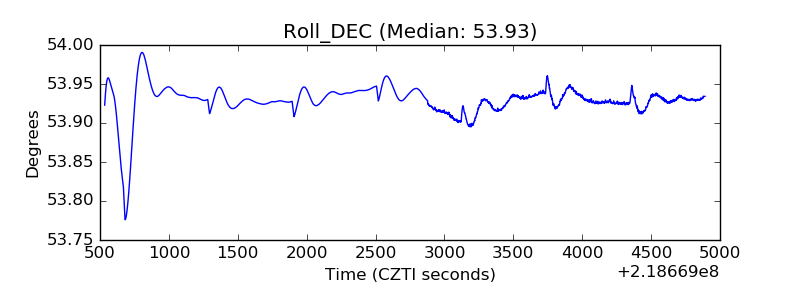 |
| _Roll_RA |  |
| Veto Counter | 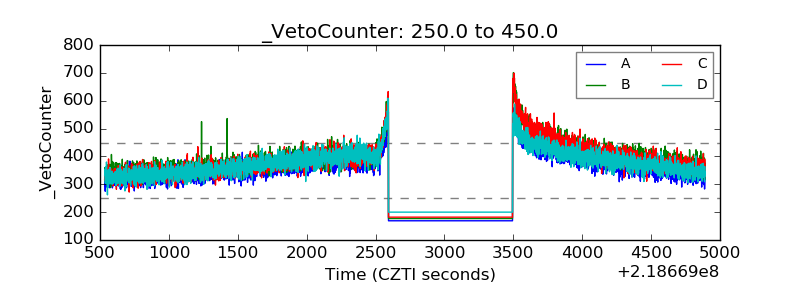 |