| Param | Original file | Final file |
|---|---|---|
| Filename | modeM0/AS1A02_191T01_9000000854_06438cztM0_level2.evt | modeM0/AS1A02_191T01_9000000854_06438cztM0_level2_quad_clean.evt |
| Size (bytes) | 413,481,600 | 99,472,320 |
| Size | 394.3 MB | 94.9 MB |
| Events in quadrant A | 2,934,193 | 641,497 |
| Events in quadrant B | 3,124,626 | 666,010 |
| Events in quadrant C | 2,873,949 | 641,487 |
| Events in quadrant D | 3,146,392 | 609,273 |
| Mode SS | |||
|---|---|---|---|
| Quadrant | BADHDUFLAG | Total packets | Discarded packets |
| A | 0 | 130 | 0 |
| B | 0 | 130 | 0 |
| C | 0 | 130 | 0 |
| D | 0 | 130 | 0 |
| Mode M0 | |||
|---|---|---|---|
| Quadrant | BADHDUFLAG | Total packets | Discarded packets |
| A | 0 | 13297 | 3 |
| B | 0 | 13644 | 2 |
| C | 0 | 13286 | 2 |
| D | 0 | 14098 | 2 |
| Mode M9 | |||
|---|---|---|---|
| Quadrant | BADHDUFLAG | Total packets | Discarded packets |
| A | 0 | 20 | 0 |
| B | 0 | 20 | 0 |
| C | 0 | 20 | 0 |
| D | 0 | 21 | 0 |
| Quadrant | Total seconds | Saturated seconds | Saturation percentage |
|---|---|---|---|
| A | 6520 | 19 | 0.291411% |
| B | 6520 | 38 | 0.582822% |
| C | 6520 | 12 | 0.184049% |
| D | 6520 | 22 | 0.337423% |
Noise dominated data is calculated using 1-second bins in cleaned event files. If a bin has >2000 counts, and if more than 50% of those come from <1% of pixels, then it is considered to be noise-dominated and hence unusable.
| Quadrant | # 1 sec bins | Bins with >0 counts | Bins with >2000 counts | High rate bins dominated by noise | Noise dominated (total time) | Noise dominated (detector-on time) | Marked lightcurve |
|---|---|---|---|---|---|---|---|
| A | 7695 | 6521 | 0 | 0 | 0.00% | 0.00% | 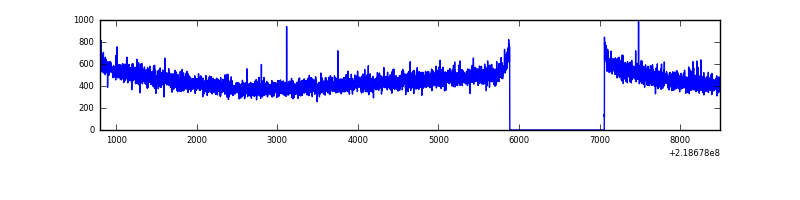 |
| B | 7695 | 6521 | 1 | 1 | 0.01% | 0.02% | 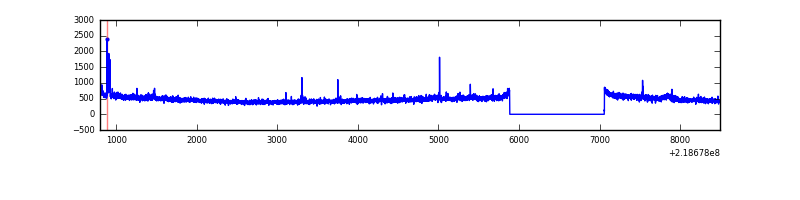 |
| C | 7695 | 6521 | 0 | 0 | 0.00% | 0.00% | 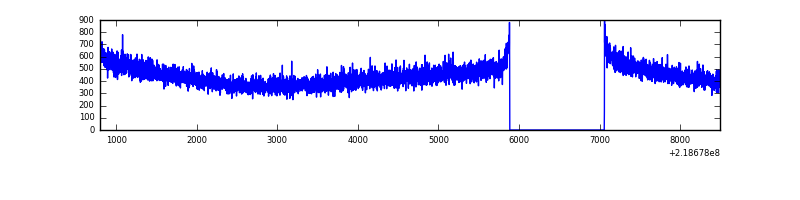 |
| D | 7695 | 6521 | 9 | 9 | 0.12% | 0.14% | 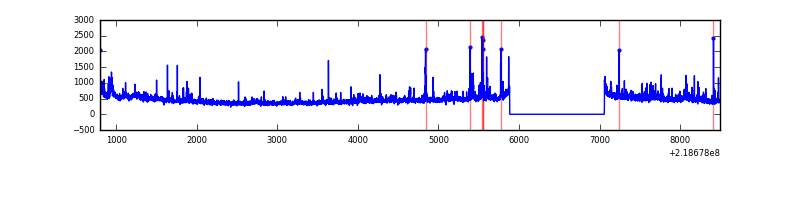 |
Top three noisy pixels from each quadrant. If the there are fewer than three noisy pixels in the level2.evt file, extra rows are filled as -1
| Pixel properties | Quadrant properties | ||||||
|---|---|---|---|---|---|---|---|
| Quadrant | DetID | PixID | Counts | Sigma | Mean | Median | Sigma |
| A | 0 | 226 | 7275 | 41.78 | 760 | 745 | 156.3 |
| A | 12 | 194 | 6908 | 39.43 | 760 | 745 | 156.3 |
| A | 10 | 133 | 5347 | 29.44 | 760 | 745 | 156.3 |
| B | 0 | 228 | 50226 | 337.66 | 771 | 753 | 146.5 |
| B | 8 | 3 | 35916 | 239.99 | 771 | 753 | 146.5 |
| B | 15 | 204 | 34488 | 230.24 | 771 | 753 | 146.5 |
| C | 13 | 61 | 5847 | 29.97 | 735 | 738 | 170.5 |
| C | 1 | 16 | 2385 | 9.66 | 735 | 738 | 170.5 |
| C | 3 | 202 | 1883 | 6.72 | 735 | 738 | 170.5 |
| D | 2 | 152 | 150234 | 833.92 | 729 | 706 | 179.3 |
| D | 2 | 216 | 81923 | 452.95 | 729 | 706 | 179.3 |
| D | 11 | 241 | 66885 | 369.08 | 729 | 706 | 179.3 |
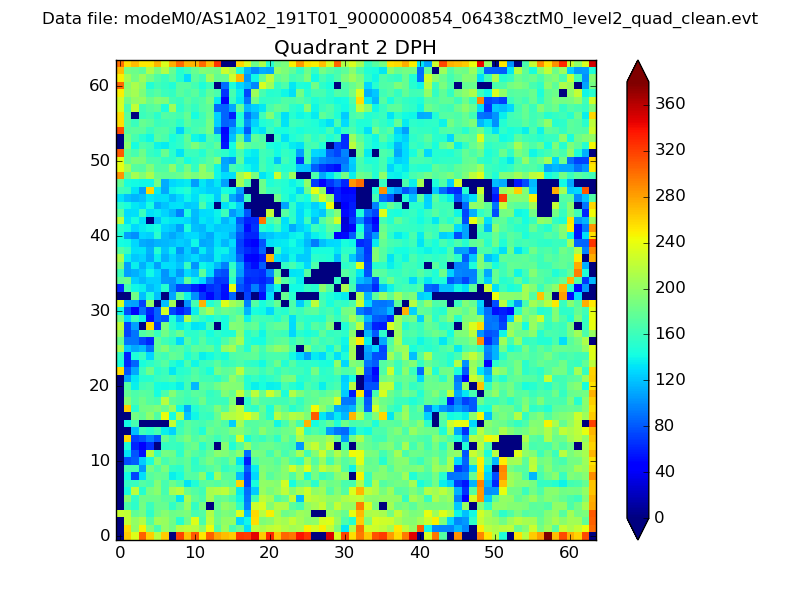
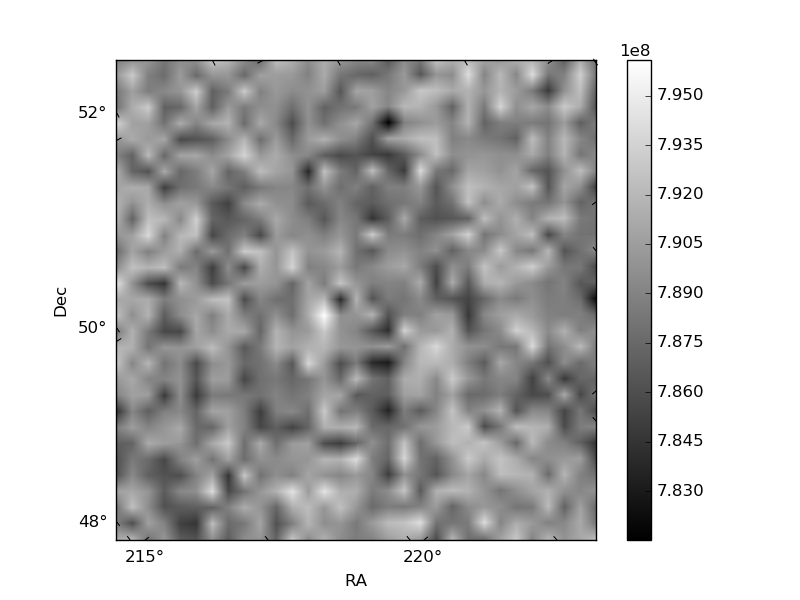
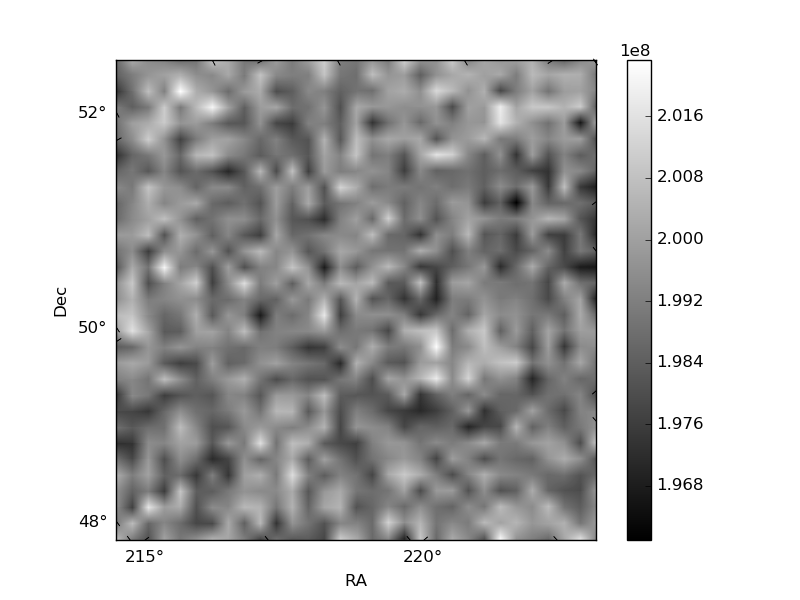
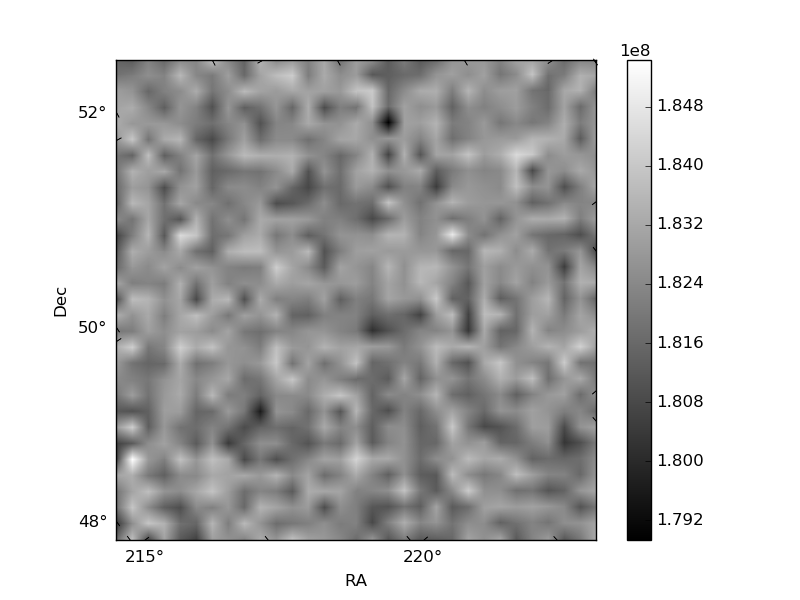
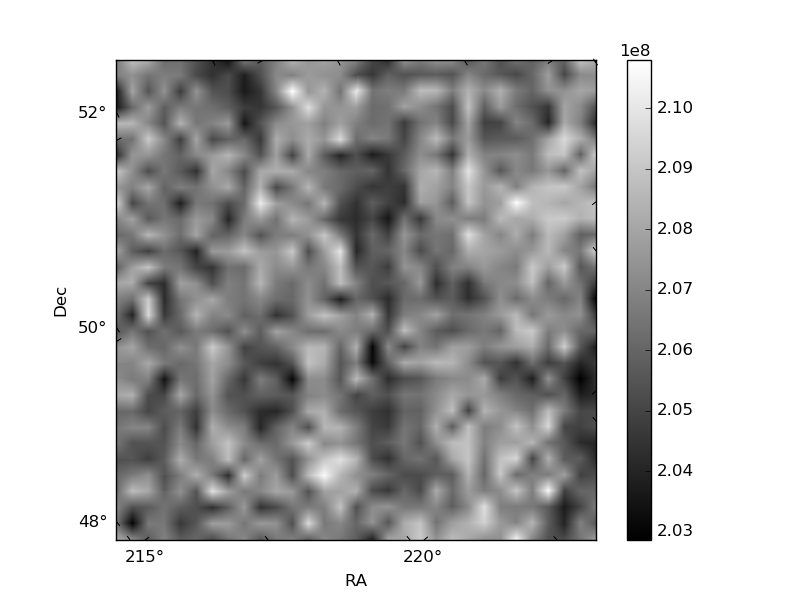
Histogram calculated using DETX and DETY for each event in the final _common_clean file
| Quadrant A | 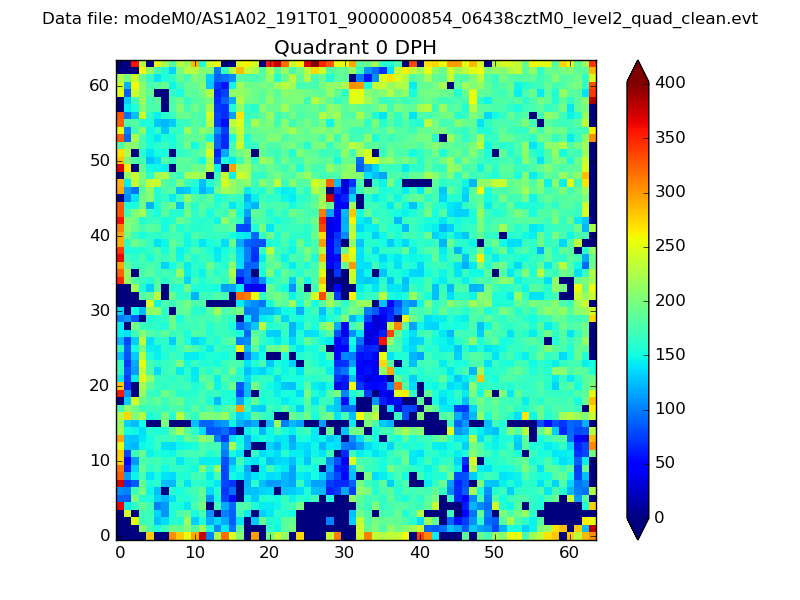 |
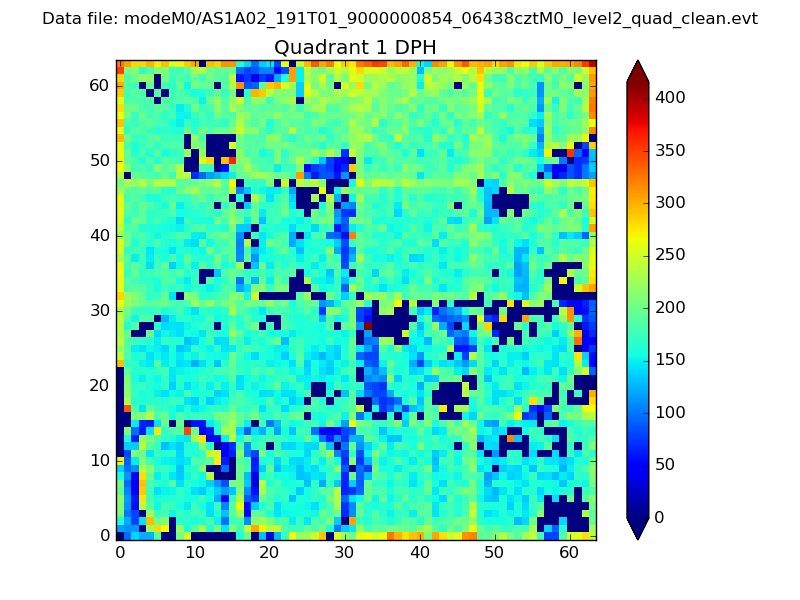 |
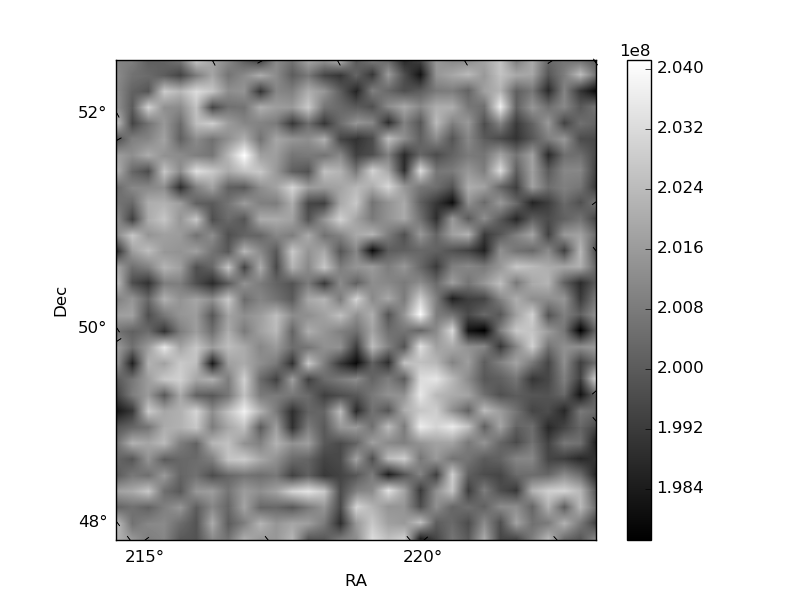
Quadrant B |
|---|---|---|---|
| Quadrant D | 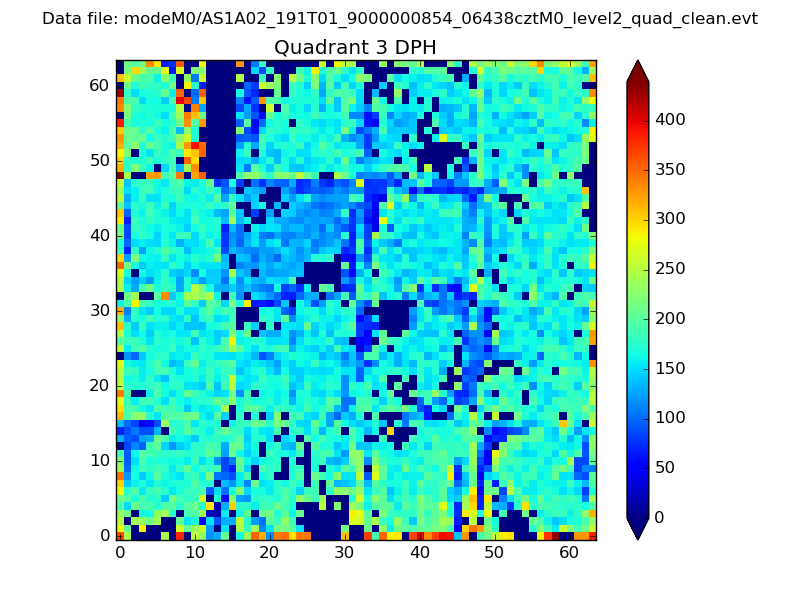 |
 |
Quadrant C |
| Plot type | Count rate plots | Images |
|---|---|---|
| Comparison with Poisson distribution Blue bars denote a histogram of data divided into 1 sec bins. Red curve is a Poisson curve with rate = median count rate of data. |
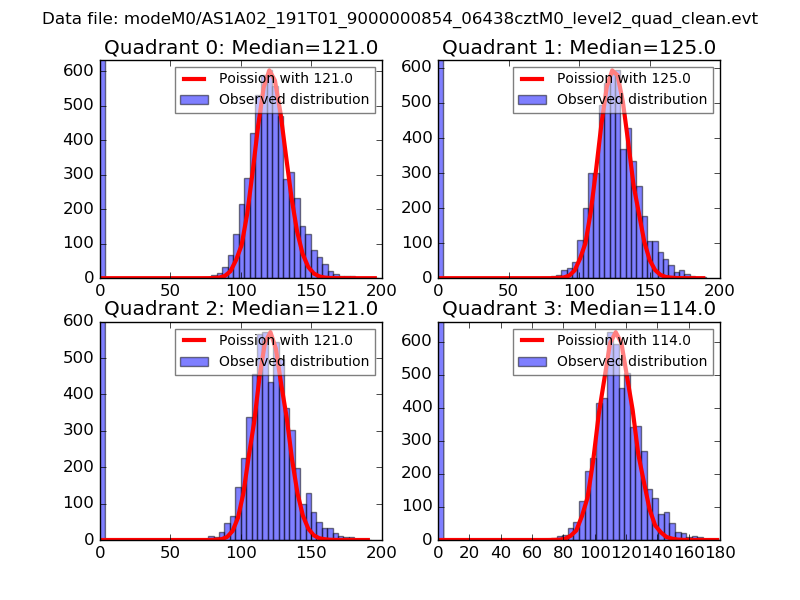 |
 |
| Quadrant-wise count rates Data is divided into 100 sec bins |
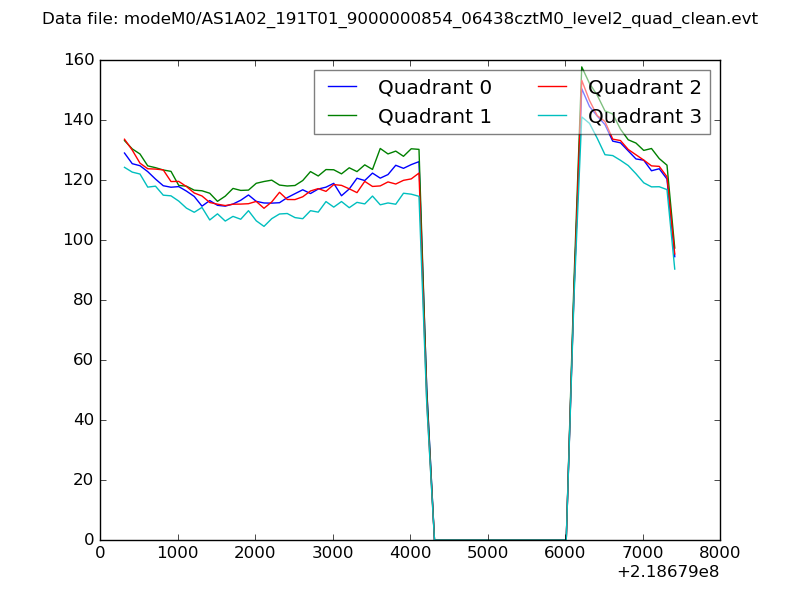 |
|
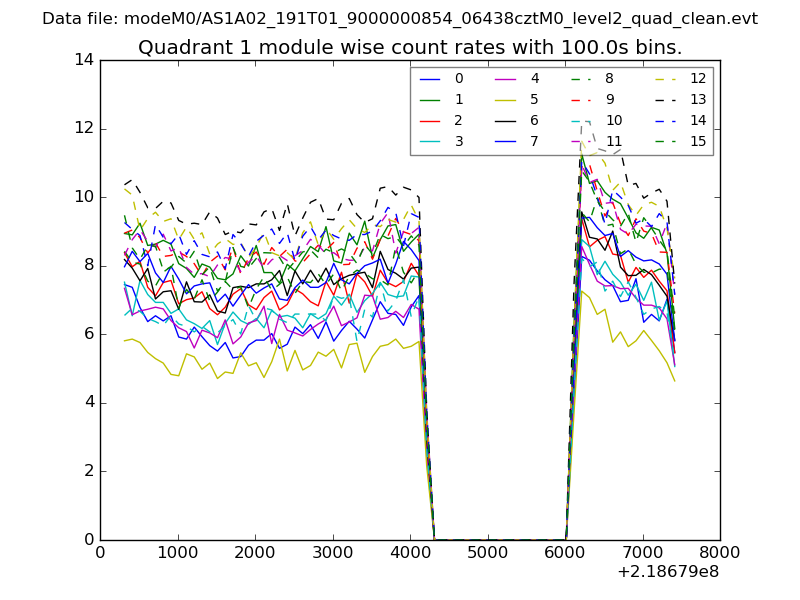
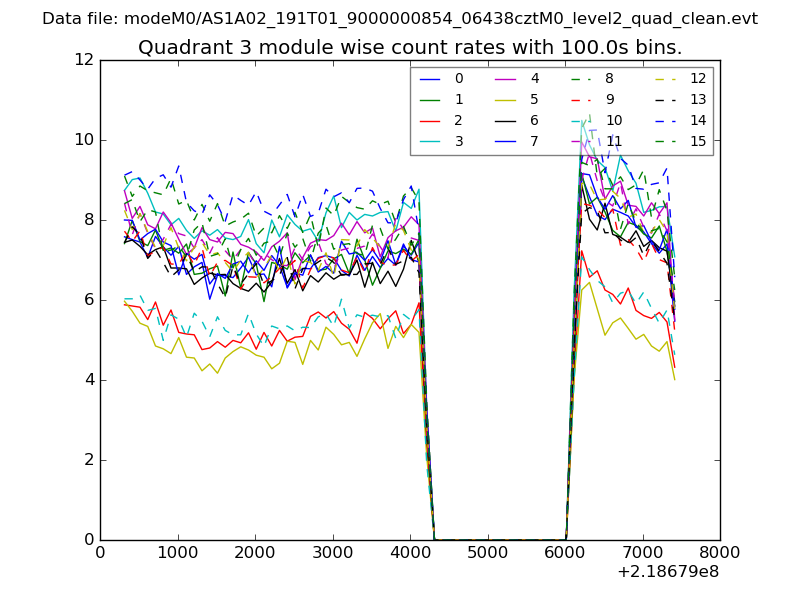
| Module-wise count rates for Quadrant A Data is divided into 100 sec bins |
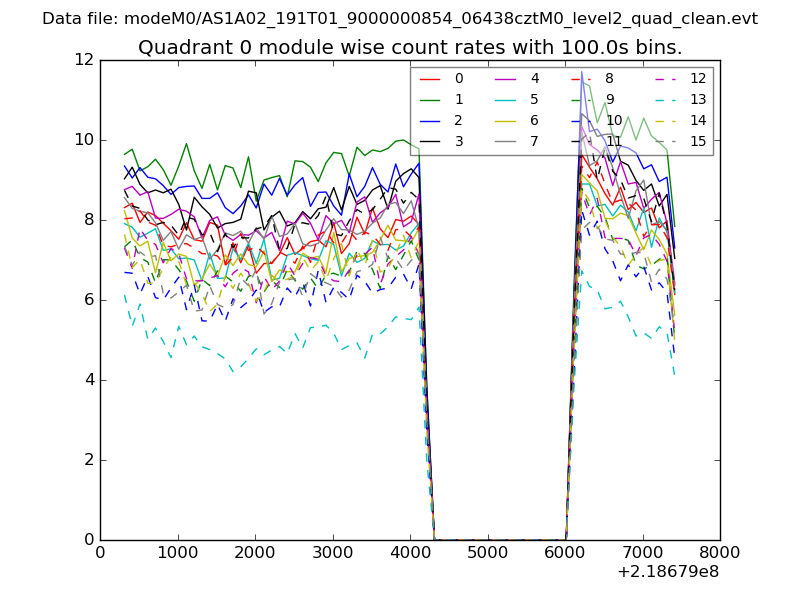 |
 |
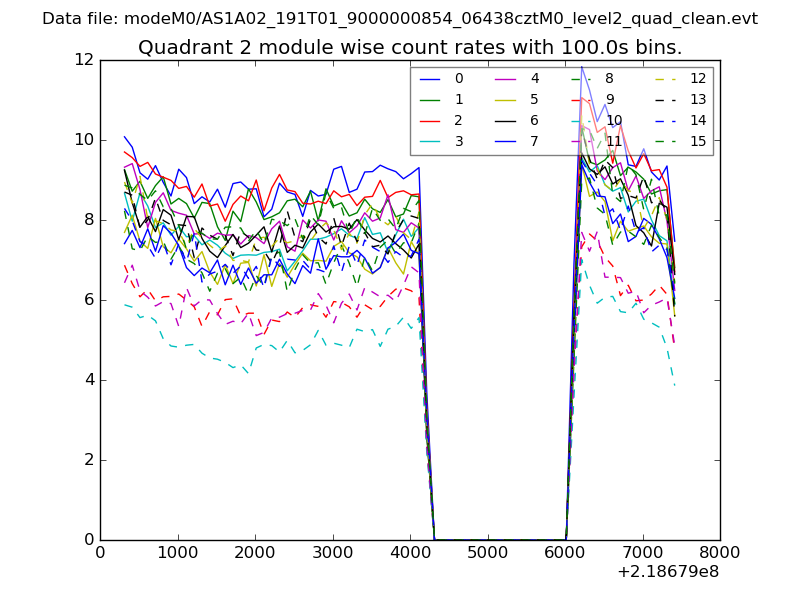
| Module-wise count rates for Quadrant B Data is divided into 100 sec bins |
 |
 |
| Module-wise count rates for Quadrant C Data is divided into 100 sec bins |
 |
 |
| Module-wise count rates for Quadrant D Data is divided into 100 sec bins |
 |
 |
| Parameter | Plot |
|---|---|
| CZT HV Monitor | 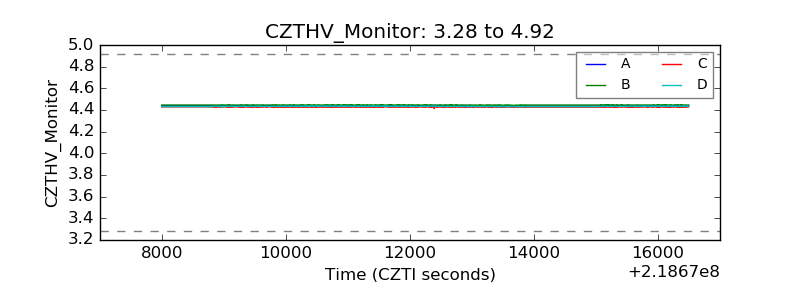 |
| D_VDD | 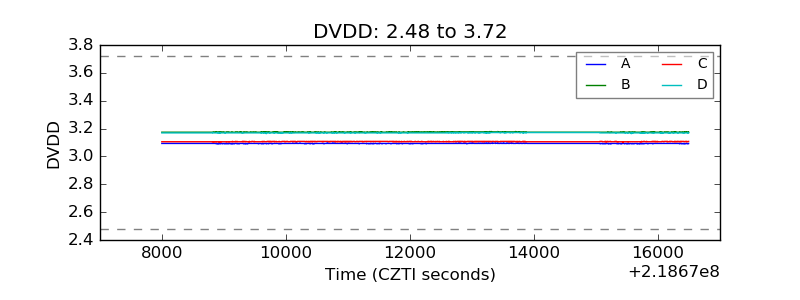 |
| Temperature 1 | 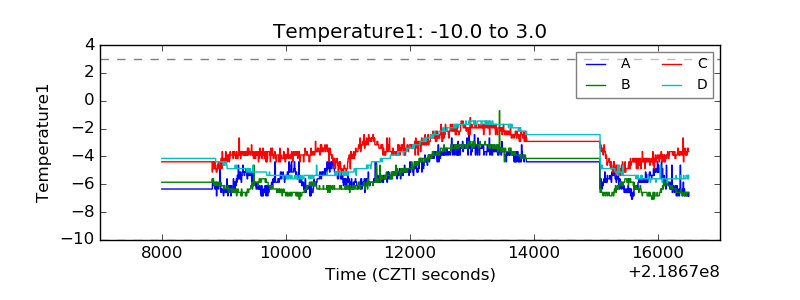 |
| Veto HV Monitor | 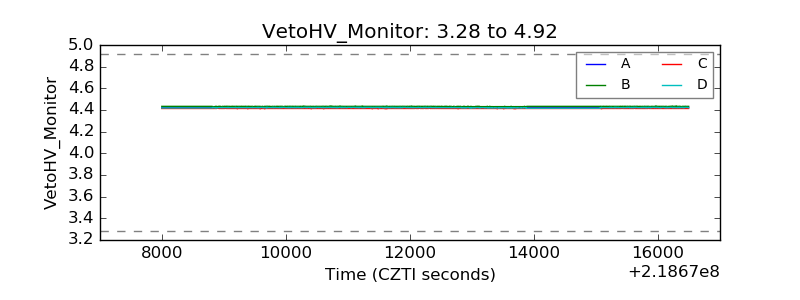 |
| Veto LLD | 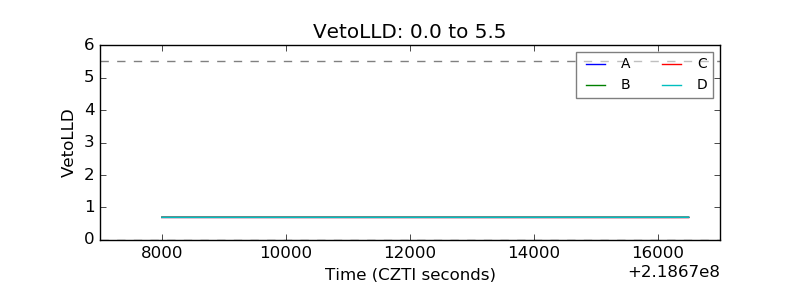 |
| Alpha Counter | 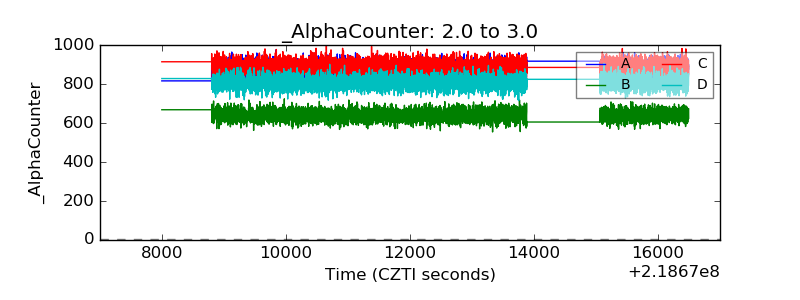 |
| _CPM_Rate | 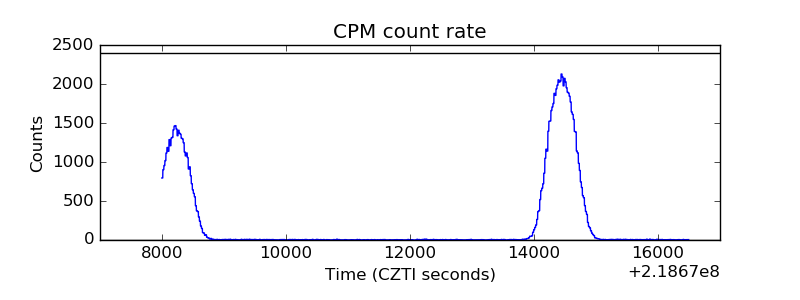 |
| CZT Counter | 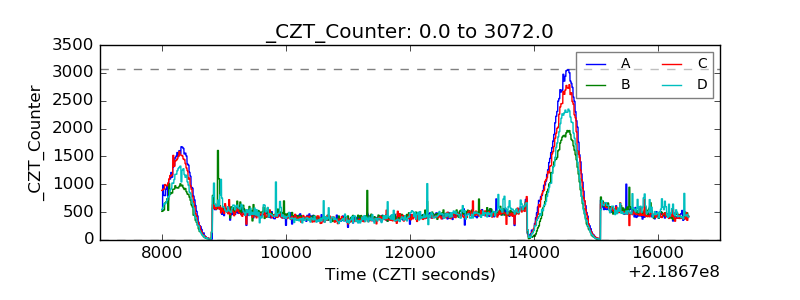 |
| +2.5 Volts monitor |  |
| +5 Volts monitor |  |
| _ROLL_ROT | 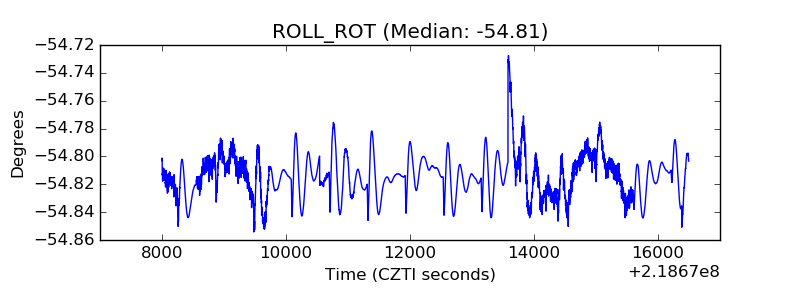 |
| _Roll_DEC | 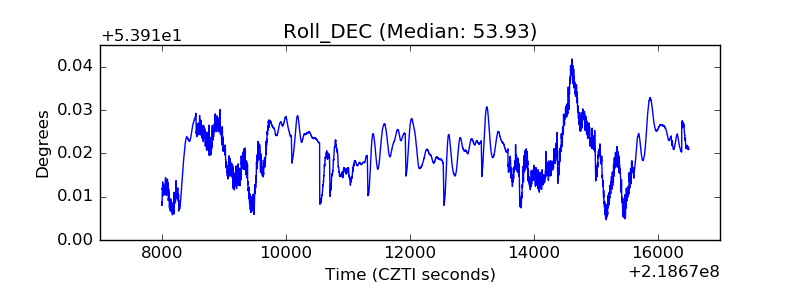 |
| _Roll_RA | 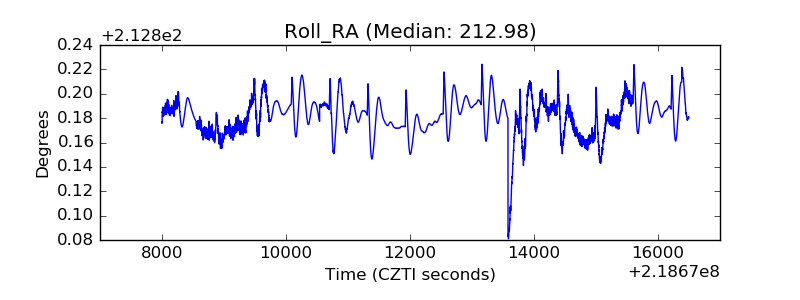 |
| Veto Counter | 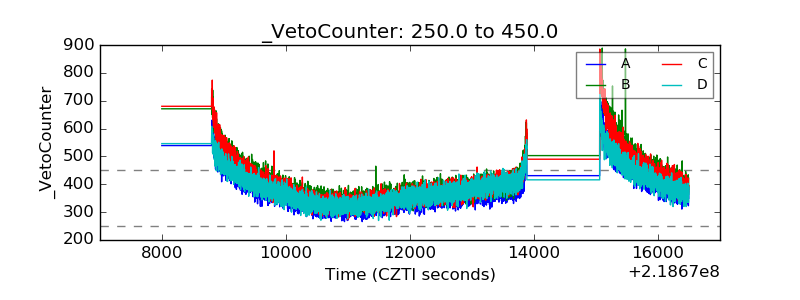 |