| Param | Original file | Final file |
|---|---|---|
| Filename | modeM0/AS1A02_191T01_9000000854_06440cztM0_level2.evt | modeM0/AS1A02_191T01_9000000854_06440cztM0_level2_quad_clean.evt |
| Size (bytes) | 659,283,840 | 157,596,480 |
| Size | 628.7 MB | 150.3 MB |
| Events in quadrant A | 4,638,207 | 1,032,710 |
| Events in quadrant B | 4,998,555 | 1,068,555 |
| Events in quadrant C | 4,452,523 | 1,013,417 |
| Events in quadrant D | 5,189,597 | 956,333 |
| Mode SS | |||
|---|---|---|---|
| Quadrant | BADHDUFLAG | Total packets | Discarded packets |
| A | 0 | 206 | 0 |
| B | 0 | 206 | 0 |
| C | 0 | 206 | 0 |
| D | 0 | 206 | 0 |
| Mode M0 | |||
|---|---|---|---|
| Quadrant | BADHDUFLAG | Total packets | Discarded packets |
| A | 0 | 20674 | 3 |
| B | 0 | 21465 | 2 |
| C | 0 | 20541 | 2 |
| D | 0 | 22463 | 2 |
| Mode M9 | |||
|---|---|---|---|
| Quadrant | BADHDUFLAG | Total packets | Discarded packets |
| A | 0 | 26 | 0 |
| B | 0 | 26 | 0 |
| C | 0 | 26 | 0 |
| D | 0 | 26 | 0 |
| Quadrant | Total seconds | Saturated seconds | Saturation percentage |
|---|---|---|---|
| A | 10141 | 12 | 0.118332% |
| B | 10141 | 42 | 0.414160% |
| C | 10141 | 7 | 0.069027% |
| D | 10141 | 48 | 0.473326% |
Noise dominated data is calculated using 1-second bins in cleaned event files. If a bin has >2000 counts, and if more than 50% of those come from <1% of pixels, then it is considered to be noise-dominated and hence unusable.
| Quadrant | # 1 sec bins | Bins with >0 counts | Bins with >2000 counts | High rate bins dominated by noise | Noise dominated (total time) | Noise dominated (detector-on time) | Marked lightcurve |
|---|---|---|---|---|---|---|---|
| A | 12766 | 10143 | 0 | 0 | 0.00% | 0.00% | 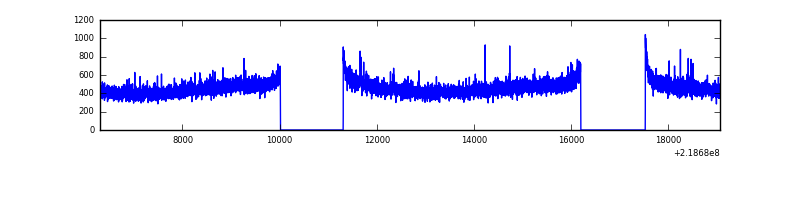 |
| B | 12766 | 10143 | 14 | 14 | 0.11% | 0.14% | 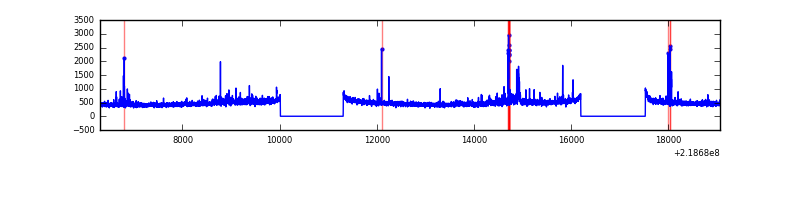 |
| C | 12766 | 10143 | 0 | 0 | 0.00% | 0.00% | 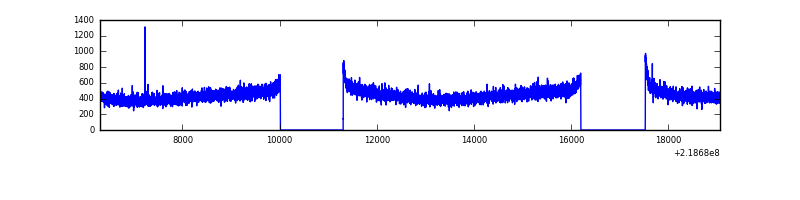 |
| D | 12766 | 10143 | 30 | 30 | 0.23% | 0.30% |  |
Top three noisy pixels from each quadrant. If the there are fewer than three noisy pixels in the level2.evt file, extra rows are filled as -1
| Pixel properties | Quadrant properties | ||||||
|---|---|---|---|---|---|---|---|
| Quadrant | DetID | PixID | Counts | Sigma | Mean | Median | Sigma |
| A | 15 | 236 | 21052 | 82.96 | 1193 | 1169 | 239.7 |
| A | 8 | 15 | 14295 | 54.76 | 1193 | 1169 | 239.7 |
| A | 0 | 226 | 11505 | 43.12 | 1193 | 1169 | 239.7 |
| B | 11 | 51 | 105424 | 461.88 | 1206 | 1180 | 225.7 |
| B | 0 | 228 | 59743 | 259.48 | 1206 | 1180 | 225.7 |
| B | 8 | 3 | 52465 | 227.23 | 1206 | 1180 | 225.7 |
| C | 13 | 61 | 8883 | 29.71 | 1139 | 1145 | 260.4 |
| C | 1 | 16 | 6525 | 20.66 | 1139 | 1145 | 260.4 |
| C | 8 | 222 | 3124 | 7.6 | 1139 | 1145 | 260.4 |
| D | 11 | 241 | 427728 | 1539.46 | 1135 | 1098 | 277.1 |
| D | 2 | 152 | 247400 | 888.76 | 1135 | 1098 | 277.1 |
| D | 2 | 14 | 55013 | 194.55 | 1135 | 1098 | 277.1 |
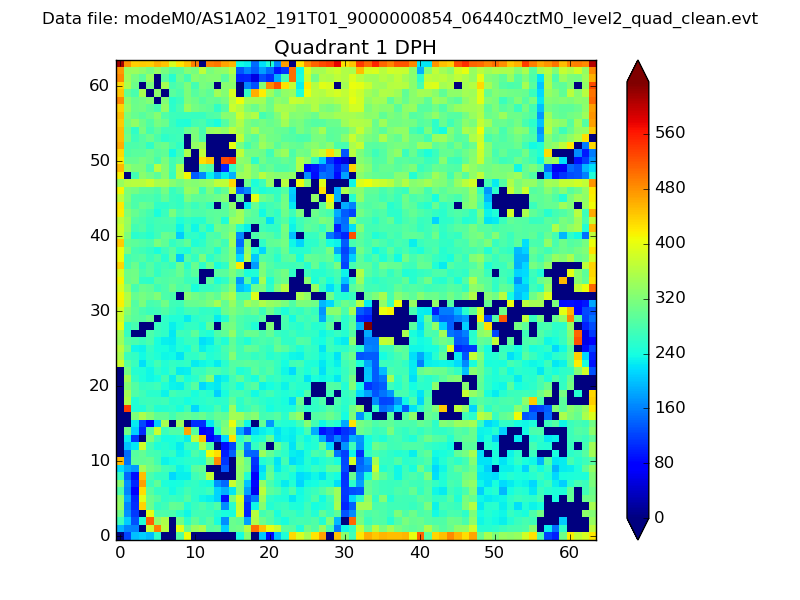
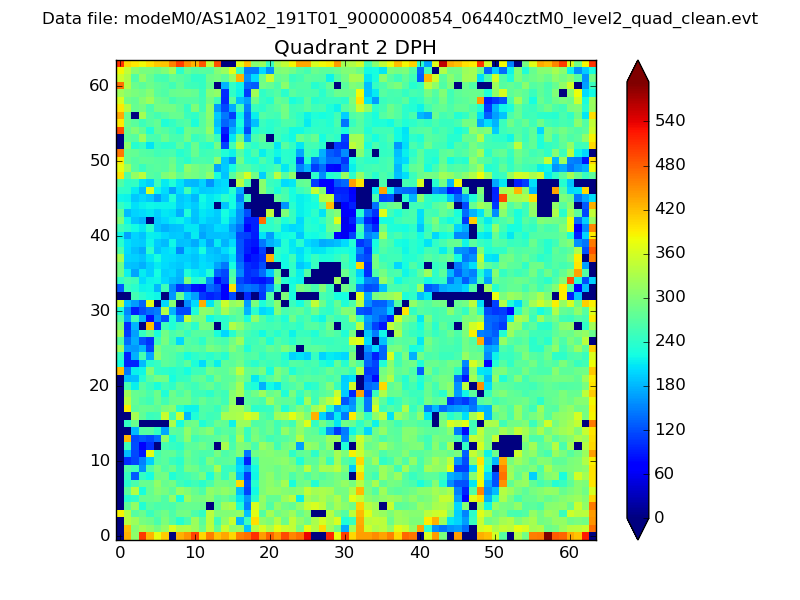
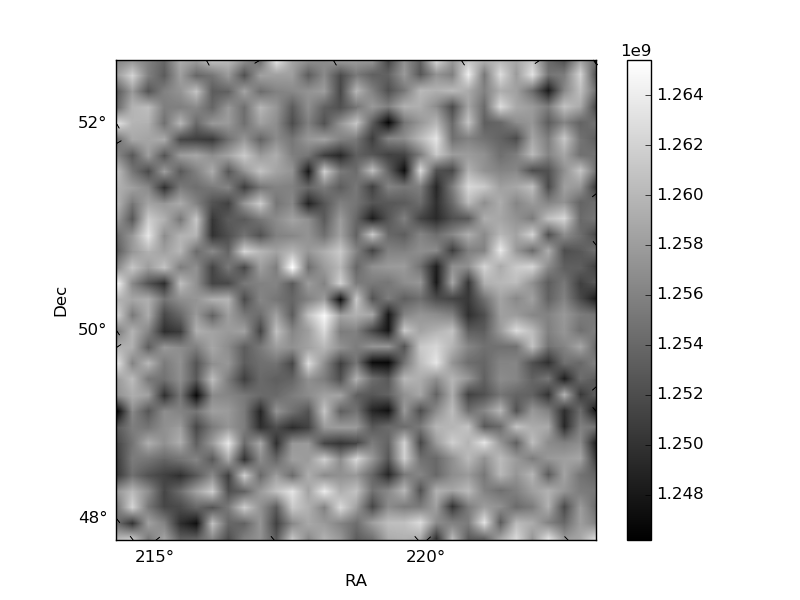
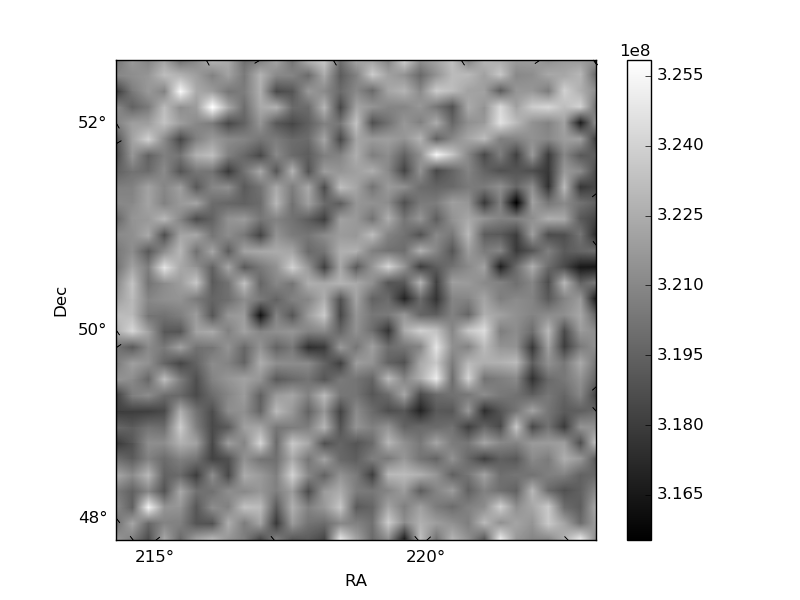
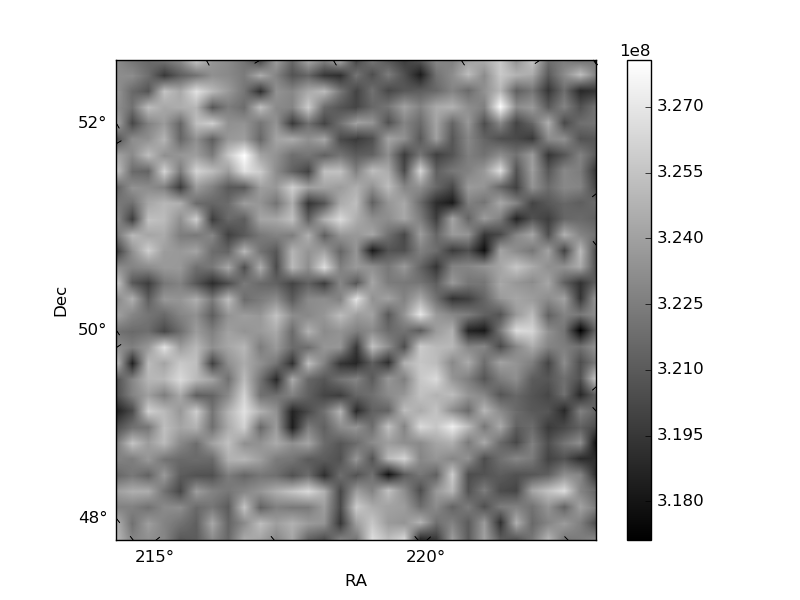
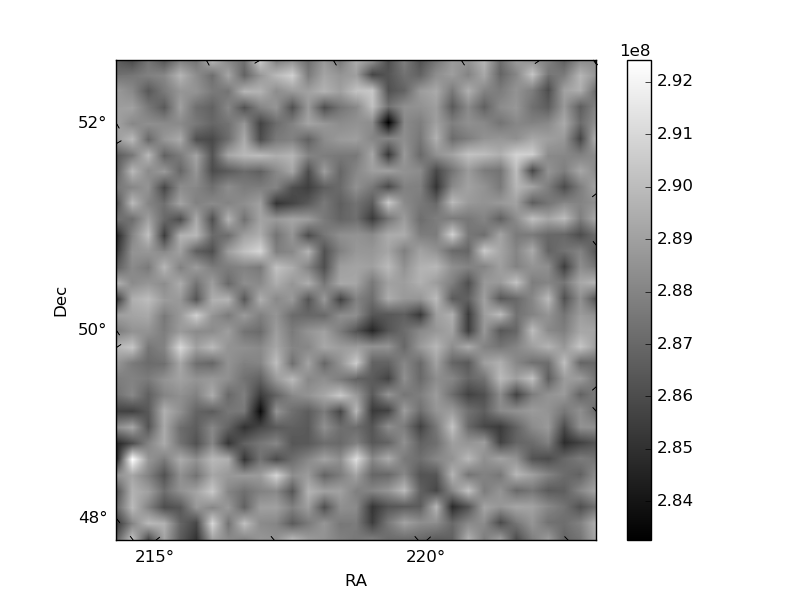
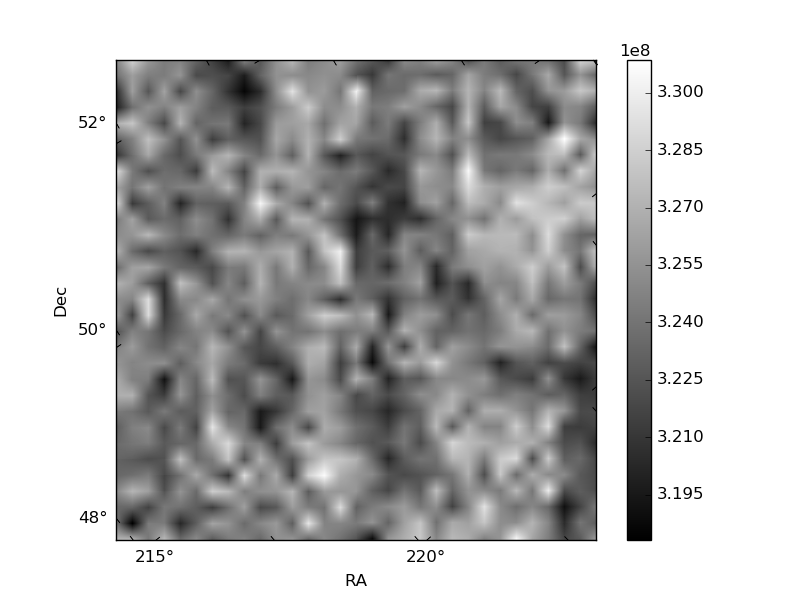
Histogram calculated using DETX and DETY for each event in the final _common_clean file
| Quadrant A | 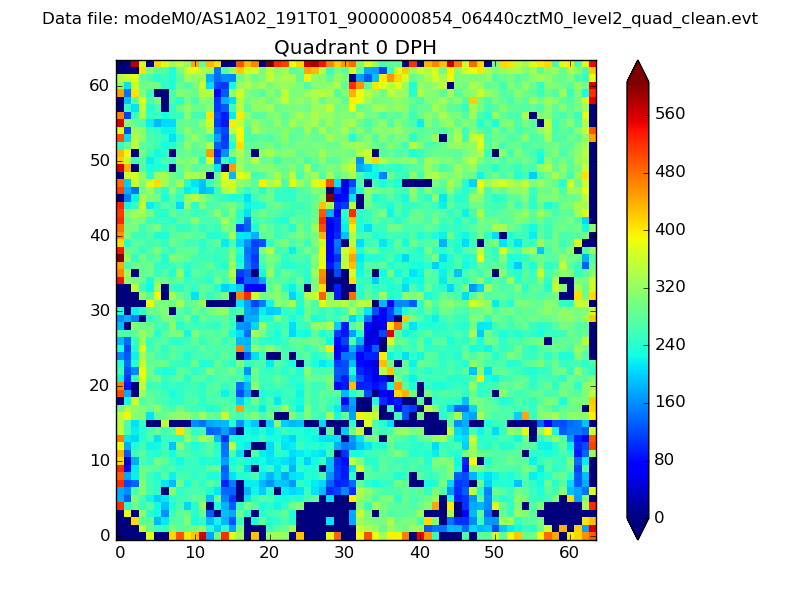 |
 |
Quadrant B |
|---|---|---|---|
| Quadrant D | 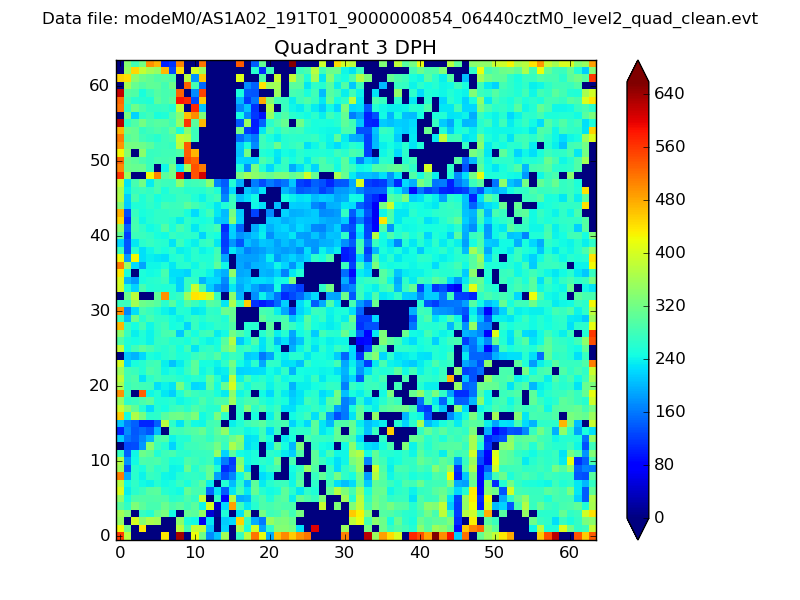 |
 |
Quadrant C |
| Plot type | Count rate plots | Images |
|---|---|---|
| Comparison with Poisson distribution Blue bars denote a histogram of data divided into 1 sec bins. Red curve is a Poisson curve with rate = median count rate of data. |
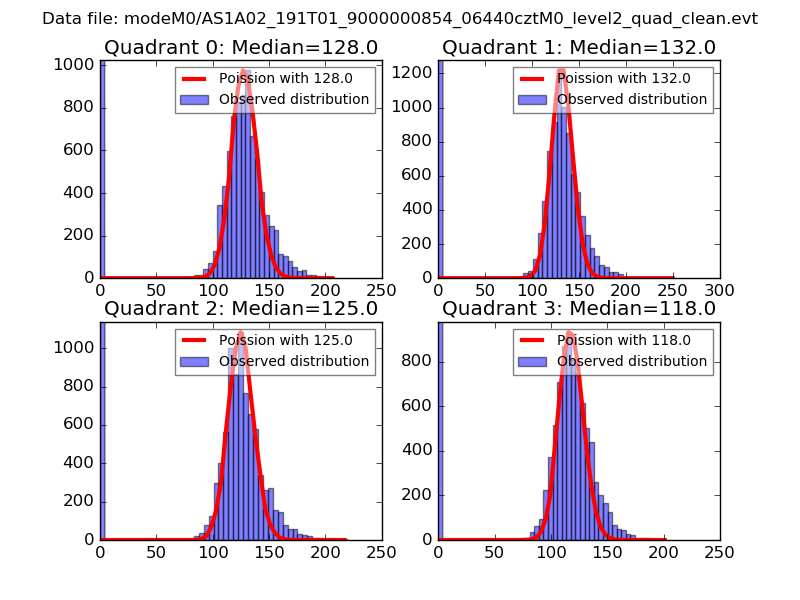 |
 |
| Quadrant-wise count rates Data is divided into 100 sec bins |
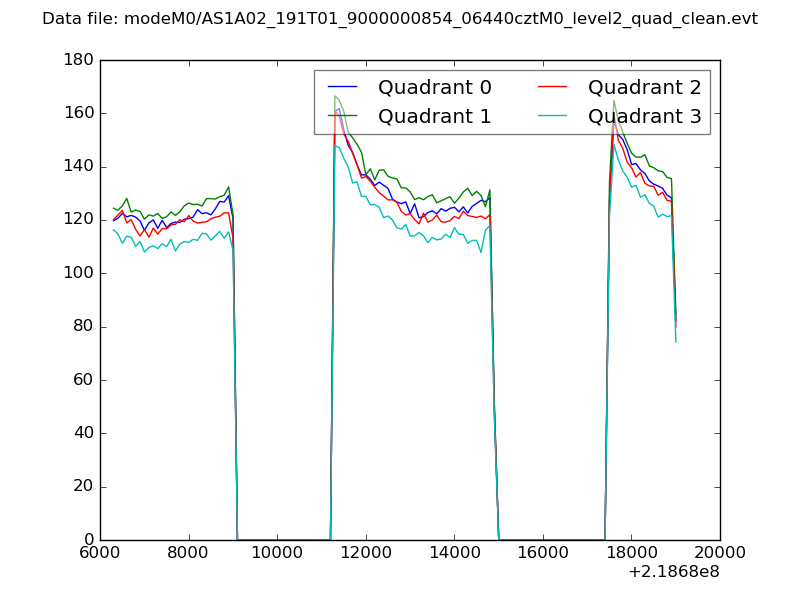 |
|
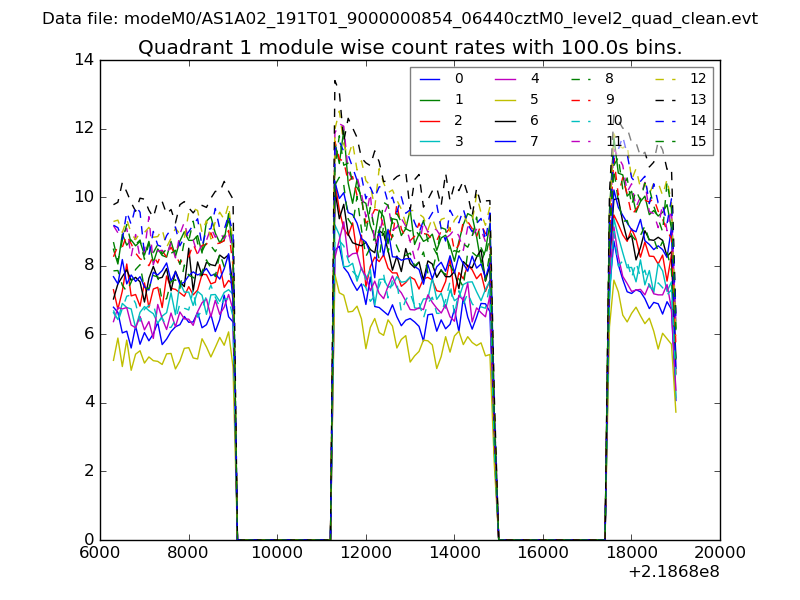
| Module-wise count rates for Quadrant A Data is divided into 100 sec bins |
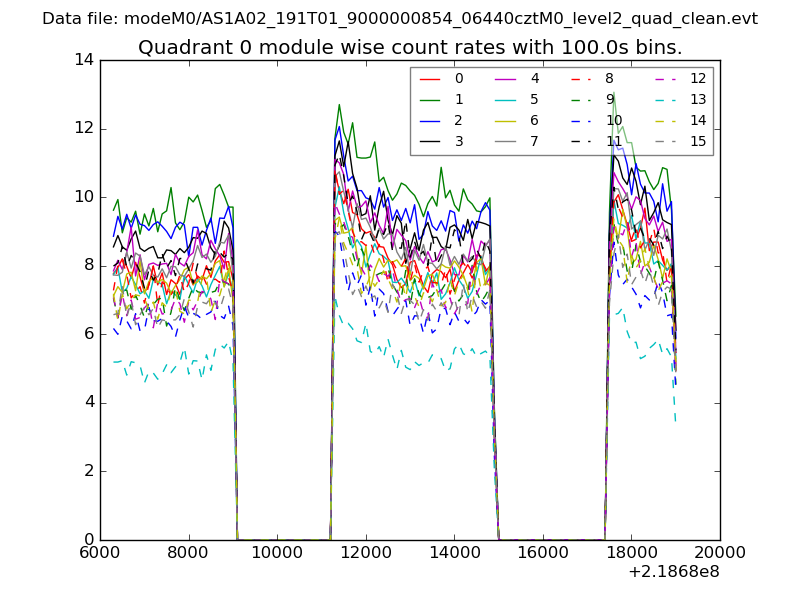 |
 |
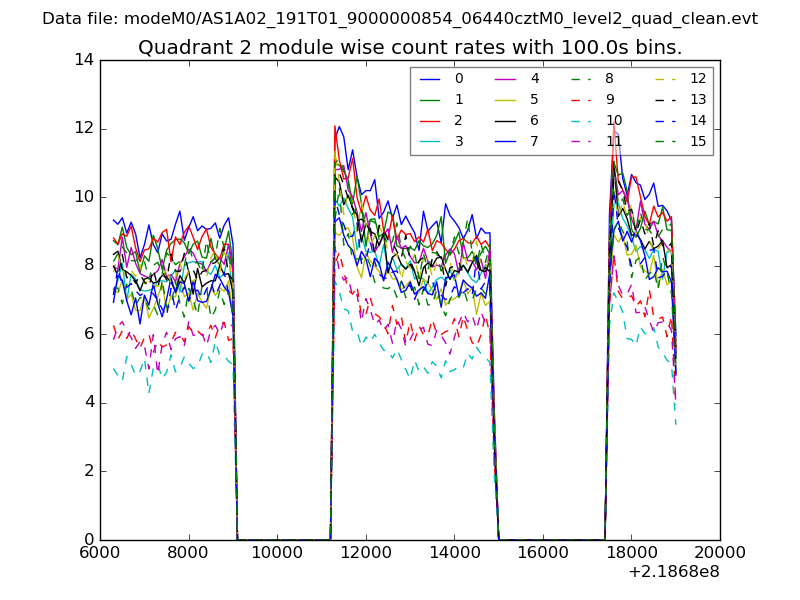
| Module-wise count rates for Quadrant B Data is divided into 100 sec bins |
 |
 |
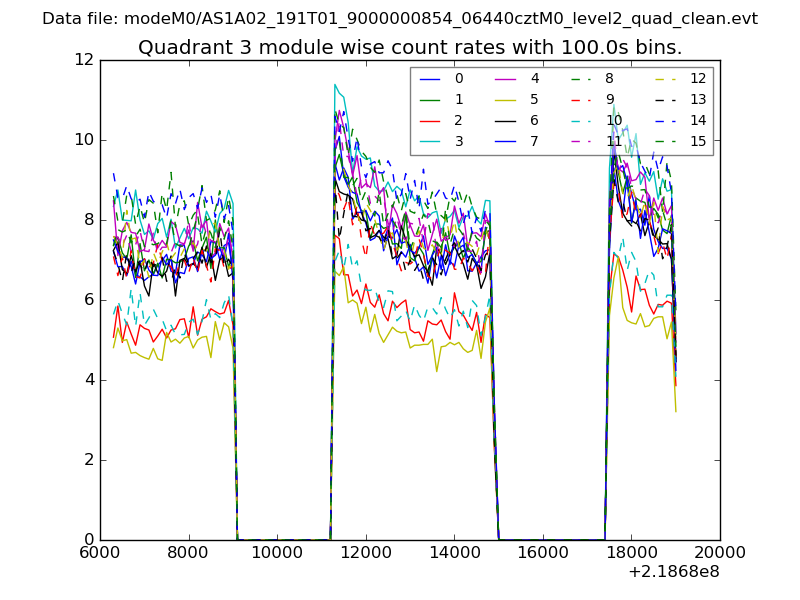
| Module-wise count rates for Quadrant C Data is divided into 100 sec bins |
 |
 |
| Module-wise count rates for Quadrant D Data is divided into 100 sec bins |
 |
 |
| Parameter | Plot |
|---|---|
| CZT HV Monitor | 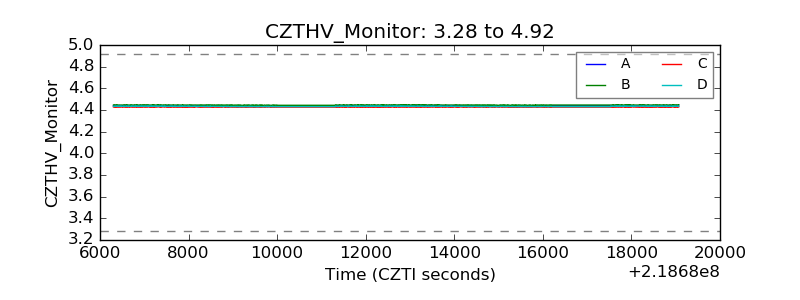 |
| D_VDD | 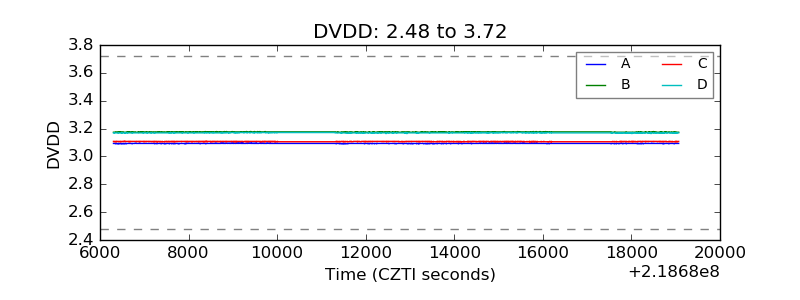 |
| Temperature 1 | 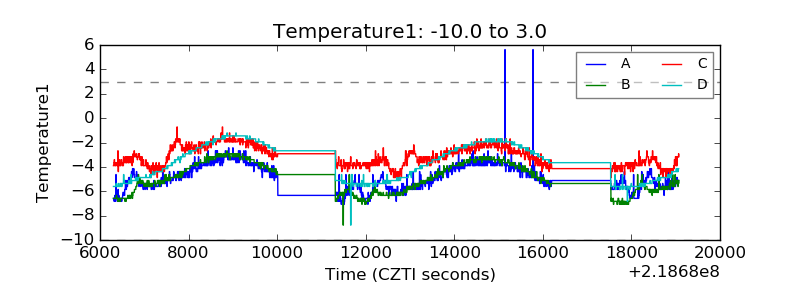 |
| Veto HV Monitor | 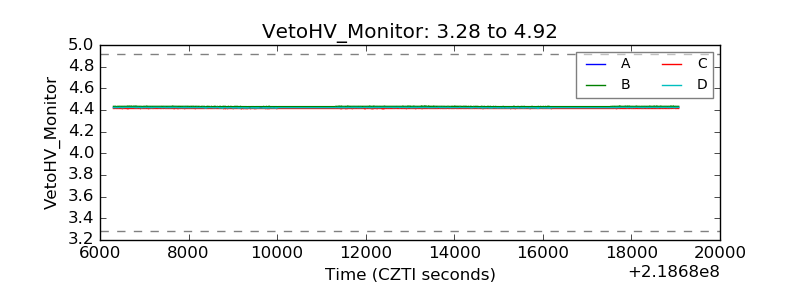 |
| Veto LLD | 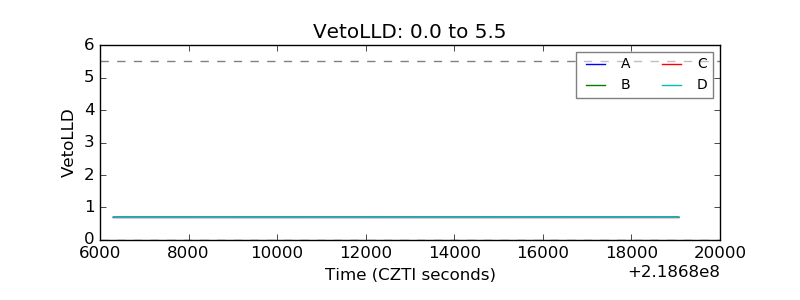 |
| Alpha Counter | 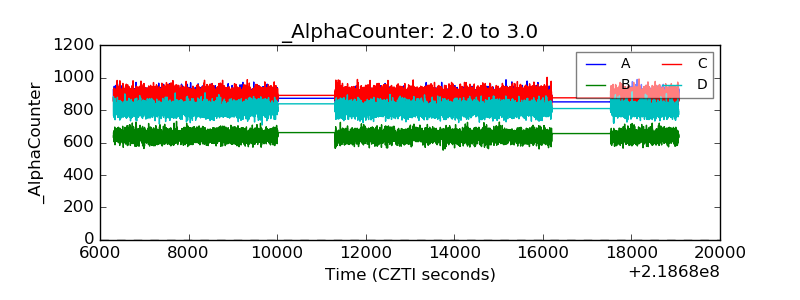 |
| _CPM_Rate | 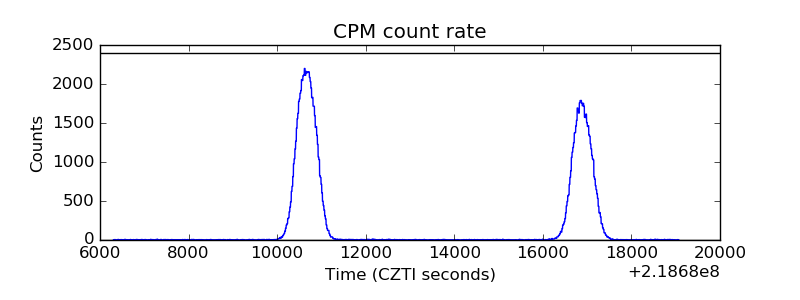 |
| CZT Counter | 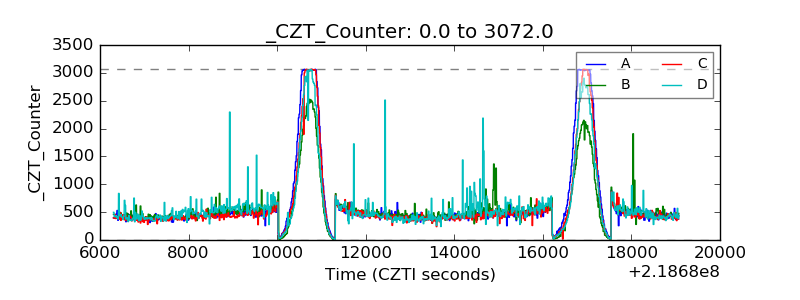 |
| +2.5 Volts monitor |  |
| +5 Volts monitor |  |
| _ROLL_ROT | 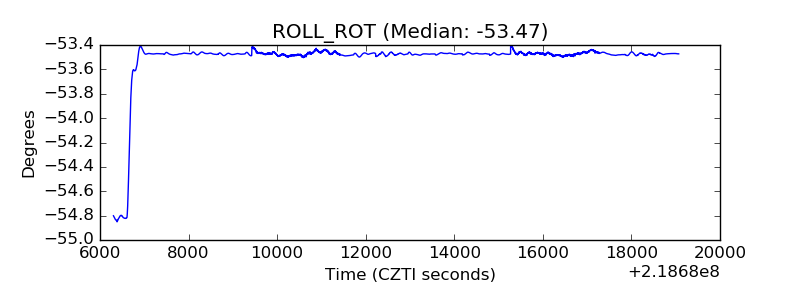 |
| _Roll_DEC | 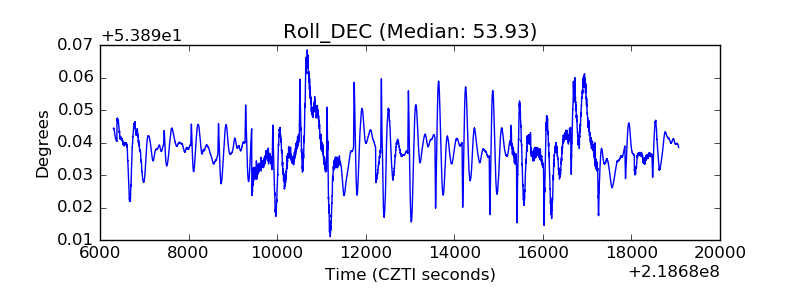 |
| _Roll_RA | 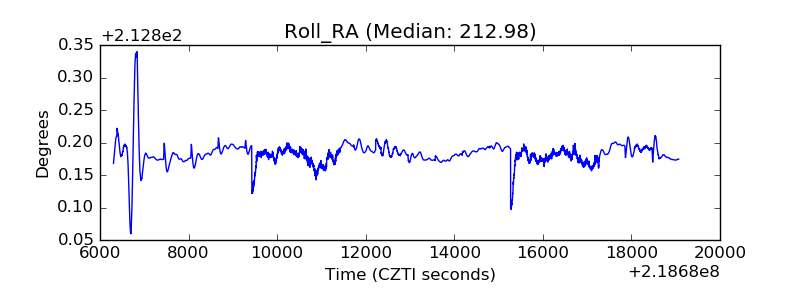 |
| Veto Counter | 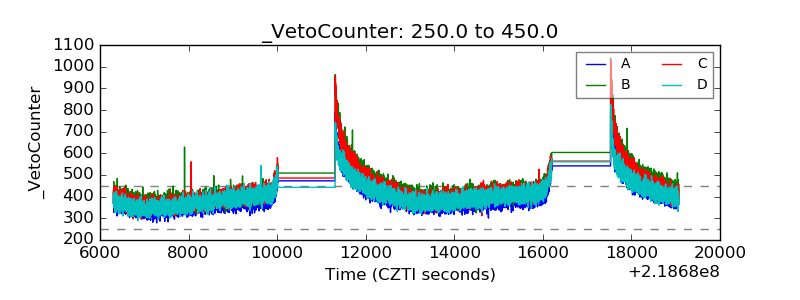 |