| Param | Original file | Final file |
|---|---|---|
| Filename | modeM0/AS1A02_191T01_9000000854_06441cztM0_level2.evt | modeM0/AS1A02_191T01_9000000854_06441cztM0_level2_quad_clean.evt |
| Size (bytes) | 396,858,240 | 89,323,200 |
| Size | 378.5 MB | 85.2 MB |
| Events in quadrant A | 2,832,712 | 578,238 |
| Events in quadrant B | 3,034,730 | 598,822 |
| Events in quadrant C | 2,710,517 | 565,849 |
| Events in quadrant D | 3,024,931 | 535,389 |
| Mode SS | |||
|---|---|---|---|
| Quadrant | BADHDUFLAG | Total packets | Discarded packets |
| A | 0 | 122 | 0 |
| B | 0 | 122 | 0 |
| C | 0 | 122 | 0 |
| D | 0 | 122 | 0 |
| Mode M0 | |||
|---|---|---|---|
| Quadrant | BADHDUFLAG | Total packets | Discarded packets |
| A | 0 | 12476 | 2 |
| B | 0 | 12845 | 1 |
| C | 0 | 12431 | 1 |
| D | 0 | 13218 | 1 |
| Mode M9 | |||
|---|---|---|---|
| Quadrant | BADHDUFLAG | Total packets | Discarded packets |
| A | 0 | 14 | 0 |
| B | 0 | 14 | 0 |
| C | 0 | 14 | 0 |
| D | 0 | 14 | 0 |
| Quadrant | Total seconds | Saturated seconds | Saturation percentage |
|---|---|---|---|
| A | 6120 | 38 | 0.620915% |
| B | 6120 | 69 | 1.127451% |
| C | 6120 | 13 | 0.212418% |
| D | 6120 | 27 | 0.441176% |
Noise dominated data is calculated using 1-second bins in cleaned event files. If a bin has >2000 counts, and if more than 50% of those come from <1% of pixels, then it is considered to be noise-dominated and hence unusable.
| Quadrant | # 1 sec bins | Bins with >0 counts | Bins with >2000 counts | High rate bins dominated by noise | Noise dominated (total time) | Noise dominated (detector-on time) | Marked lightcurve |
|---|---|---|---|---|---|---|---|
| A | 7425 | 6121 | 0 | 0 | 0.00% | 0.00% | 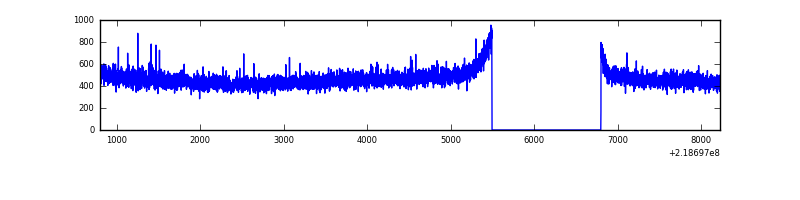 |
| B | 7425 | 6121 | 9 | 9 | 0.12% | 0.15% | 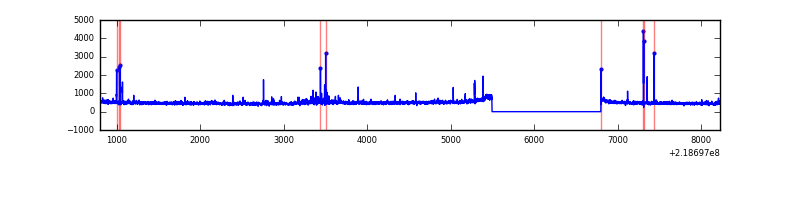 |
| C | 7425 | 6121 | 0 | 0 | 0.00% | 0.00% | 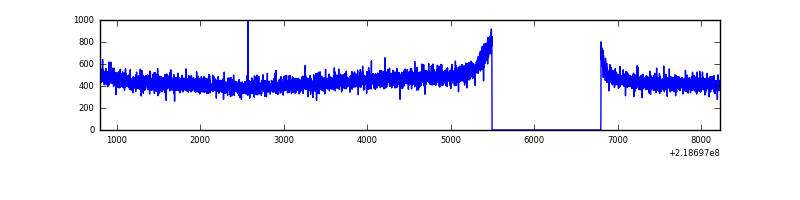 |
| D | 7425 | 6121 | 10 | 10 | 0.13% | 0.16% | 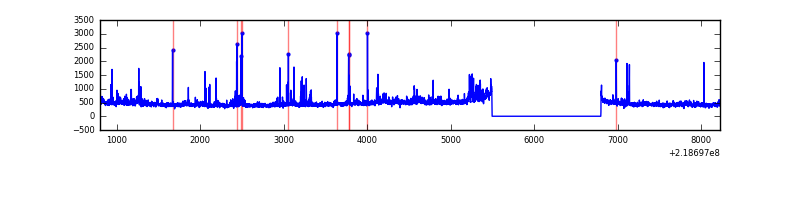 |
Top three noisy pixels from each quadrant. If the there are fewer than three noisy pixels in the level2.evt file, extra rows are filled as -1
| Pixel properties | Quadrant properties | ||||||
|---|---|---|---|---|---|---|---|
| Quadrant | DetID | PixID | Counts | Sigma | Mean | Median | Sigma |
| A | 8 | 15 | 12083 | 77.67 | 728 | 712 | 146.4 |
| A | 12 | 194 | 6986 | 42.85 | 728 | 712 | 146.4 |
| A | 0 | 226 | 6904 | 42.29 | 728 | 712 | 146.4 |
| B | 11 | 51 | 49292 | 350.59 | 734 | 718 | 138.5 |
| B | 0 | 219 | 36925 | 261.33 | 734 | 718 | 138.5 |
| B | 8 | 3 | 33415 | 236.0 | 734 | 718 | 138.5 |
| C | 13 | 61 | 5529 | 30.23 | 694 | 697 | 159.8 |
| C | 8 | 222 | 2374 | 10.49 | 694 | 697 | 159.8 |
| C | 3 | 202 | 1719 | 6.39 | 694 | 697 | 159.8 |
| D | 2 | 152 | 170228 | 1002.08 | 693 | 672 | 169.2 |
| D | 2 | 63 | 83588 | 490.03 | 693 | 672 | 169.2 |
| D | 11 | 241 | 52223 | 304.67 | 693 | 672 | 169.2 |
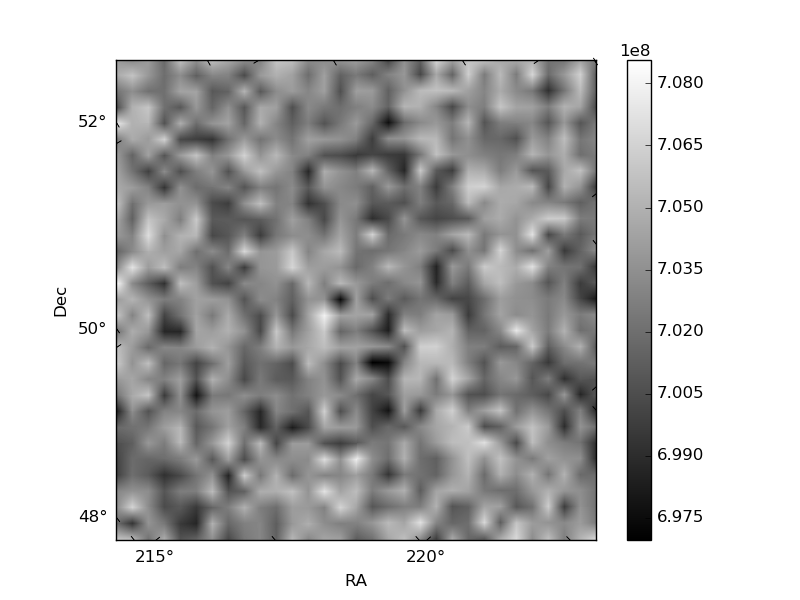
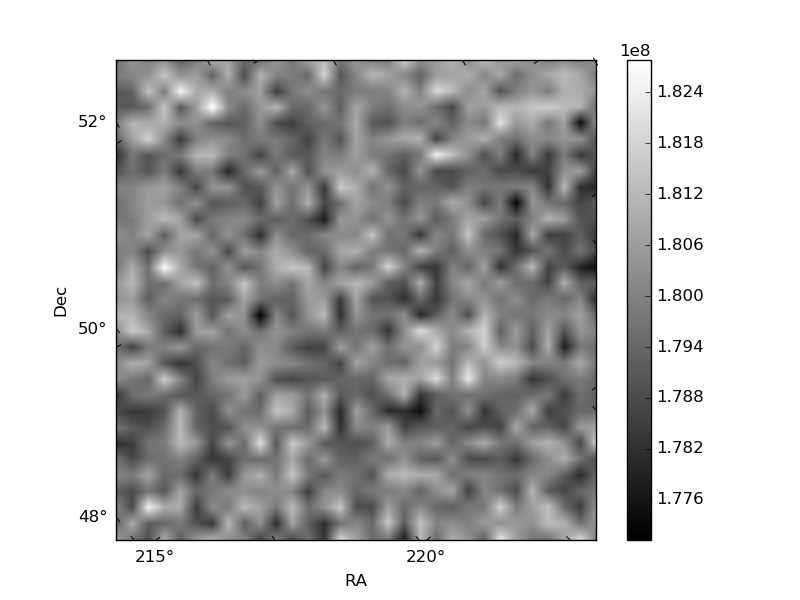
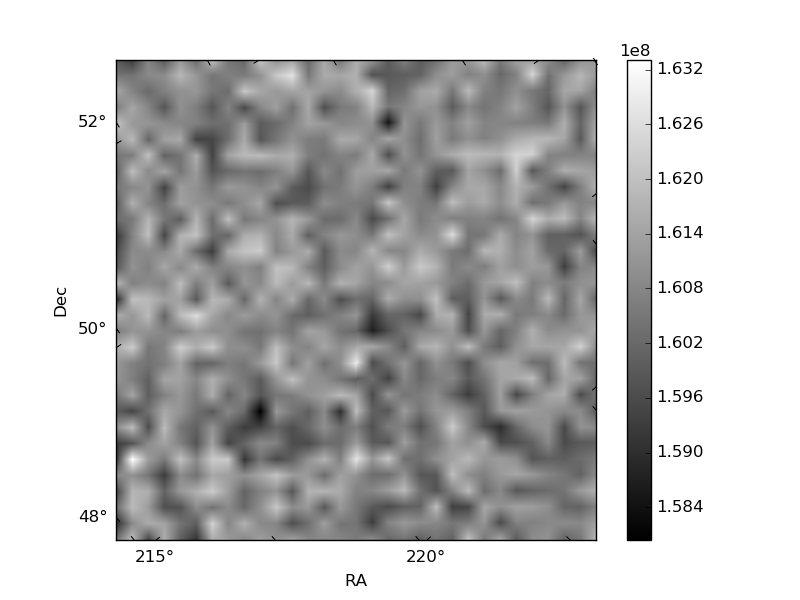
Histogram calculated using DETX and DETY for each event in the final _common_clean file
| Quadrant A | 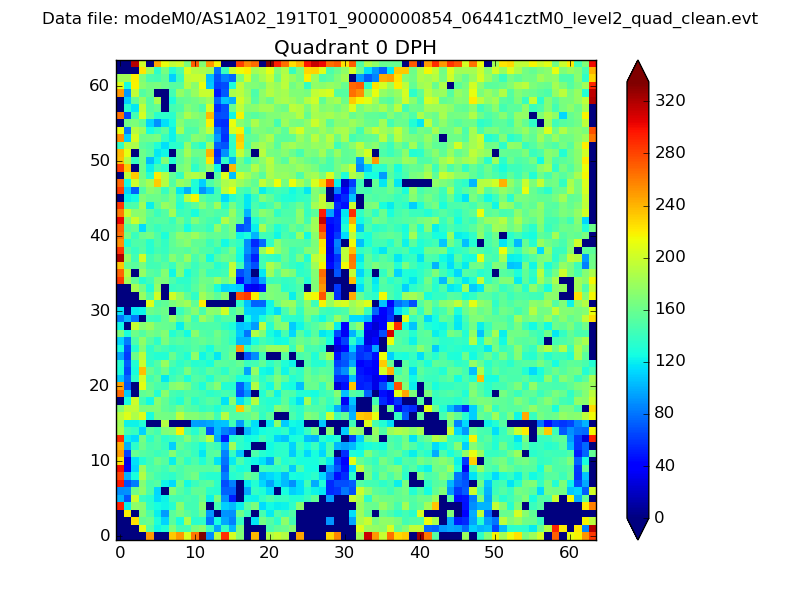 |
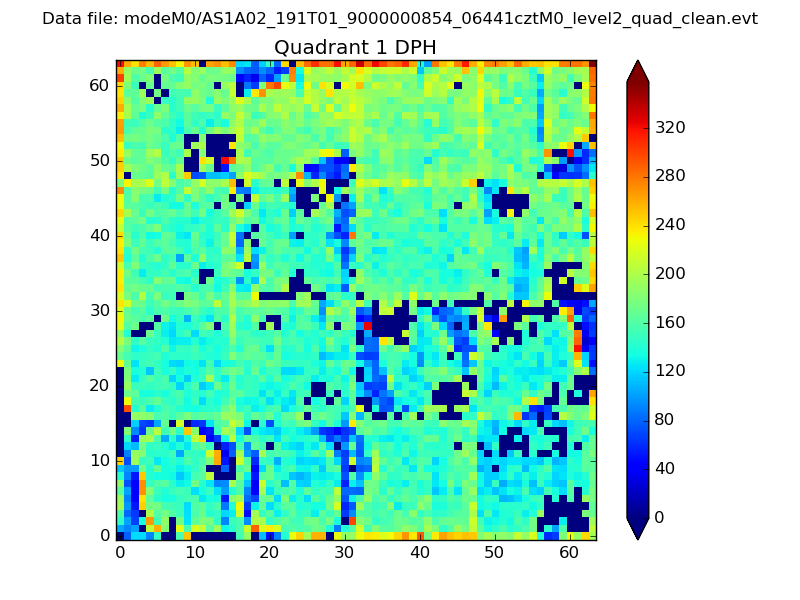 |
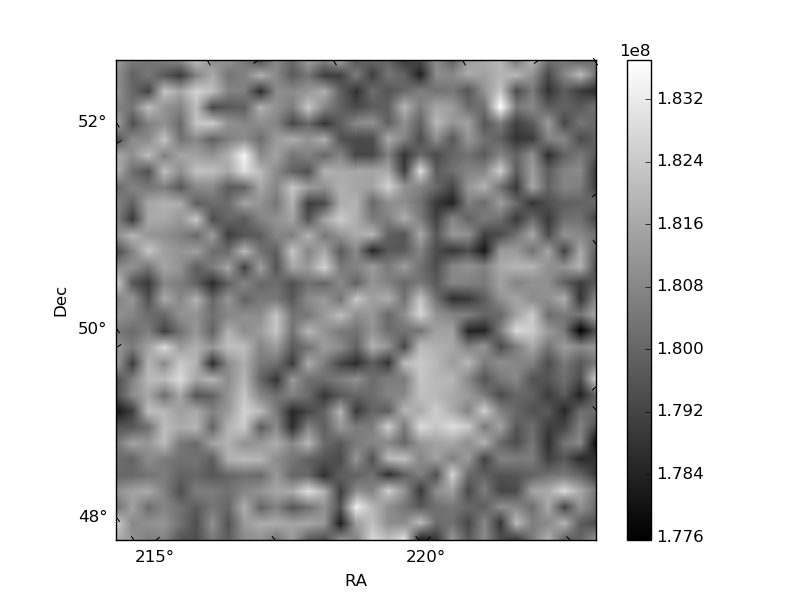
Quadrant B |
|---|---|---|---|
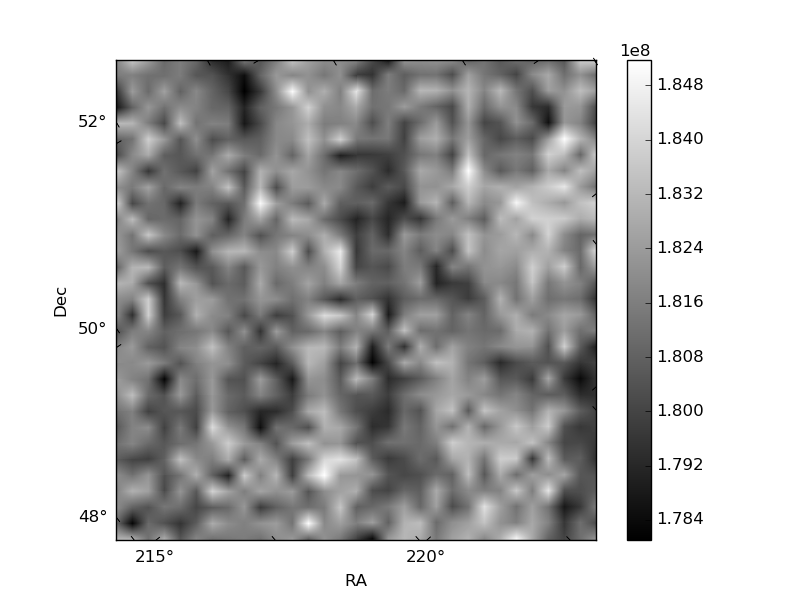
| Quadrant D | 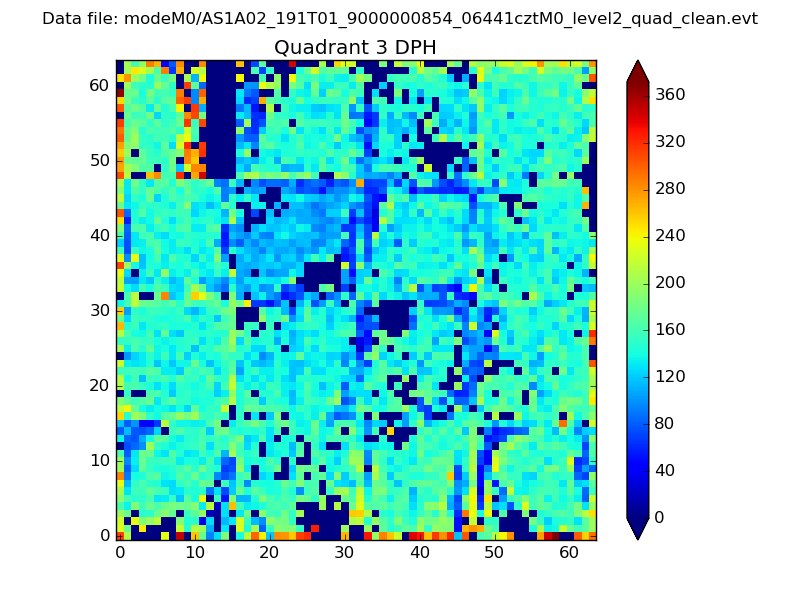 |
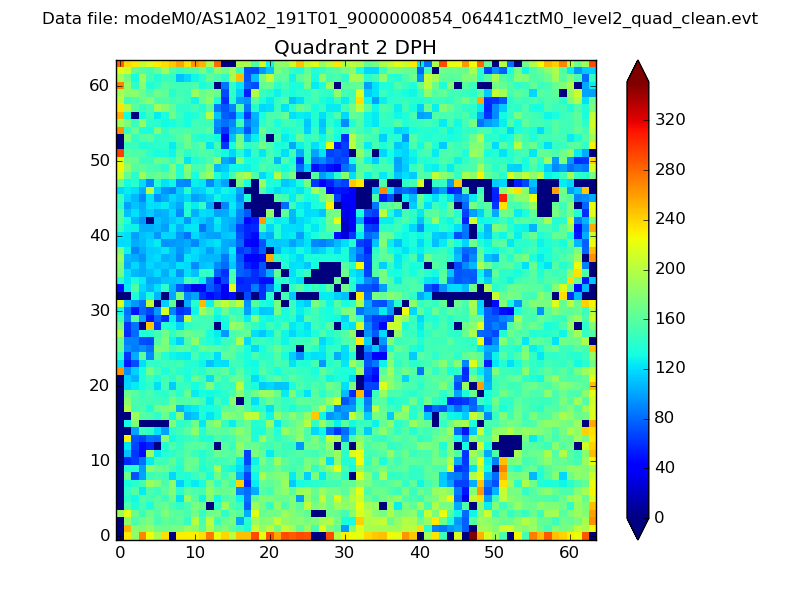 |
Quadrant C |
| Plot type | Count rate plots | Images |
|---|---|---|
| Comparison with Poisson distribution Blue bars denote a histogram of data divided into 1 sec bins. Red curve is a Poisson curve with rate = median count rate of data. |
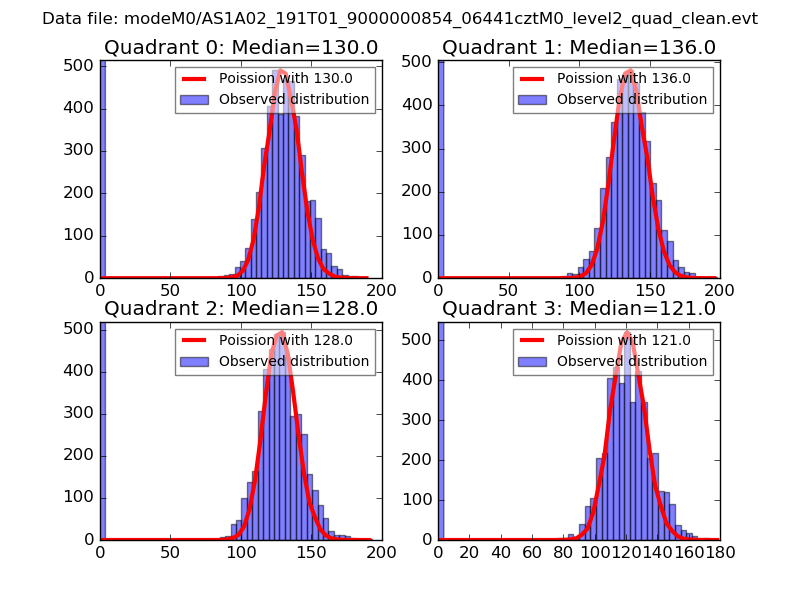 |
 |
| Quadrant-wise count rates Data is divided into 100 sec bins |
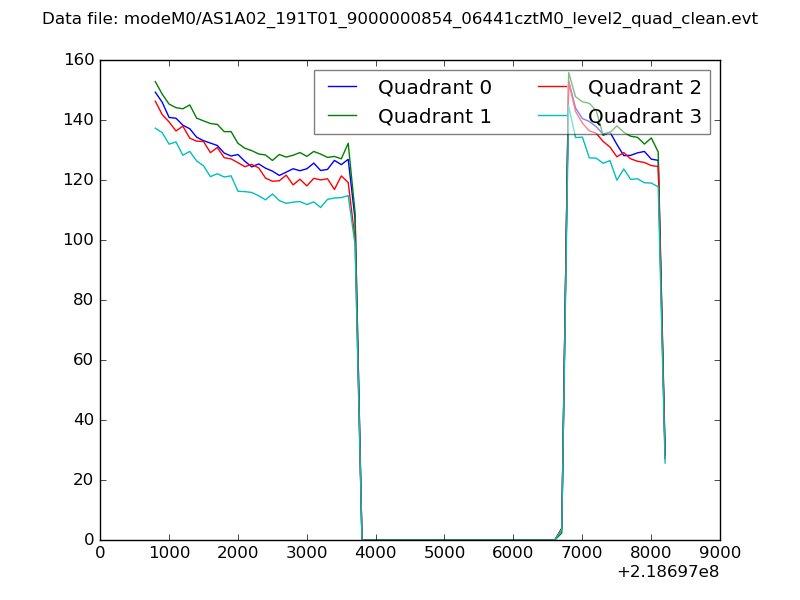 |
|
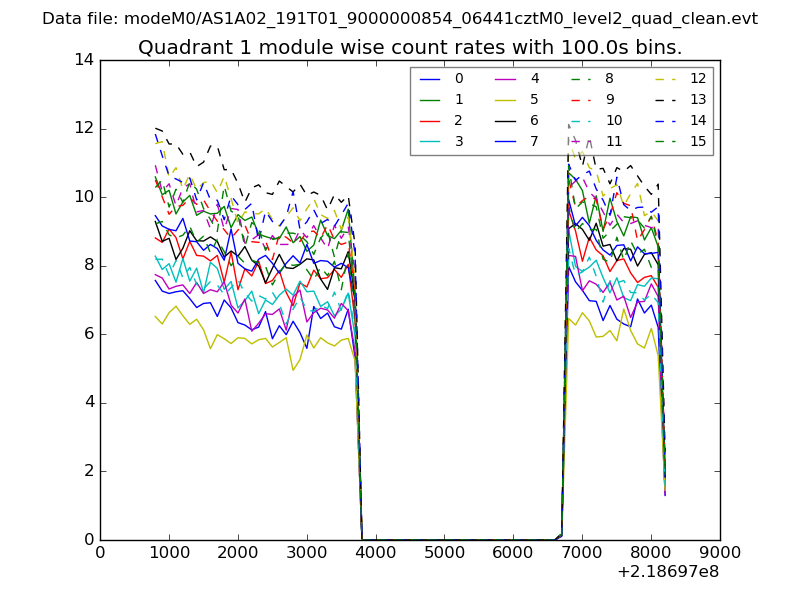
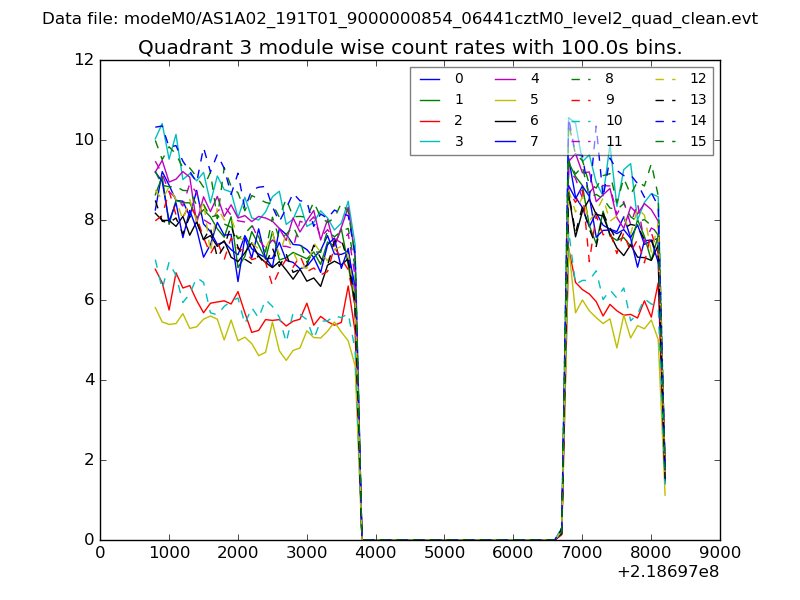
| Module-wise count rates for Quadrant A Data is divided into 100 sec bins |
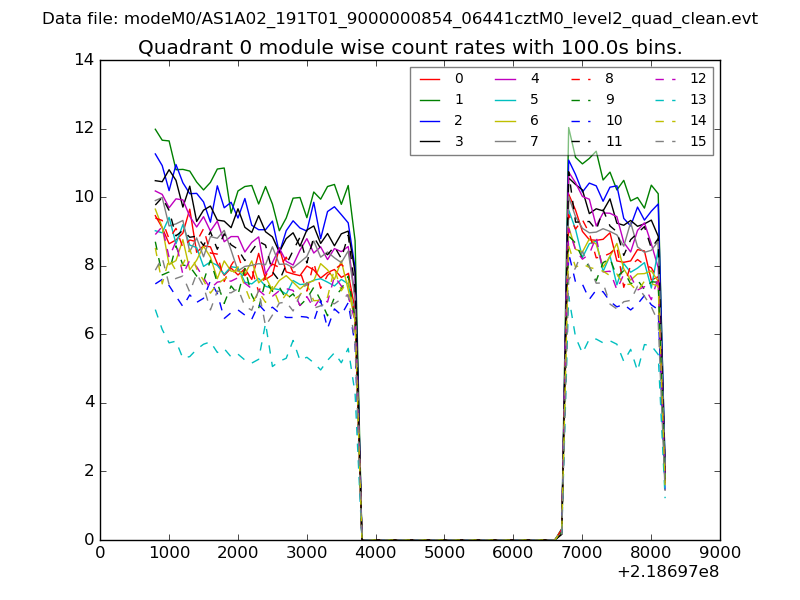 |
 |
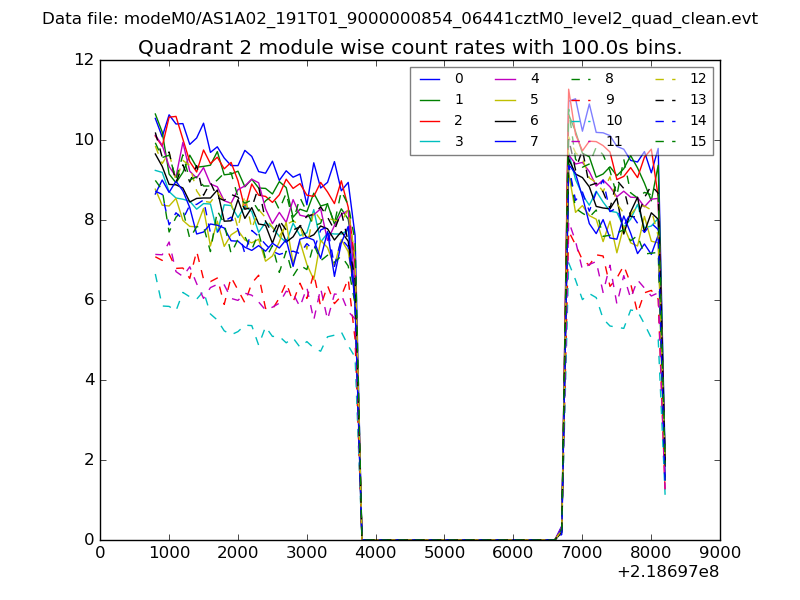
| Module-wise count rates for Quadrant B Data is divided into 100 sec bins |
 |
 |
| Module-wise count rates for Quadrant C Data is divided into 100 sec bins |
 |
 |
| Module-wise count rates for Quadrant D Data is divided into 100 sec bins |
 |
 |
| Parameter | Plot |
|---|---|
| CZT HV Monitor | 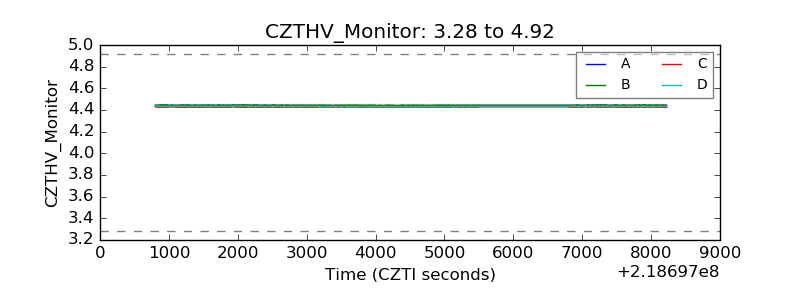 |
| D_VDD | 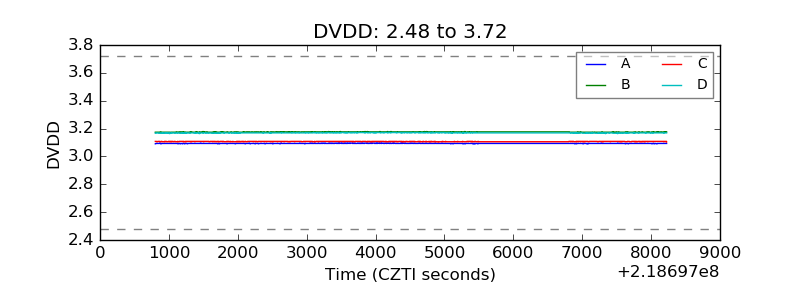 |
| Temperature 1 | 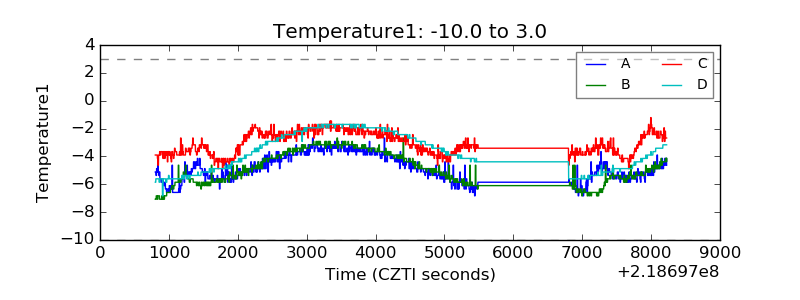 |
| Veto HV Monitor | 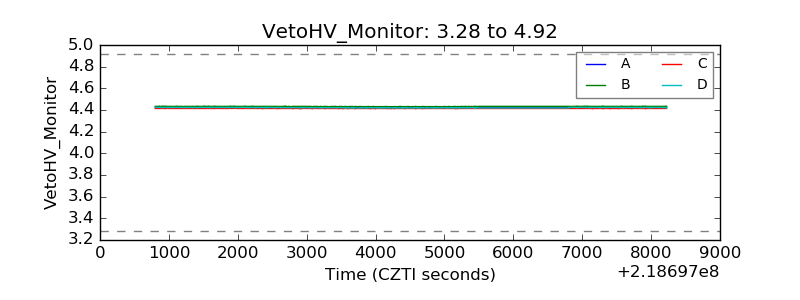 |
| Veto LLD | 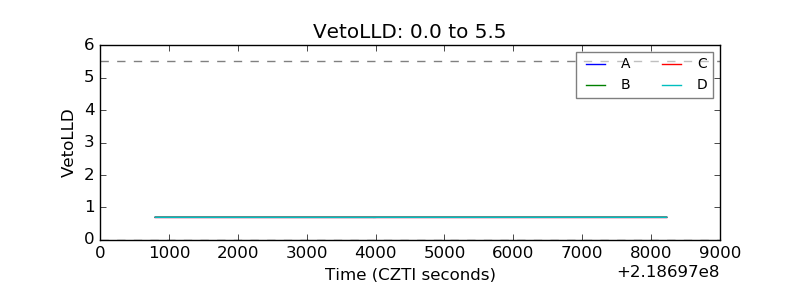 |
| Alpha Counter | 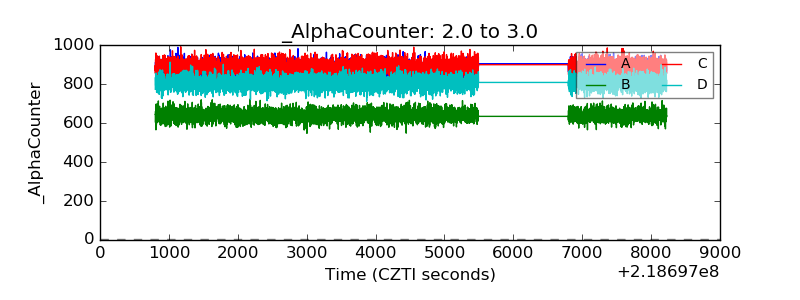 |
| _CPM_Rate | 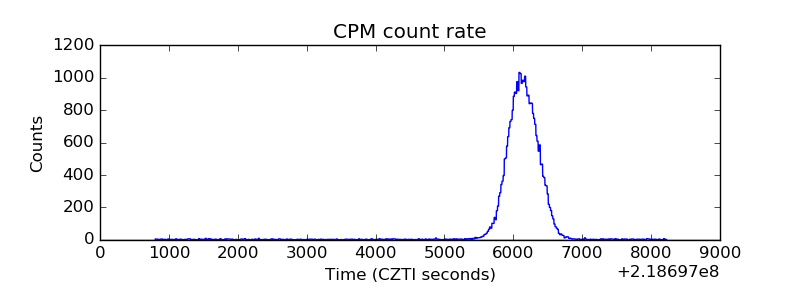 |
| CZT Counter | 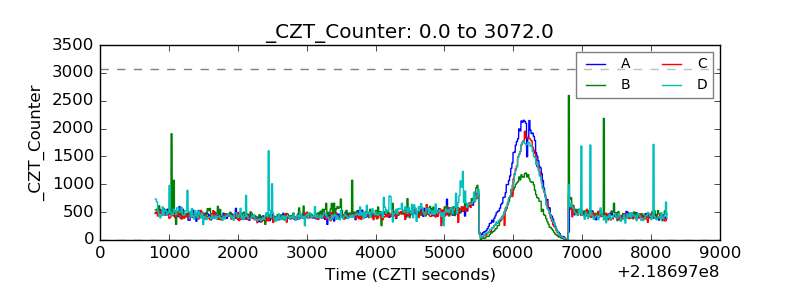 |
| +2.5 Volts monitor | 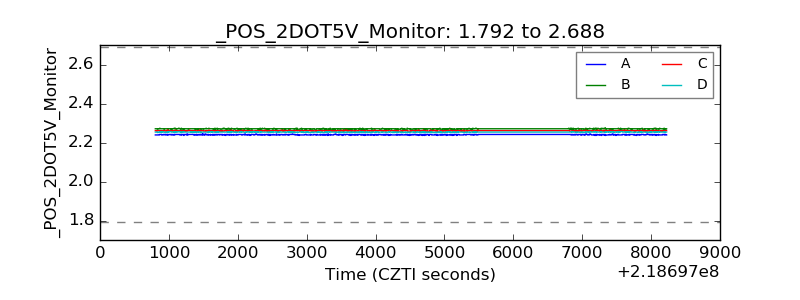 |
| +5 Volts monitor | 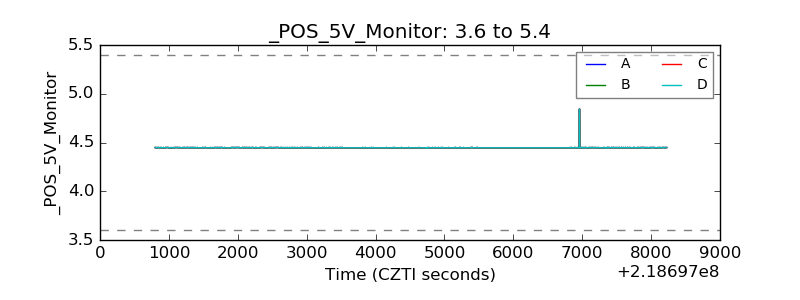 |
| _ROLL_ROT | 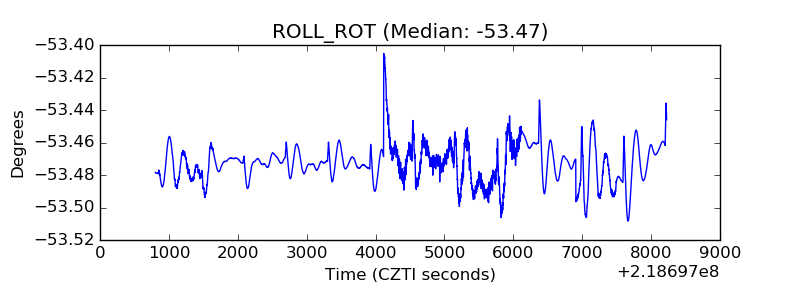 |
| _Roll_DEC | 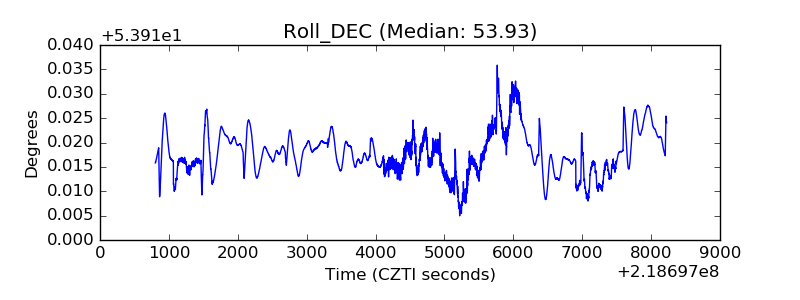 |
| _Roll_RA | 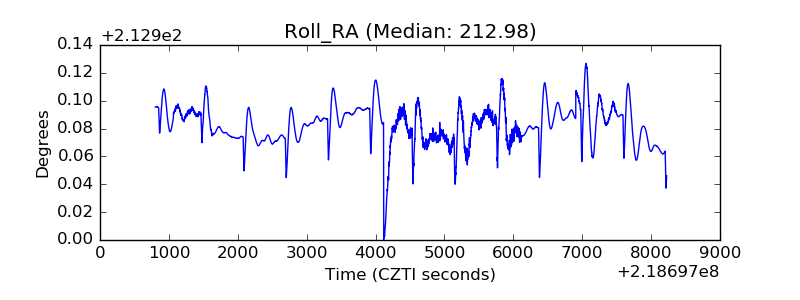 |
| Veto Counter | 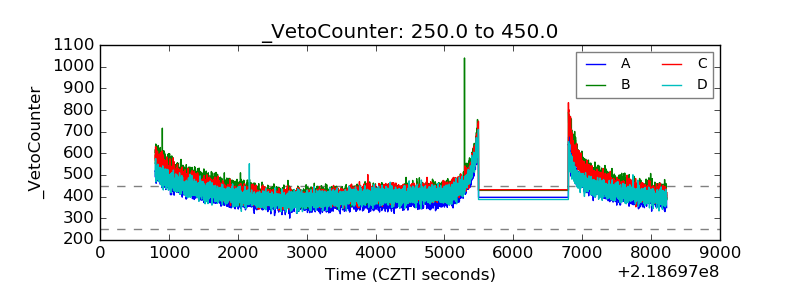 |