| Param | Original file | Final file |
|---|---|---|
| Filename | modeM0/AS1A02_191T01_9000000854_06443cztM0_level2.evt | modeM0/AS1A02_191T01_9000000854_06443cztM0_level2_quad_clean.evt |
| Size (bytes) | 398,808,000 | 82,301,760 |
| Size | 380.3 MB | 78.5 MB |
| Events in quadrant A | 2,773,432 | 520,508 |
| Events in quadrant B | 2,940,701 | 535,183 |
| Events in quadrant C | 2,675,149 | 513,766 |
| Events in quadrant D | 3,267,665 | 490,921 |
| Mode SS | |||
|---|---|---|---|
| Quadrant | BADHDUFLAG | Total packets | Discarded packets |
| A | 0 | 126 | 0 |
| B | 0 | 126 | 0 |
| C | 0 | 126 | 0 |
| D | 0 | 126 | 0 |
| Mode M0 | |||
|---|---|---|---|
| Quadrant | BADHDUFLAG | Total packets | Discarded packets |
| A | 0 | 12549 | 2 |
| B | 0 | 12841 | 1 |
| C | 0 | 12528 | 1 |
| D | 0 | 14104 | 1 |
| Mode M9 | |||
|---|---|---|---|
| Quadrant | BADHDUFLAG | Total packets | Discarded packets |
| A | 0 | 9 | 0 |
| B | 0 | 9 | 0 |
| C | 0 | 9 | 0 |
| D | 0 | 9 | 0 |
| Quadrant | Total seconds | Saturated seconds | Saturation percentage |
|---|---|---|---|
| A | 6185 | 61 | 0.986257% |
| B | 6185 | 49 | 0.792239% |
| C | 6185 | 18 | 0.291027% |
| D | 6185 | 82 | 1.325788% |
Noise dominated data is calculated using 1-second bins in cleaned event files. If a bin has >2000 counts, and if more than 50% of those come from <1% of pixels, then it is considered to be noise-dominated and hence unusable.
| Quadrant | # 1 sec bins | Bins with >0 counts | Bins with >2000 counts | High rate bins dominated by noise | Noise dominated (total time) | Noise dominated (detector-on time) | Marked lightcurve |
|---|---|---|---|---|---|---|---|
| A | 7090 | 6186 | 0 | 0 | 0.00% | 0.00% | 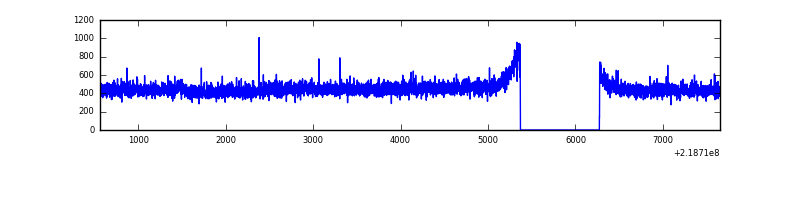 |
| B | 7090 | 6186 | 5 | 5 | 0.07% | 0.08% | 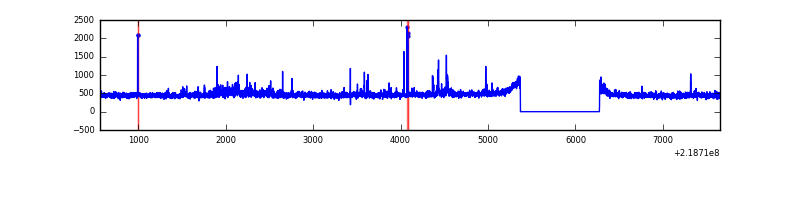 |
| C | 7090 | 6186 | 1 | 1 | 0.01% | 0.02% | 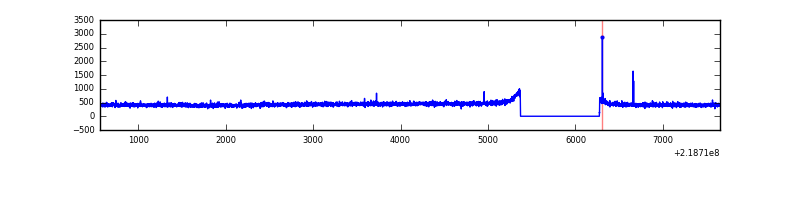 |
| D | 7090 | 6186 | 43 | 43 | 0.61% | 0.70% |  |
Top three noisy pixels from each quadrant. If the there are fewer than three noisy pixels in the level2.evt file, extra rows are filled as -1
| Pixel properties | Quadrant properties | ||||||
|---|---|---|---|---|---|---|---|
| Quadrant | DetID | PixID | Counts | Sigma | Mean | Median | Sigma |
| A | 8 | 15 | 16140 | 106.65 | 711 | 695 | 144.8 |
| A | 10 | 133 | 13016 | 85.07 | 711 | 695 | 144.8 |
| A | 15 | 236 | 8053 | 50.81 | 711 | 695 | 144.8 |
| B | 11 | 51 | 64670 | 467.48 | 714 | 697 | 136.8 |
| B | 15 | 204 | 31660 | 226.26 | 714 | 697 | 136.8 |
| B | 15 | 35 | 23368 | 165.67 | 714 | 697 | 136.8 |
| C | 9 | 16 | 7933 | 45.78 | 683 | 684 | 158.3 |
| C | 13 | 61 | 5298 | 29.14 | 683 | 684 | 158.3 |
| C | 9 | 54 | 2802 | 13.38 | 683 | 684 | 158.3 |
| D | 2 | 152 | 314879 | 1884.29 | 683 | 660 | 166.8 |
| D | 2 | 136 | 167001 | 997.5 | 683 | 660 | 166.8 |
| D | 2 | 63 | 92281 | 549.43 | 683 | 660 | 166.8 |
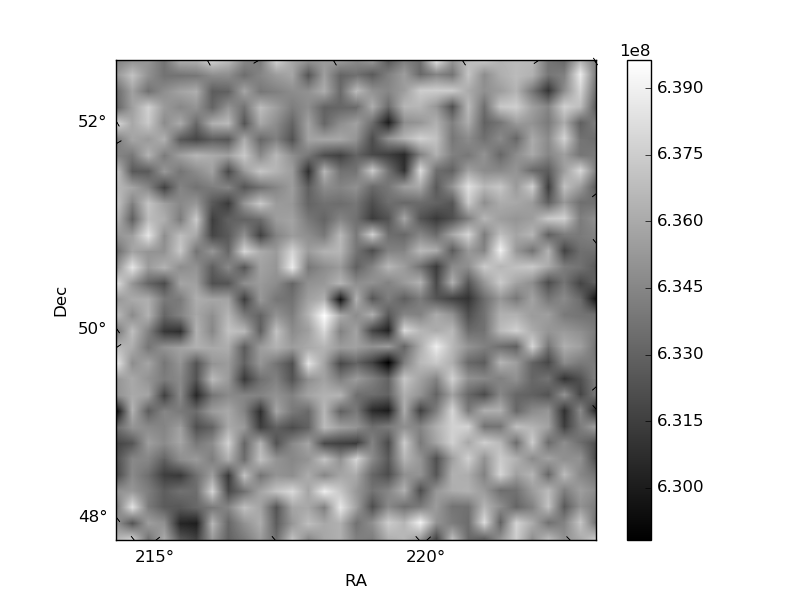
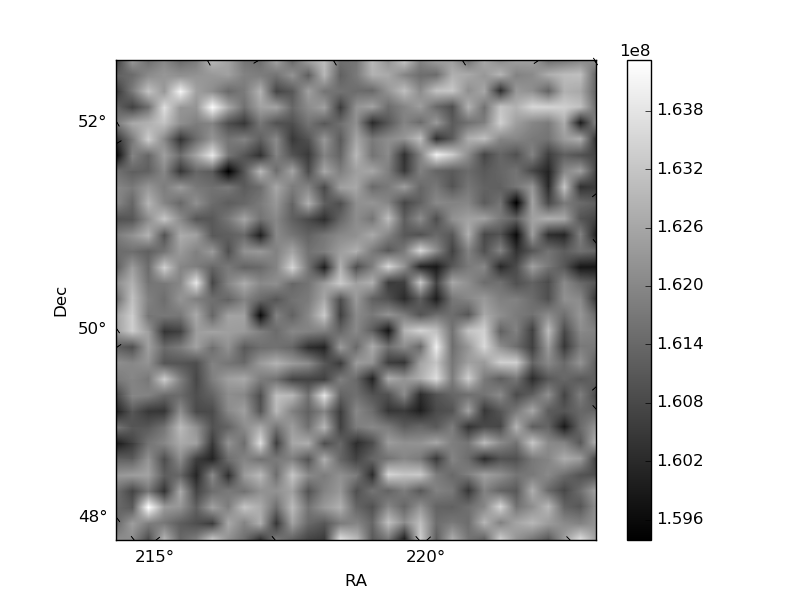
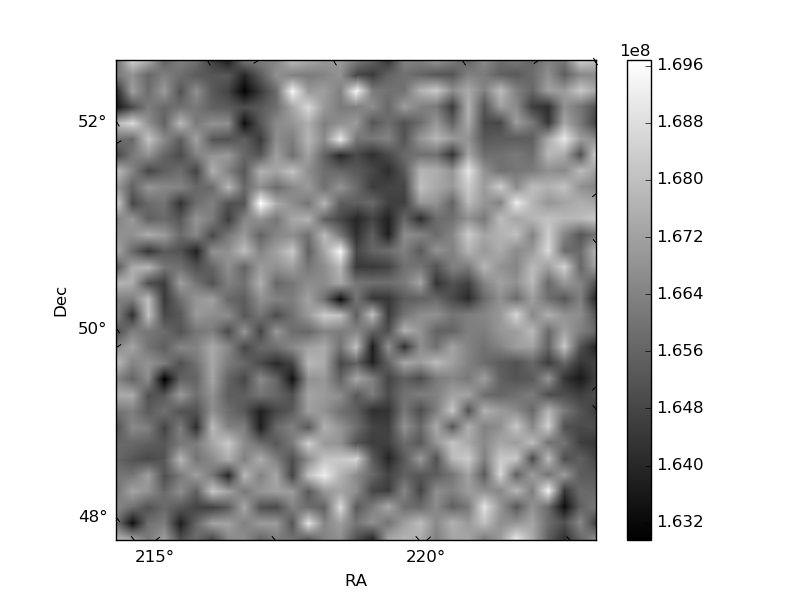
Histogram calculated using DETX and DETY for each event in the final _common_clean file
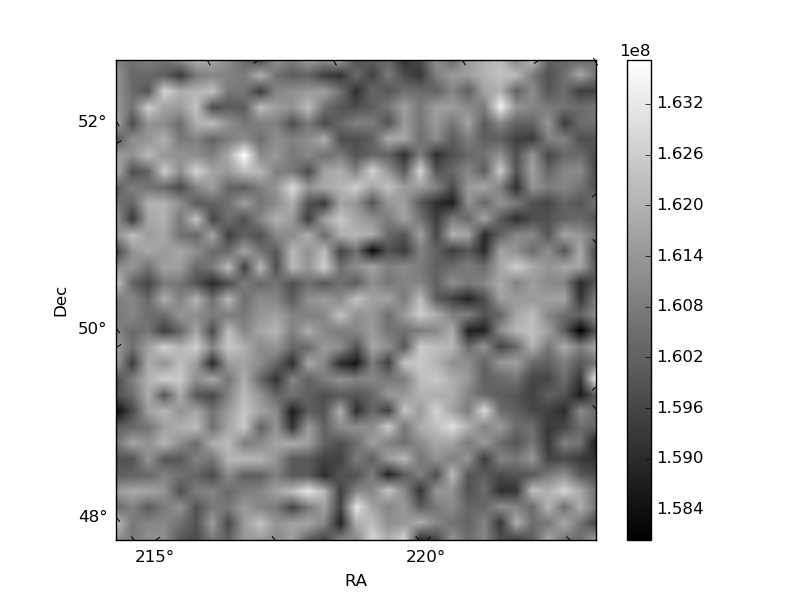
| Quadrant A | 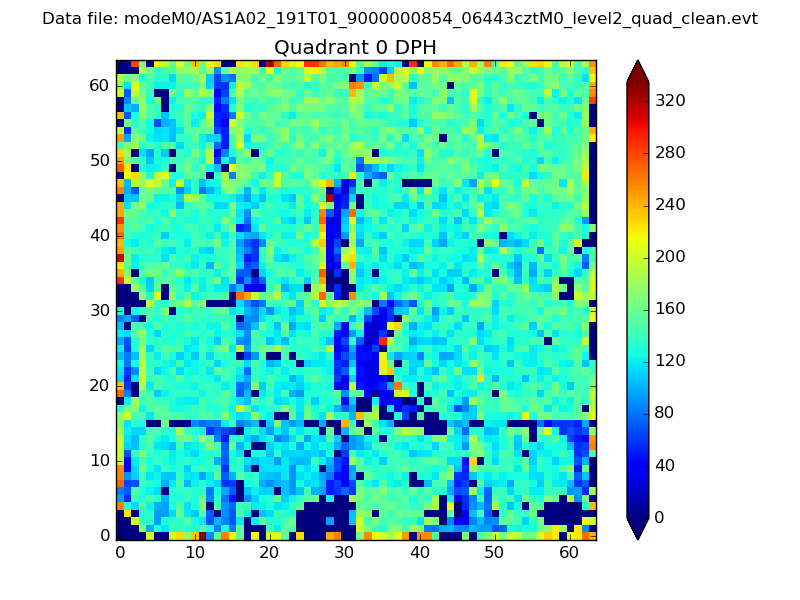 |
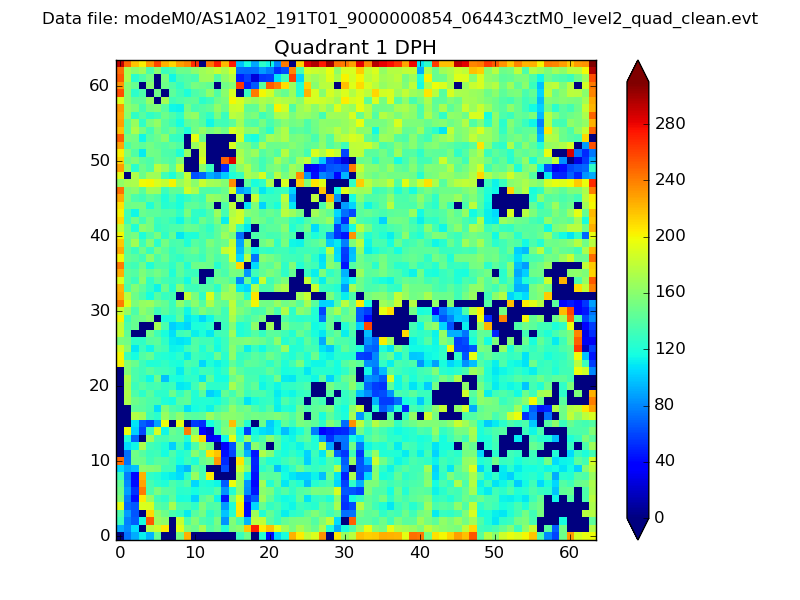 |
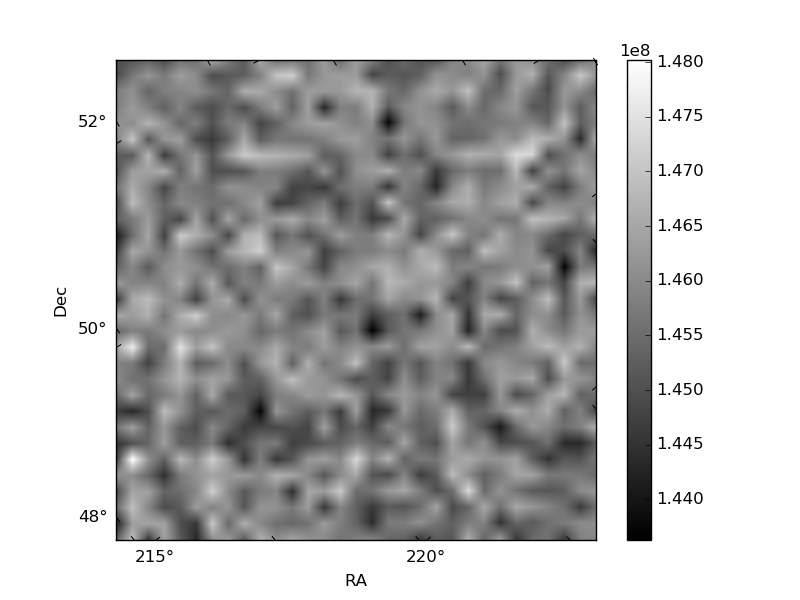
Quadrant B |
|---|---|---|---|
| Quadrant D | 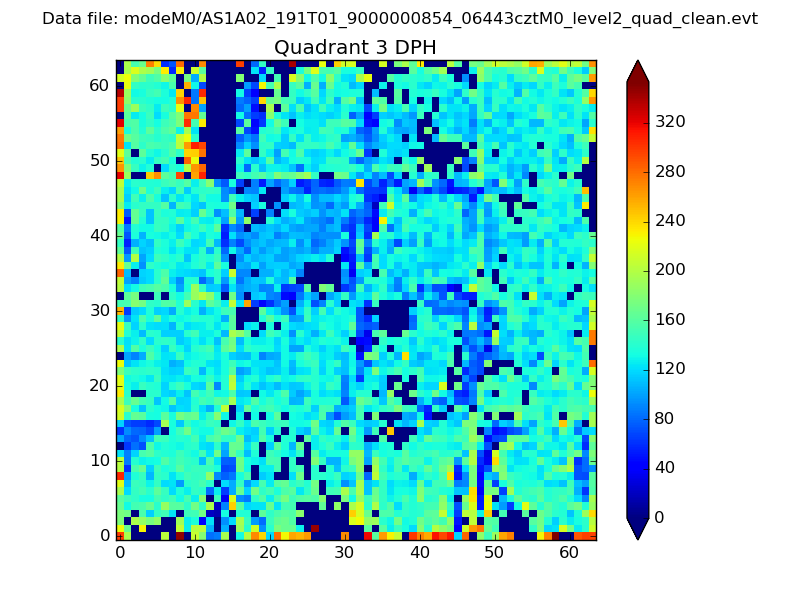 |
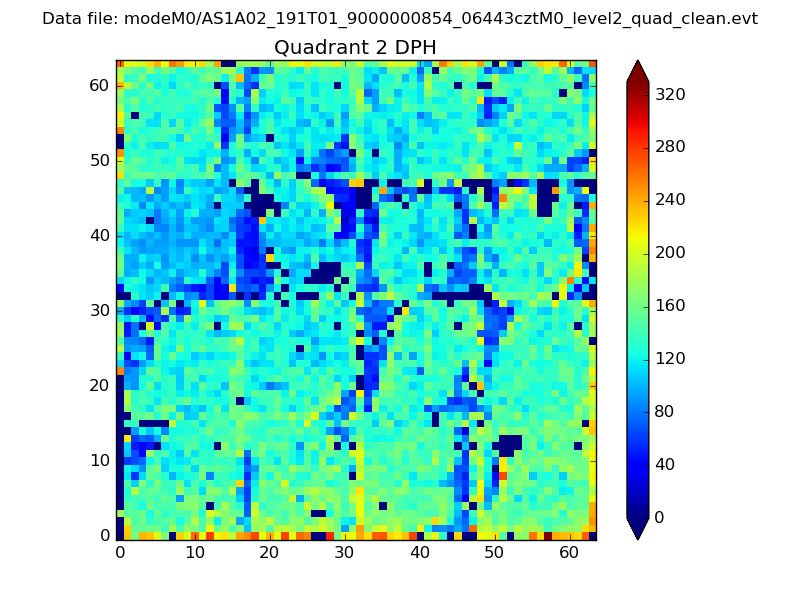 |
Quadrant C |
| Plot type | Count rate plots | Images |
|---|---|---|
| Comparison with Poisson distribution Blue bars denote a histogram of data divided into 1 sec bins. Red curve is a Poisson curve with rate = median count rate of data. |
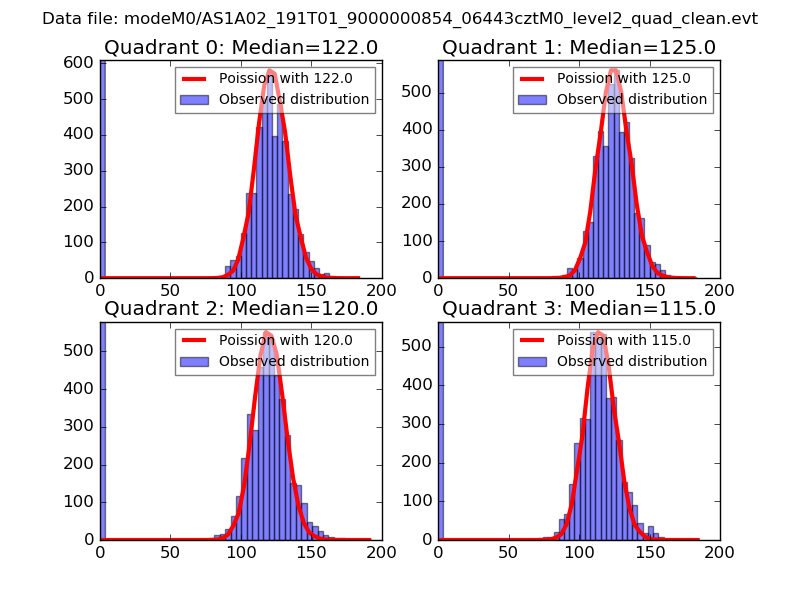 |
 |
| Quadrant-wise count rates Data is divided into 100 sec bins |
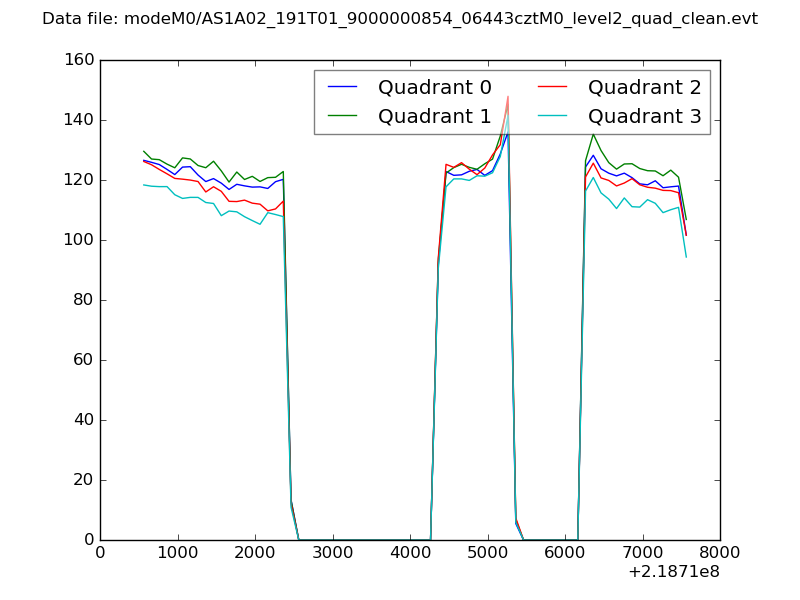 |
|
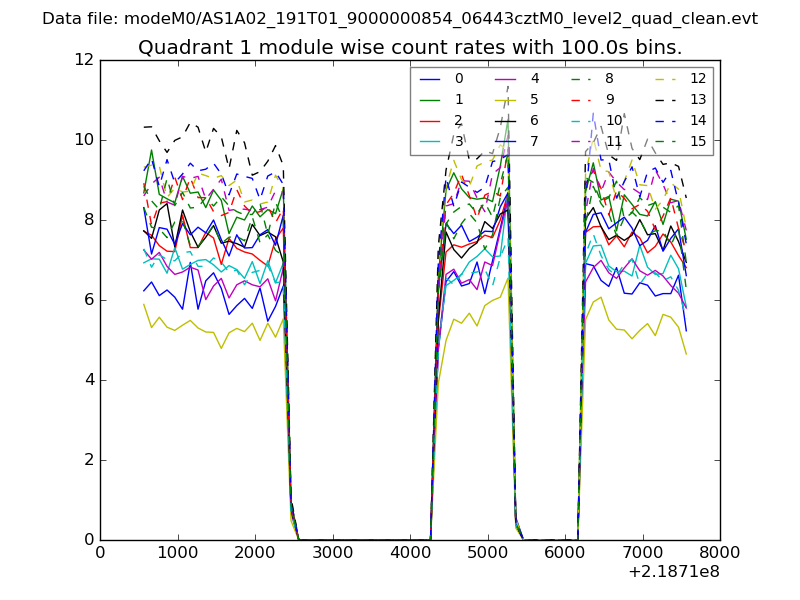
| Module-wise count rates for Quadrant A Data is divided into 100 sec bins |
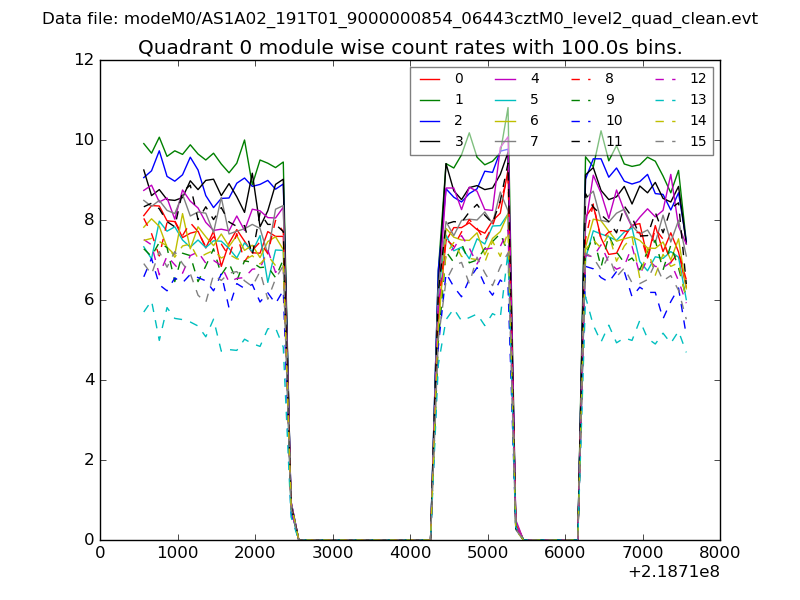 |
 |
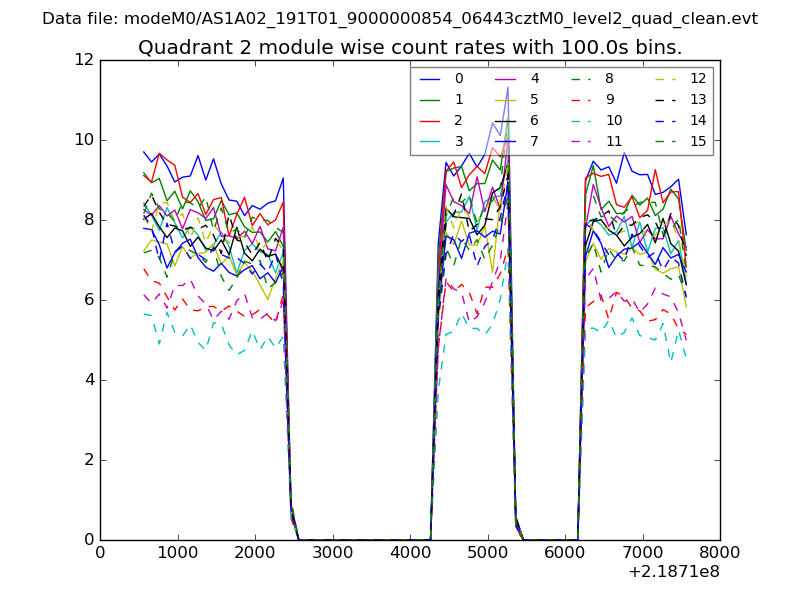
| Module-wise count rates for Quadrant B Data is divided into 100 sec bins |
 |
 |
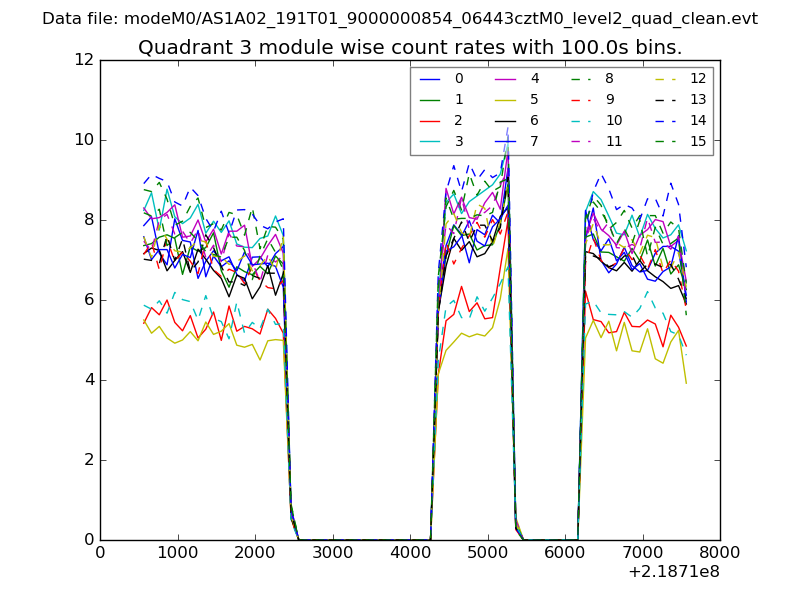
| Module-wise count rates for Quadrant C Data is divided into 100 sec bins |
 |
 |
| Module-wise count rates for Quadrant D Data is divided into 100 sec bins |
 |
 |
| Parameter | Plot |
|---|---|
| CZT HV Monitor | 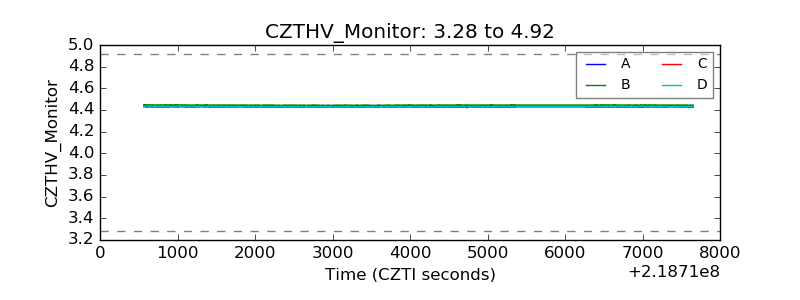 |
| D_VDD | 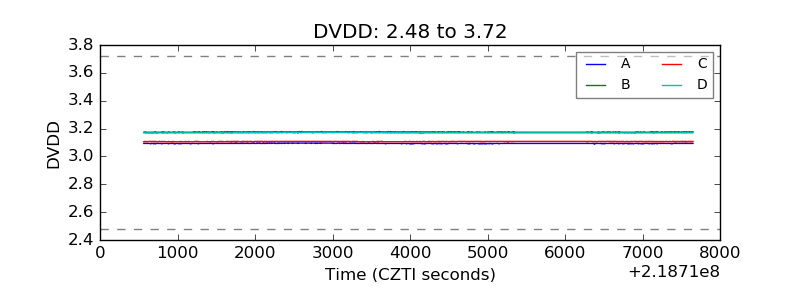 |
| Temperature 1 | 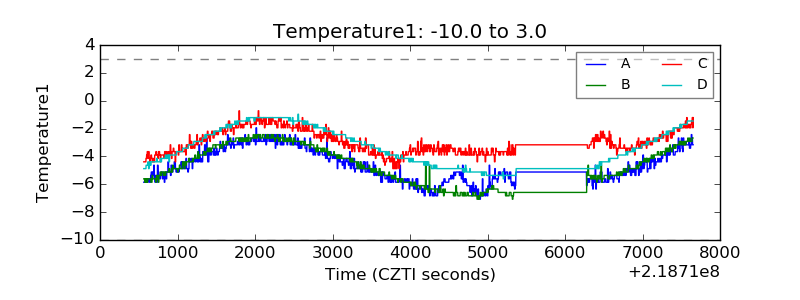 |
| Veto HV Monitor | 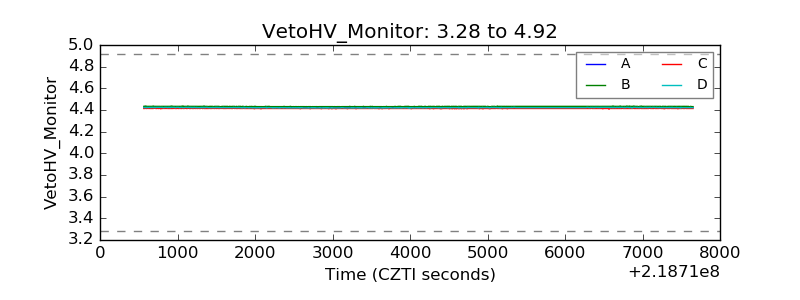 |
| Veto LLD | 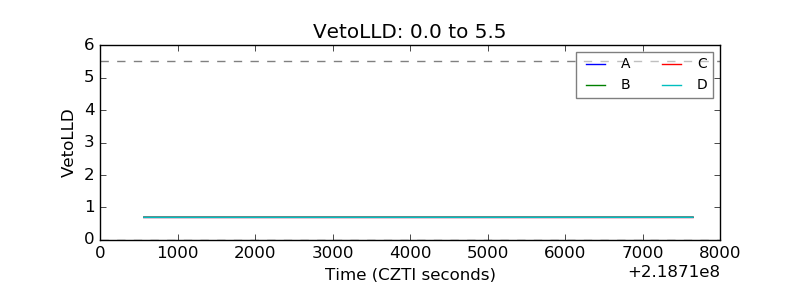 |
| Alpha Counter | 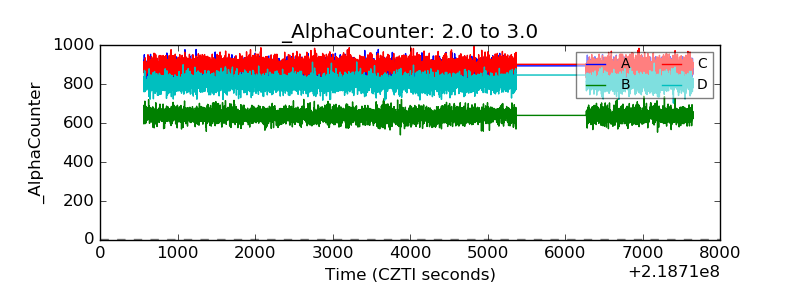 |
| _CPM_Rate | 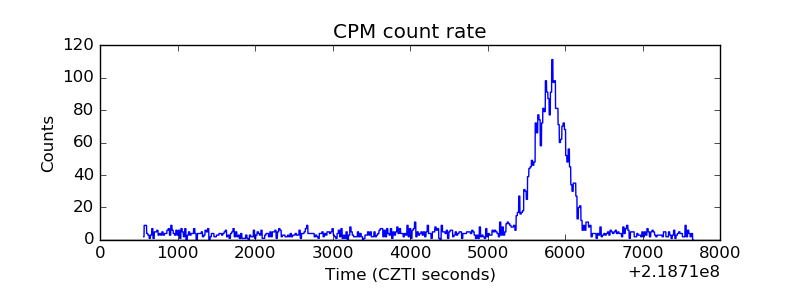 |
| CZT Counter | 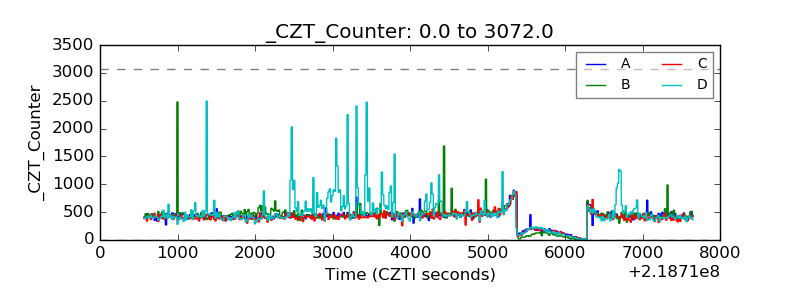 |
| +2.5 Volts monitor |  |
| +5 Volts monitor | 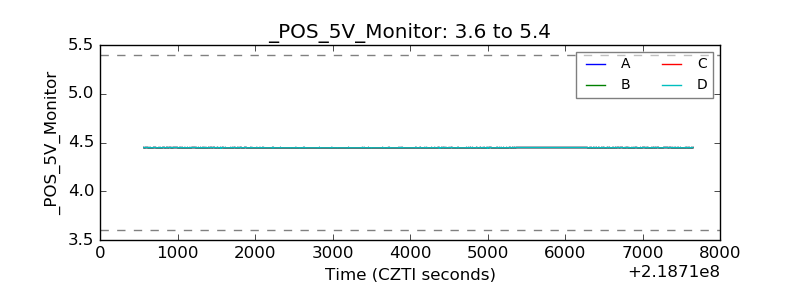 |
| _ROLL_ROT | 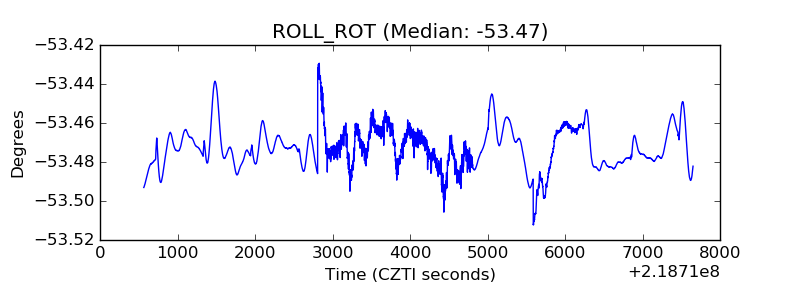 |
| _Roll_DEC | 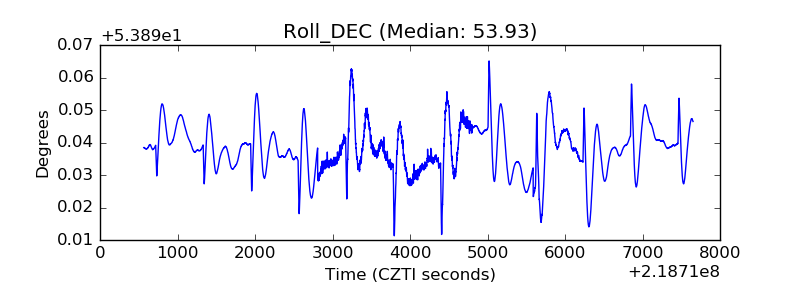 |
| _Roll_RA | 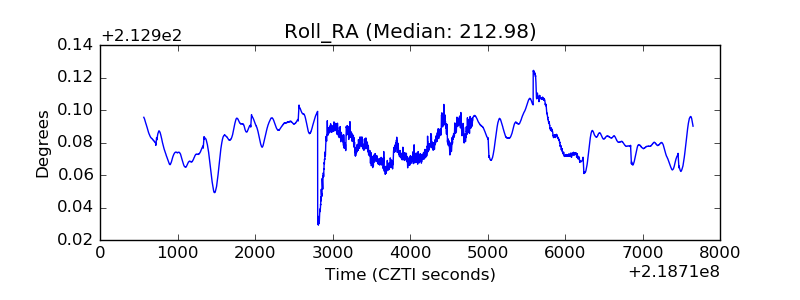 |
| Veto Counter | 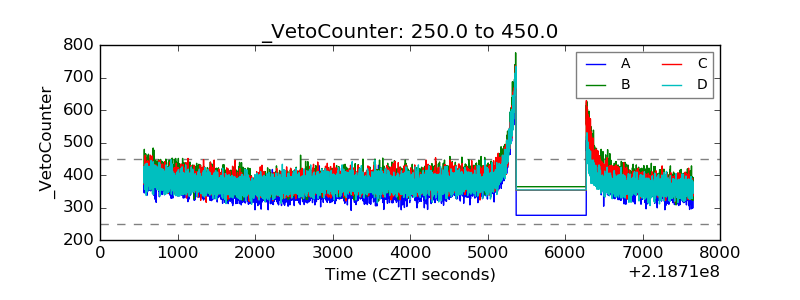 |