| Param | Original file | Final file |
|---|---|---|
| Filename | modeM0/AS1A02_191T01_9000000854_06444cztM0_level2.evt | modeM0/AS1A02_191T01_9000000854_06444cztM0_level2_quad_clean.evt |
| Size (bytes) | 465,520,320 | 95,448,960 |
| Size | 444.0 MB | 91.0 MB |
| Events in quadrant A | 3,134,943 | 608,657 |
| Events in quadrant B | 3,738,124 | 623,645 |
| Events in quadrant C | 3,039,286 | 600,830 |
| Events in quadrant D | 3,712,004 | 571,854 |
| Mode SS | |||
|---|---|---|---|
| Quadrant | BADHDUFLAG | Total packets | Discarded packets |
| A | 0 | 140 | 0 |
| B | 0 | 140 | 0 |
| C | 0 | 140 | 0 |
| D | 0 | 140 | 0 |
| Mode M0 | |||
|---|---|---|---|
| Quadrant | BADHDUFLAG | Total packets | Discarded packets |
| A | 0 | 14276 | 2 |
| B | 0 | 15779 | 1 |
| C | 0 | 14239 | 1 |
| D | 0 | 16052 | 1 |
| Mode M9 | |||
|---|---|---|---|
| Quadrant | BADHDUFLAG | Total packets | Discarded packets |
| A | 0 | 4 | 0 |
| B | 0 | 4 | 0 |
| C | 0 | 4 | 0 |
| D | 0 | 4 | 0 |
| Quadrant | Total seconds | Saturated seconds | Saturation percentage |
|---|---|---|---|
| A | 6973 | 137 | 1.964721% |
| B | 6973 | 175 | 2.509680% |
| C | 6973 | 105 | 1.505808% |
| D | 6973 | 174 | 2.495339% |
Noise dominated data is calculated using 1-second bins in cleaned event files. If a bin has >2000 counts, and if more than 50% of those come from <1% of pixels, then it is considered to be noise-dominated and hence unusable.
| Quadrant | # 1 sec bins | Bins with >0 counts | Bins with >2000 counts | High rate bins dominated by noise | Noise dominated (total time) | Noise dominated (detector-on time) | Marked lightcurve |
|---|---|---|---|---|---|---|---|
| A | 7318 | 6974 | 0 | 0 | 0.00% | 0.00% | 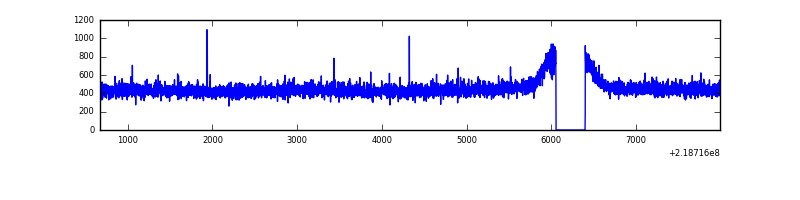 |
| B | 7318 | 6974 | 29 | 29 | 0.40% | 0.42% | 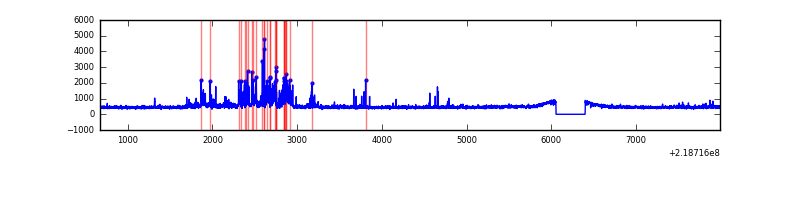 |
| C | 7318 | 6974 | 0 | 0 | 0.00% | 0.00% | 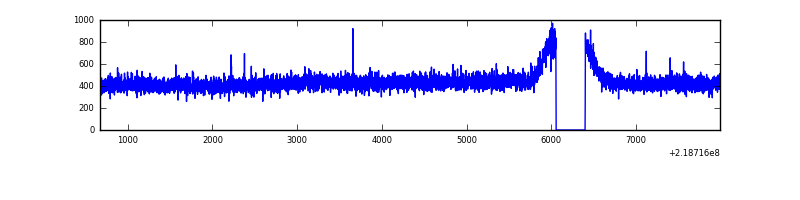 |
| D | 7318 | 6974 | 50 | 50 | 0.68% | 0.72% | 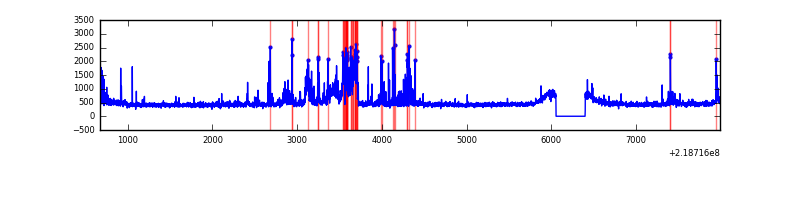 |
Top three noisy pixels from each quadrant. If the there are fewer than three noisy pixels in the level2.evt file, extra rows are filled as -1
| Pixel properties | Quadrant properties | ||||||
|---|---|---|---|---|---|---|---|
| Quadrant | DetID | PixID | Counts | Sigma | Mean | Median | Sigma |
| A | 8 | 15 | 13795 | 78.63 | 807 | 787 | 165.4 |
| A | 10 | 133 | 12797 | 72.6 | 807 | 787 | 165.4 |
| A | 0 | 226 | 7859 | 42.75 | 807 | 787 | 165.4 |
| B | 0 | 228 | 444820 | 2833.16 | 808 | 789 | 156.7 |
| B | 11 | 51 | 88378 | 558.87 | 808 | 789 | 156.7 |
| B | 4 | 81 | 25157 | 155.48 | 808 | 789 | 156.7 |
| C | 13 | 61 | 6057 | 29.33 | 777 | 777 | 180.0 |
| C | 9 | 16 | 3220 | 13.57 | 777 | 777 | 180.0 |
| C | 8 | 222 | 2483 | 9.47 | 777 | 777 | 180.0 |
| D | 2 | 63 | 365270 | 1924.3 | 777 | 749 | 189.4 |
| D | 2 | 152 | 195305 | 1027.06 | 777 | 749 | 189.4 |
| D | 7 | 55 | 89488 | 468.45 | 777 | 749 | 189.4 |
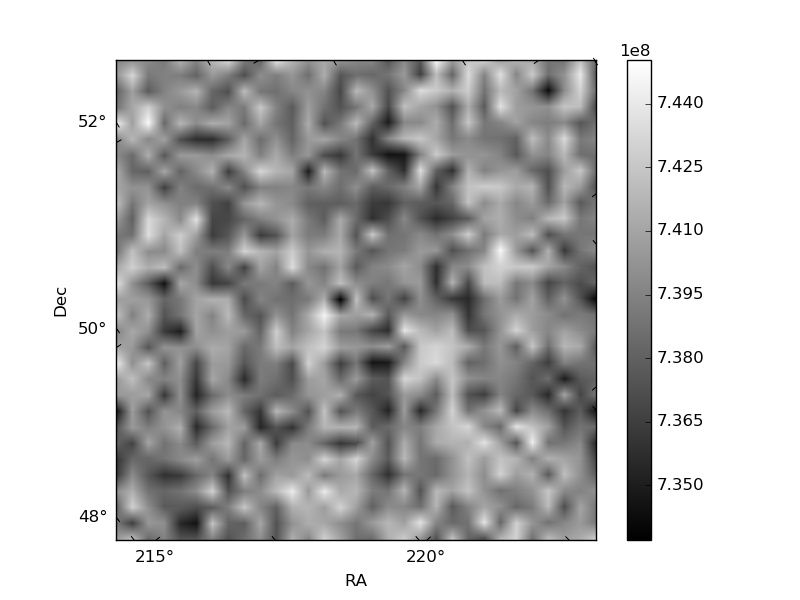
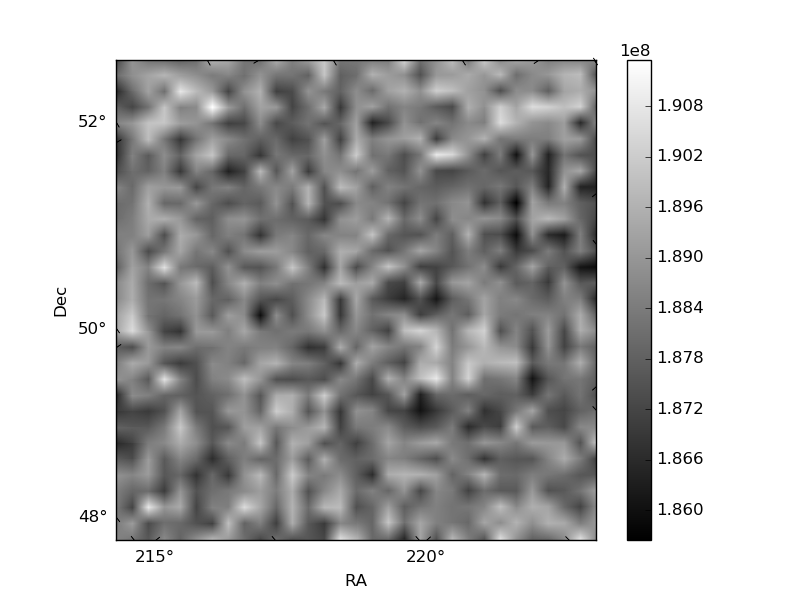
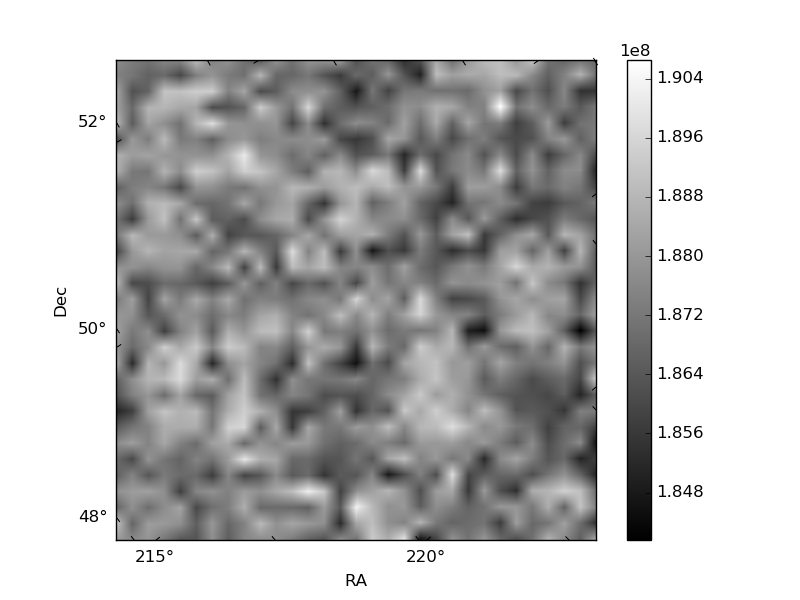
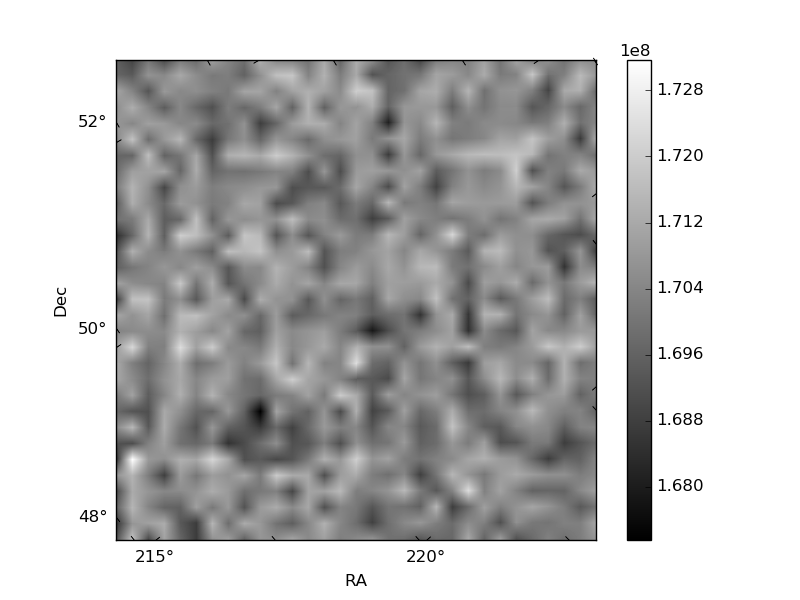
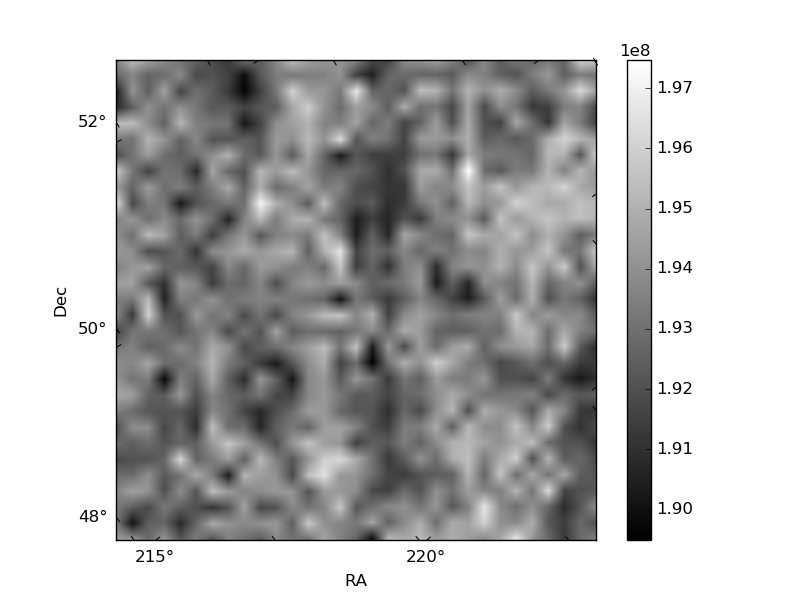
Histogram calculated using DETX and DETY for each event in the final _common_clean file
| Quadrant A | 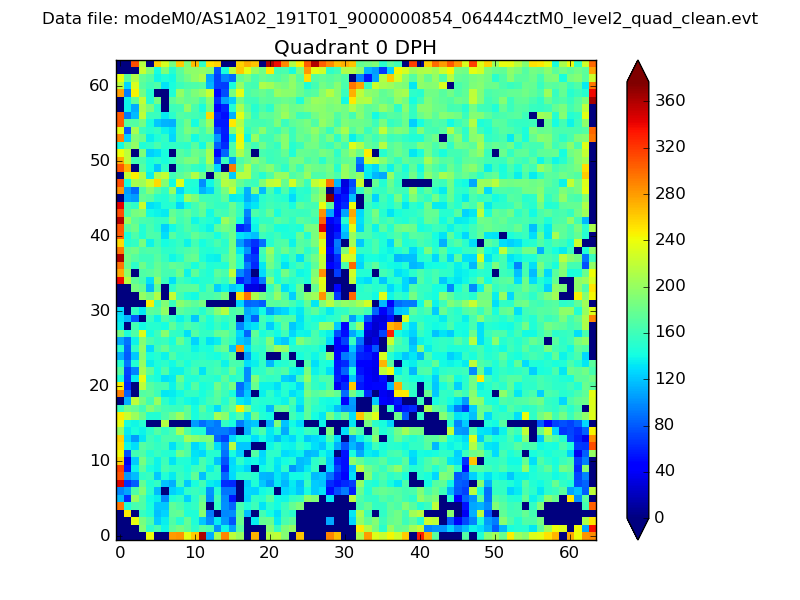 |
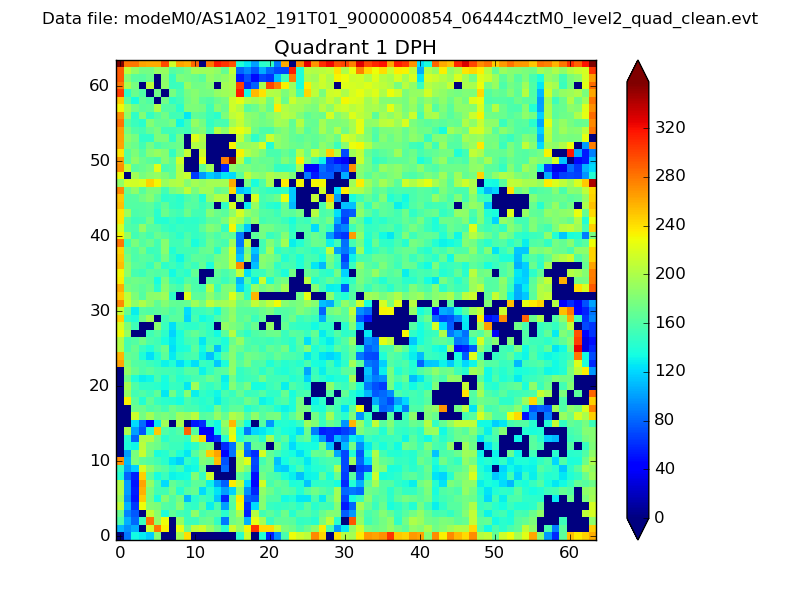 |
Quadrant B |
|---|---|---|---|
| Quadrant D | 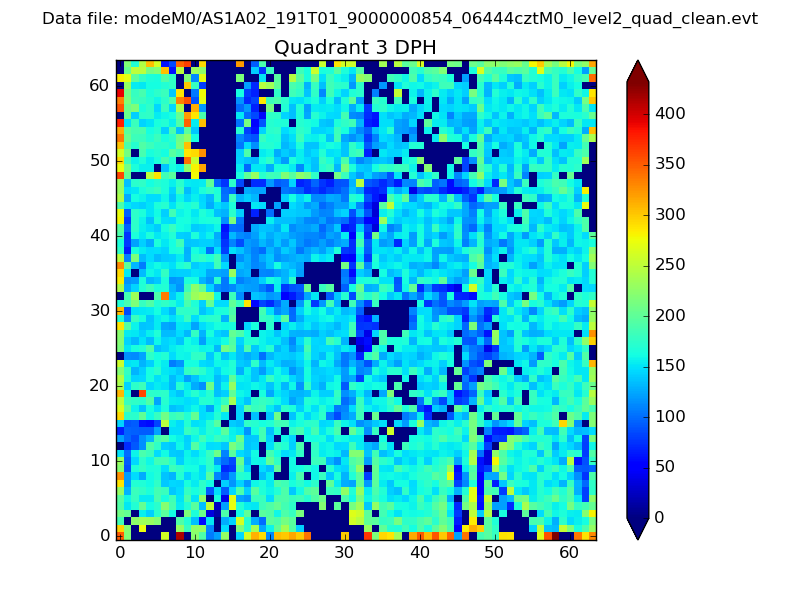 |
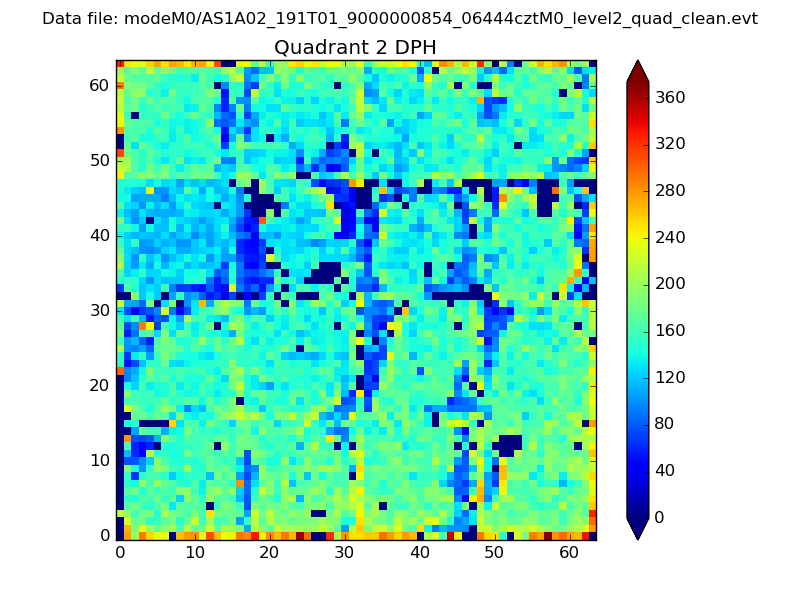 |
Quadrant C |
| Plot type | Count rate plots | Images |
|---|---|---|
| Comparison with Poisson distribution Blue bars denote a histogram of data divided into 1 sec bins. Red curve is a Poisson curve with rate = median count rate of data. |
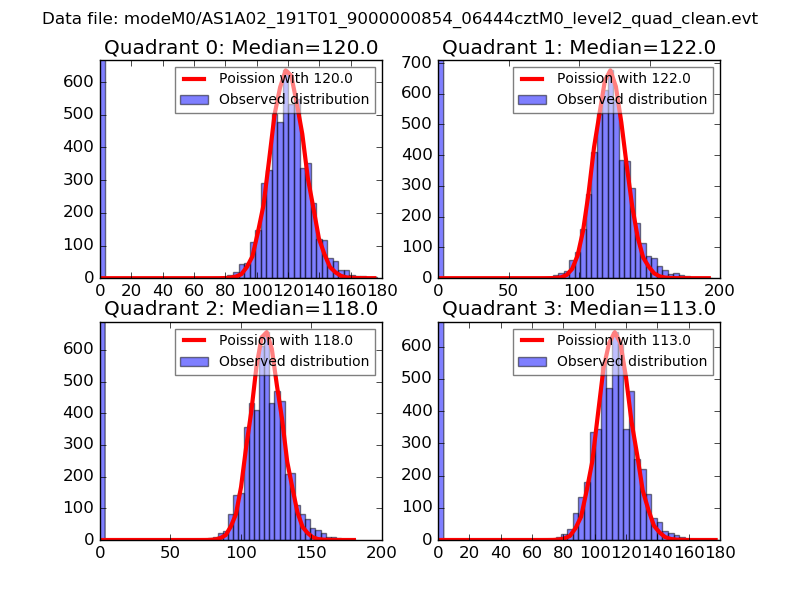 |
 |
| Quadrant-wise count rates Data is divided into 100 sec bins |
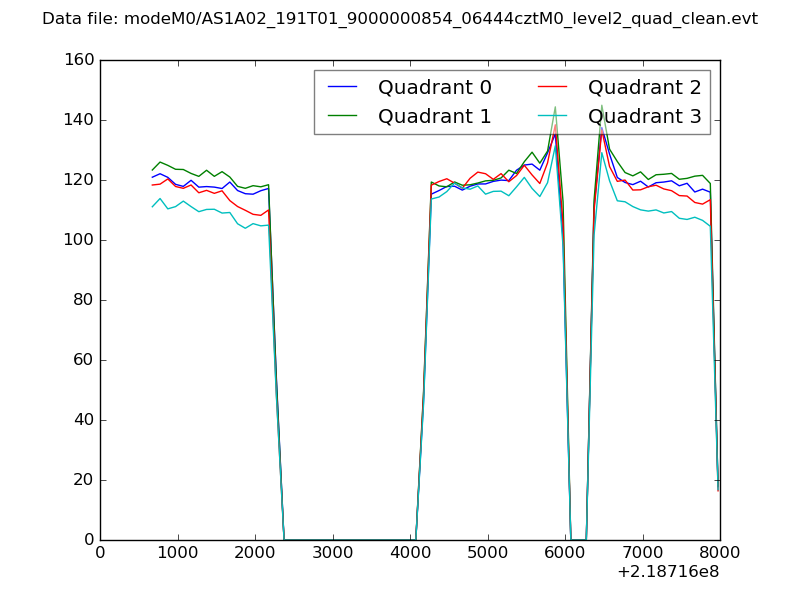 |
|
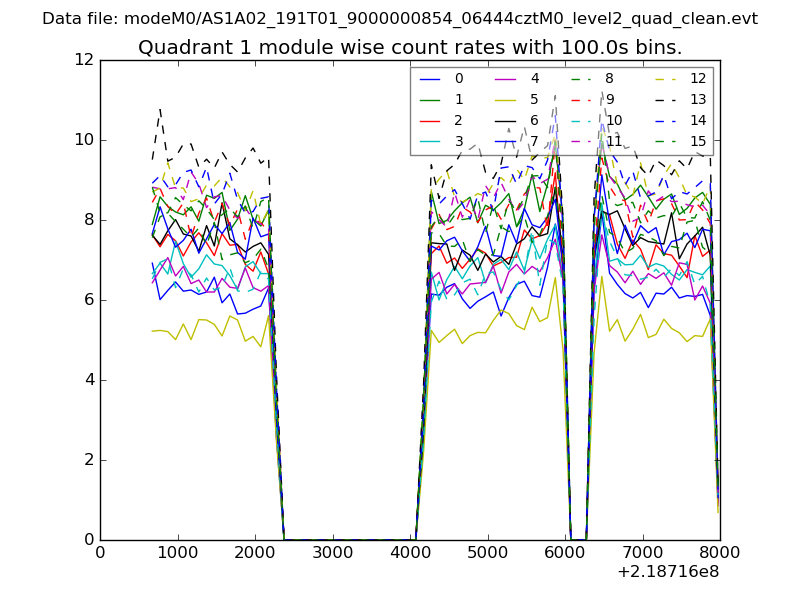
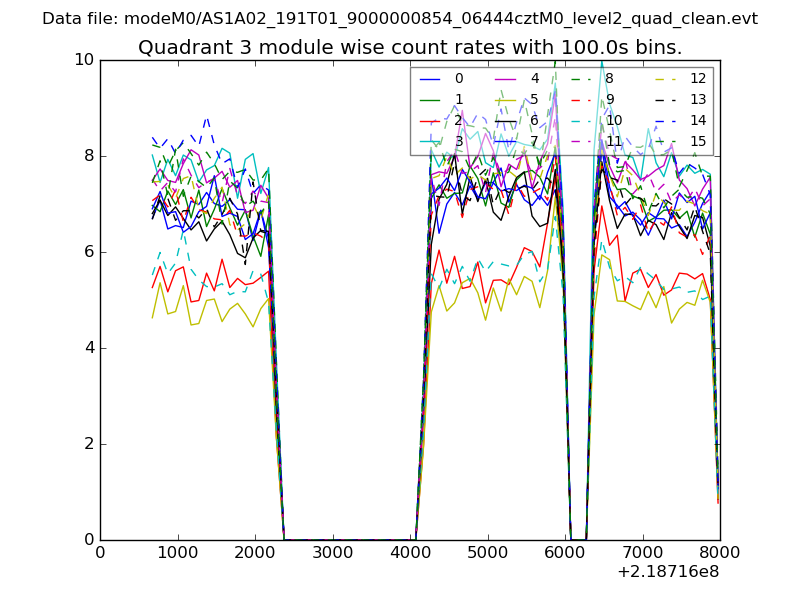
| Module-wise count rates for Quadrant A Data is divided into 100 sec bins |
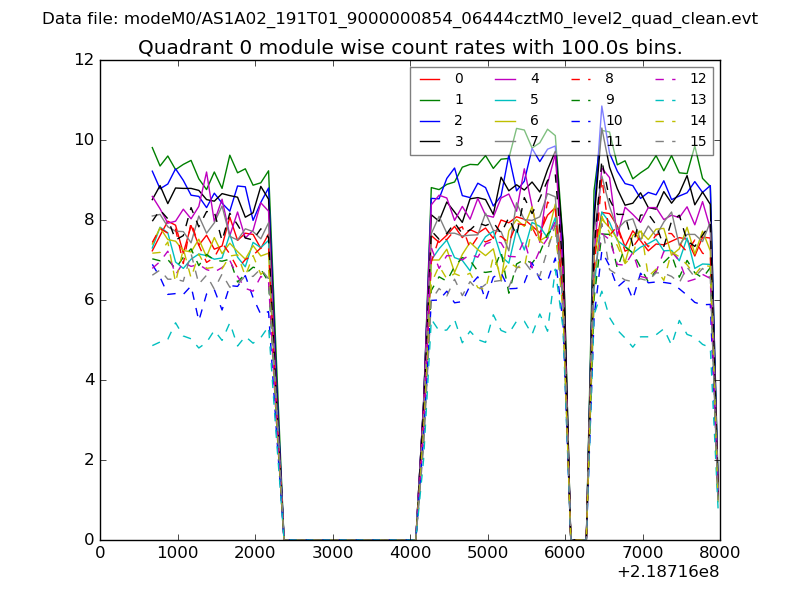 |
 |
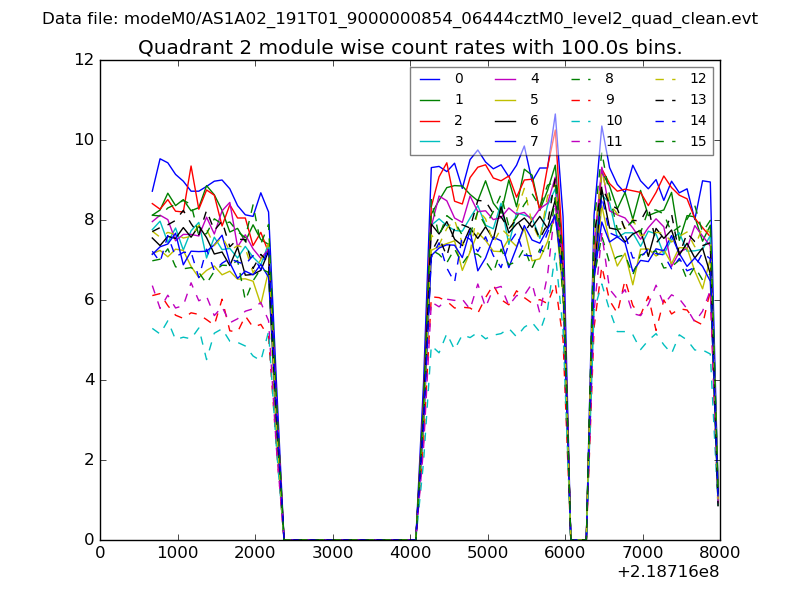
| Module-wise count rates for Quadrant B Data is divided into 100 sec bins |
 |
 |
| Module-wise count rates for Quadrant C Data is divided into 100 sec bins |
 |
 |
| Module-wise count rates for Quadrant D Data is divided into 100 sec bins |
 |
 |
| Parameter | Plot |
|---|---|
| CZT HV Monitor | 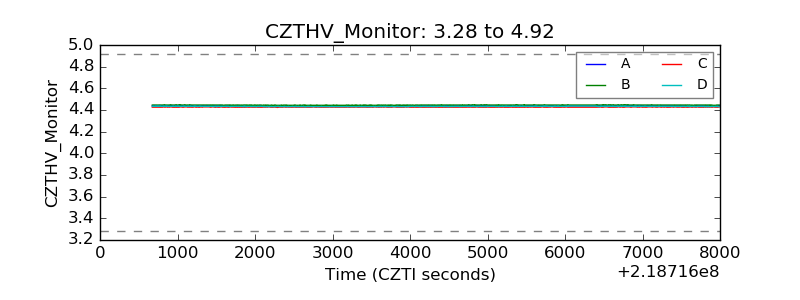 |
| D_VDD | 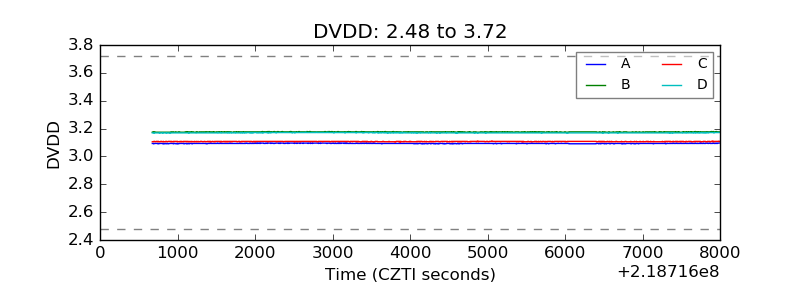 |
| Temperature 1 | 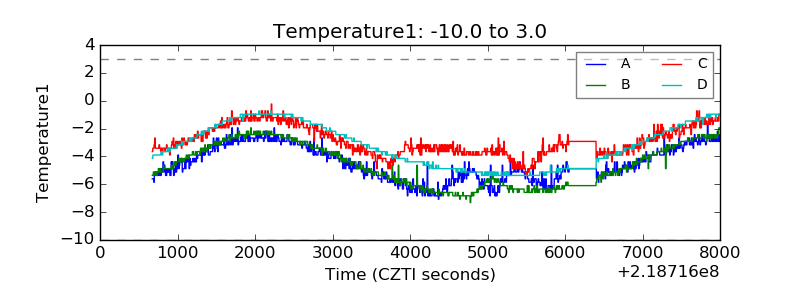 |
| Veto HV Monitor | 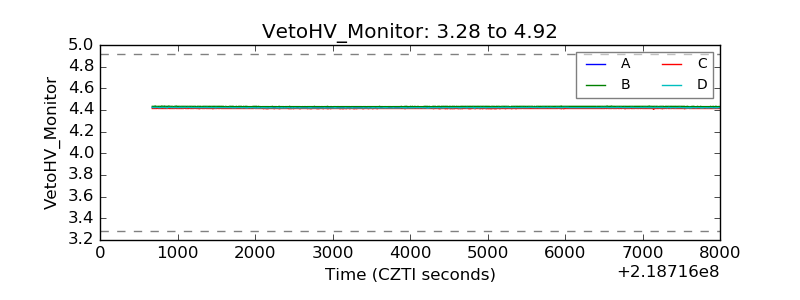 |
| Veto LLD | 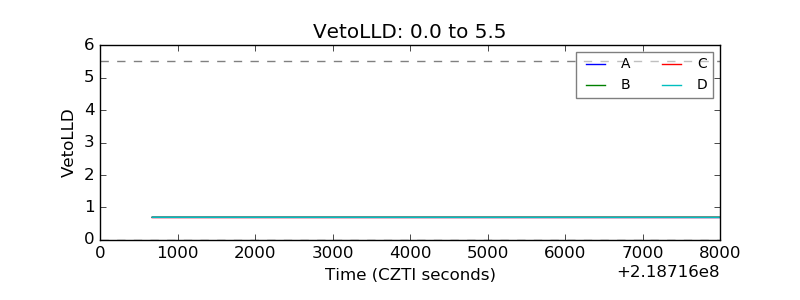 |
| Alpha Counter | 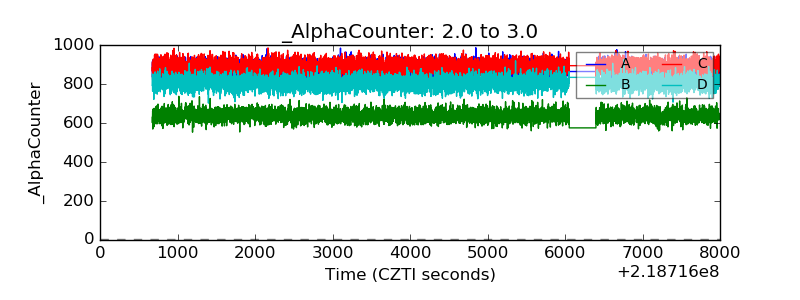 |
| _CPM_Rate | 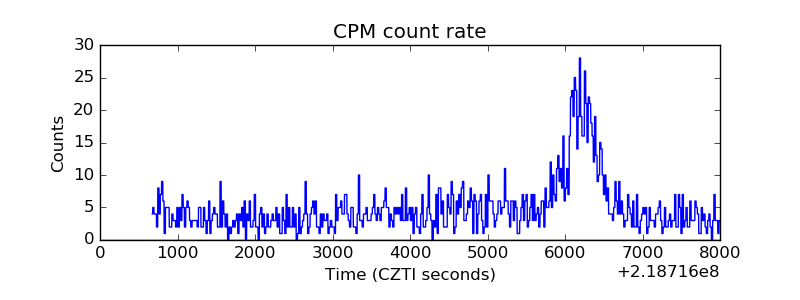 |
| CZT Counter | 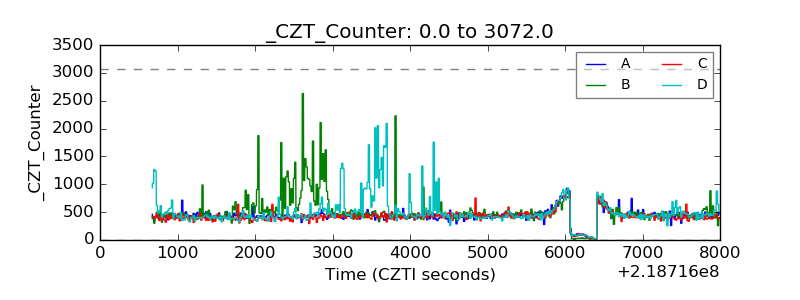 |
| +2.5 Volts monitor |  |
| +5 Volts monitor | 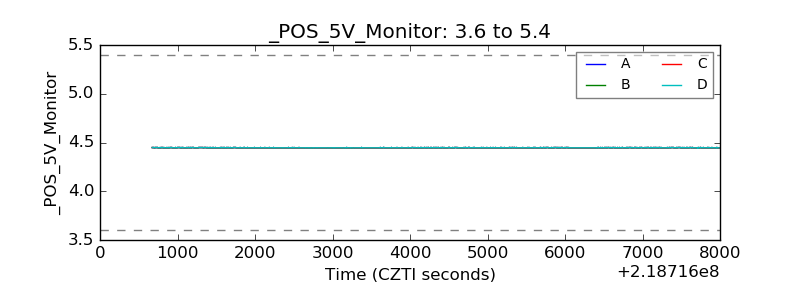 |
| _ROLL_ROT | 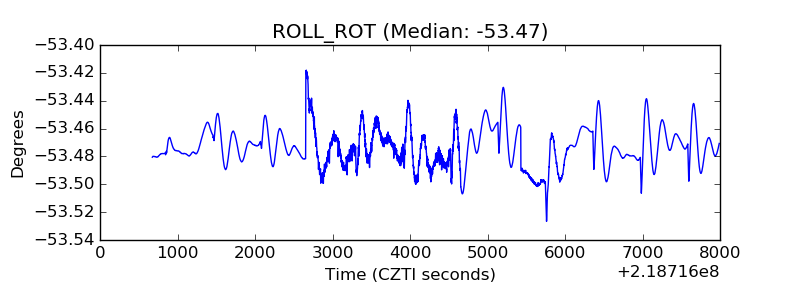 |
| _Roll_DEC | 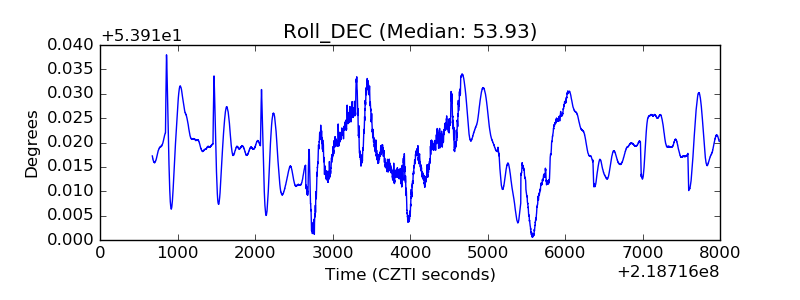 |
| _Roll_RA | 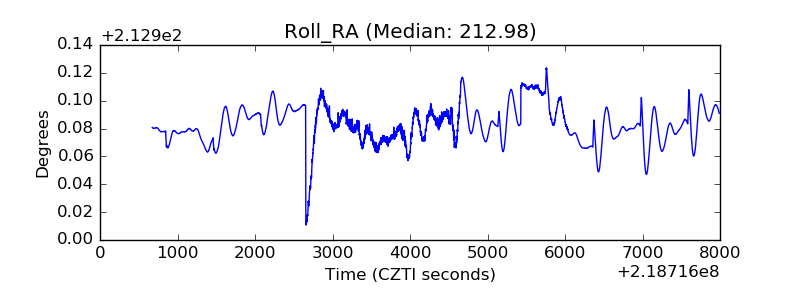 |
| Veto Counter | 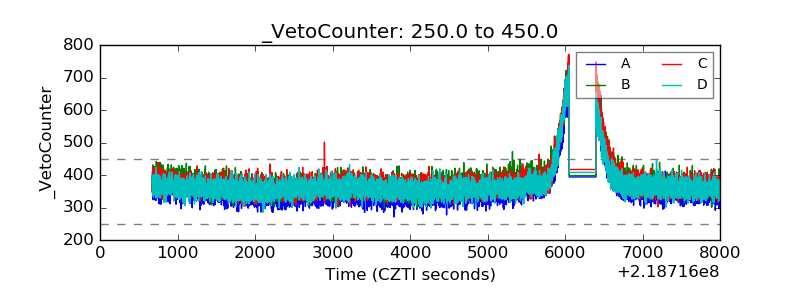 |