| Param | Original file | Final file |
|---|---|---|
| Filename | modeM0/AS1A02_191T01_9000000854_06445cztM0_level2.evt | modeM0/AS1A02_191T01_9000000854_06445cztM0_level2_quad_clean.evt |
| Size (bytes) | 505,704,960 | 104,028,480 |
| Size | 482.3 MB | 99.2 MB |
| Events in quadrant A | 3,507,087 | 662,100 |
| Events in quadrant B | 3,778,672 | 678,157 |
| Events in quadrant C | 3,396,307 | 651,973 |
| Events in quadrant D | 4,109,101 | 621,858 |
| Mode SS | |||
|---|---|---|---|
| Quadrant | BADHDUFLAG | Total packets | Discarded packets |
| A | 0 | 154 | 0 |
| B | 0 | 154 | 0 |
| C | 0 | 154 | 0 |
| D | 0 | 154 | 0 |
| Mode M0 | |||
|---|---|---|---|
| Quadrant | BADHDUFLAG | Total packets | Discarded packets |
| A | 0 | 15851 | 1 |
| B | 0 | 16452 | 0 |
| C | 0 | 15819 | 0 |
| D | 0 | 17353 | 0 |
| Quadrant | Total seconds | Saturated seconds | Saturation percentage |
|---|---|---|---|
| A | 7710 | 151 | 1.958495% |
| B | 7710 | 195 | 2.529183% |
| C | 7710 | 122 | 1.582361% |
| D | 7710 | 164 | 2.127108% |
Noise dominated data is calculated using 1-second bins in cleaned event files. If a bin has >2000 counts, and if more than 50% of those come from <1% of pixels, then it is considered to be noise-dominated and hence unusable.
| Quadrant | # 1 sec bins | Bins with >0 counts | Bins with >2000 counts | High rate bins dominated by noise | Noise dominated (total time) | Noise dominated (detector-on time) | Marked lightcurve |
|---|---|---|---|---|---|---|---|
| A | 7710 | 7710 | 0 | 0 | 0.00% | 0.00% | 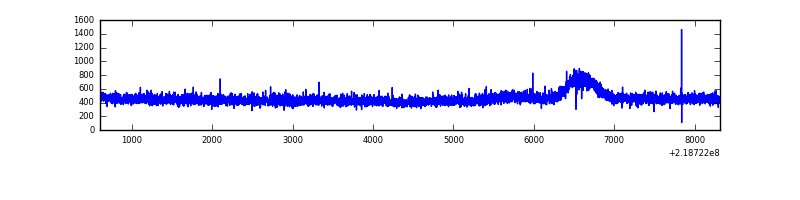 |
| B | 7710 | 7710 | 11 | 11 | 0.14% | 0.14% | 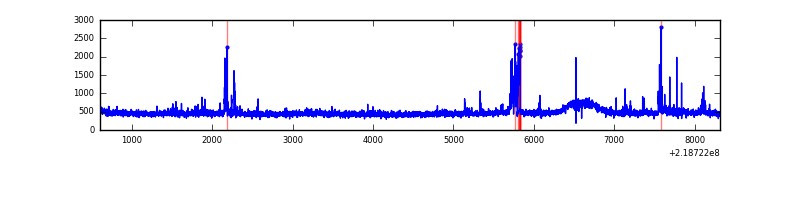 |
| C | 7710 | 7710 | 0 | 0 | 0.00% | 0.00% | 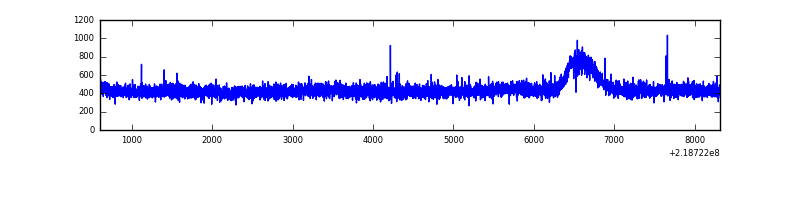 |
| D | 7710 | 7710 | 25 | 25 | 0.32% | 0.32% | 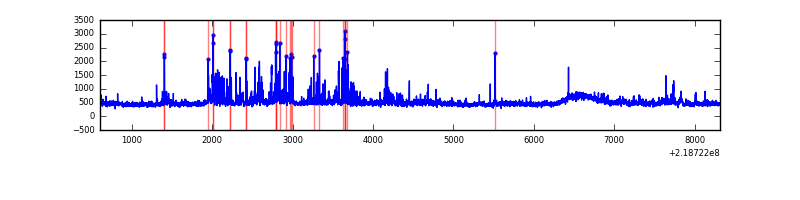 |
Top three noisy pixels from each quadrant. If the there are fewer than three noisy pixels in the level2.evt file, extra rows are filled as -1
| Pixel properties | Quadrant properties | ||||||
|---|---|---|---|---|---|---|---|
| Quadrant | DetID | PixID | Counts | Sigma | Mean | Median | Sigma |
| A | 10 | 133 | 15726 | 80.6 | 901 | 879 | 184.2 |
| A | 13 | 14 | 10287 | 51.07 | 901 | 879 | 184.2 |
| A | 12 | 194 | 8553 | 41.66 | 901 | 879 | 184.2 |
| B | 3 | 220 | 96689 | 553.9 | 905 | 884 | 173.0 |
| B | 0 | 228 | 85456 | 488.95 | 905 | 884 | 173.0 |
| B | 15 | 204 | 35016 | 197.33 | 905 | 884 | 173.0 |
| C | 13 | 61 | 6967 | 30.33 | 867 | 868 | 201.1 |
| C | 10 | 170 | 4769 | 19.4 | 867 | 868 | 201.1 |
| C | 1 | 16 | 2883 | 10.02 | 867 | 868 | 201.1 |
| D | 2 | 152 | 206137 | 965.32 | 870 | 842 | 212.7 |
| D | 12 | 221 | 199422 | 933.74 | 870 | 842 | 212.7 |
| D | 2 | 63 | 172976 | 809.39 | 870 | 842 | 212.7 |
Histogram calculated using DETX and DETY for each event in the final _common_clean file
| Quadrant A | 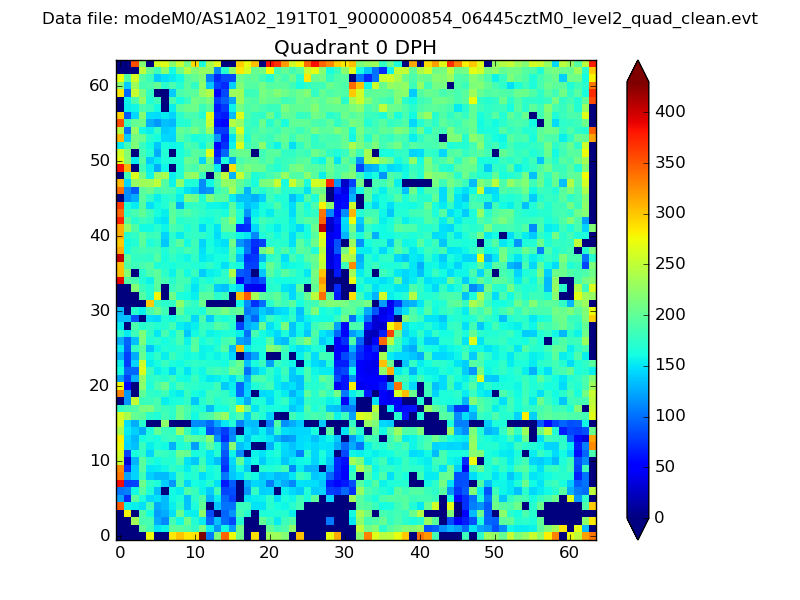 |
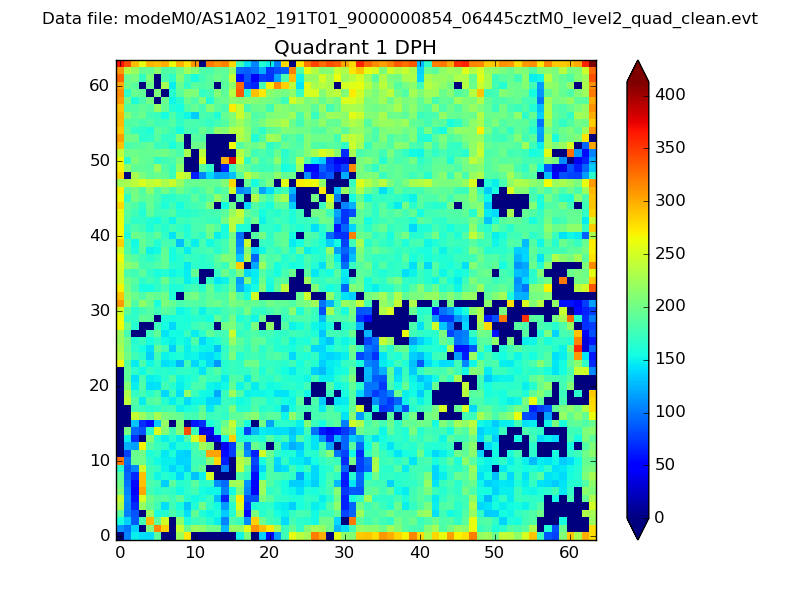 |
Quadrant B |
|---|---|---|---|
| Quadrant D | 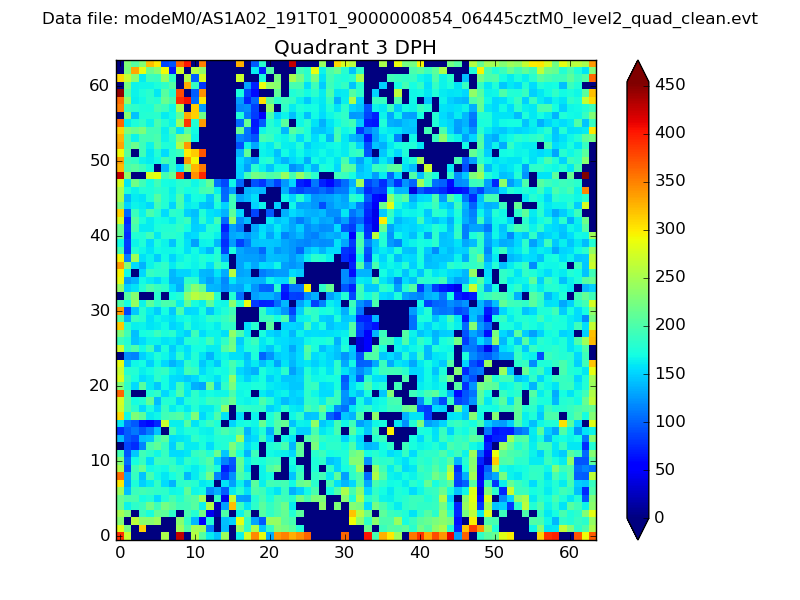 |
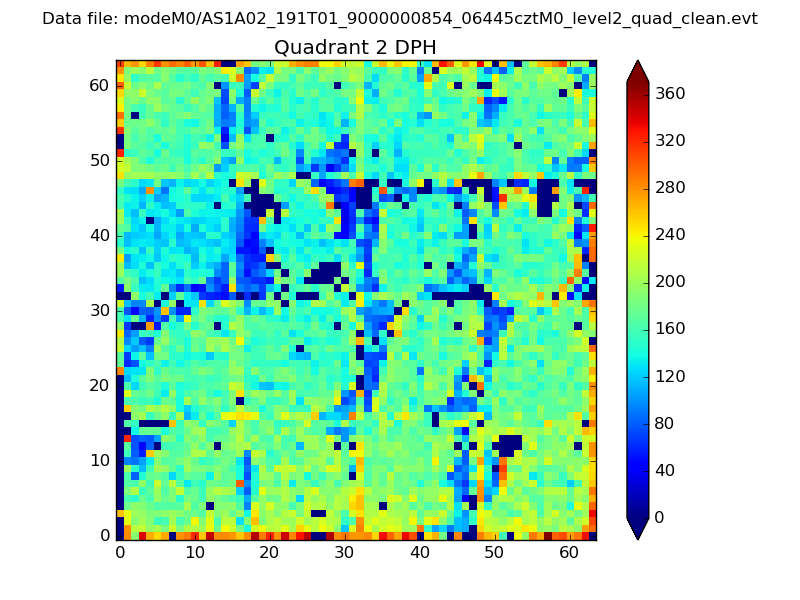 |
Quadrant C |
| Plot type | Count rate plots | Images |
|---|---|---|
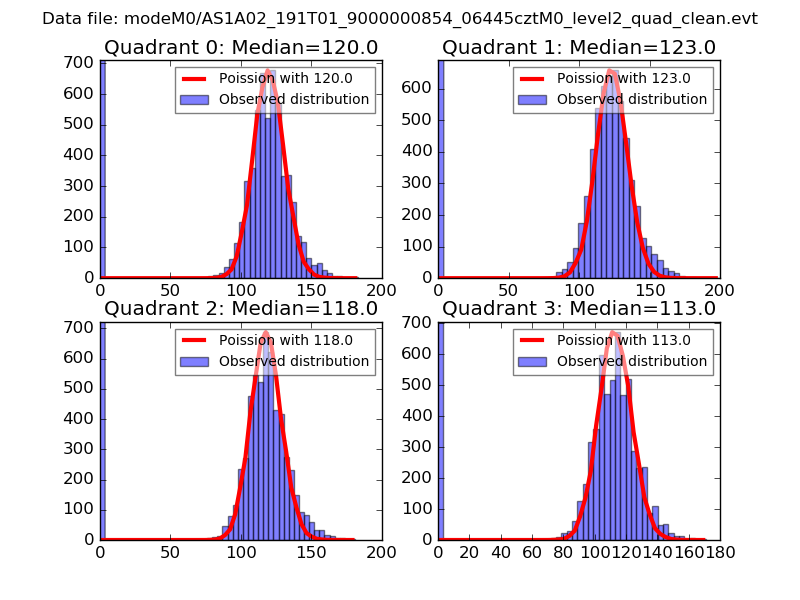
| Comparison with Poisson distribution Blue bars denote a histogram of data divided into 1 sec bins. Red curve is a Poisson curve with rate = median count rate of data. |
 |
 |
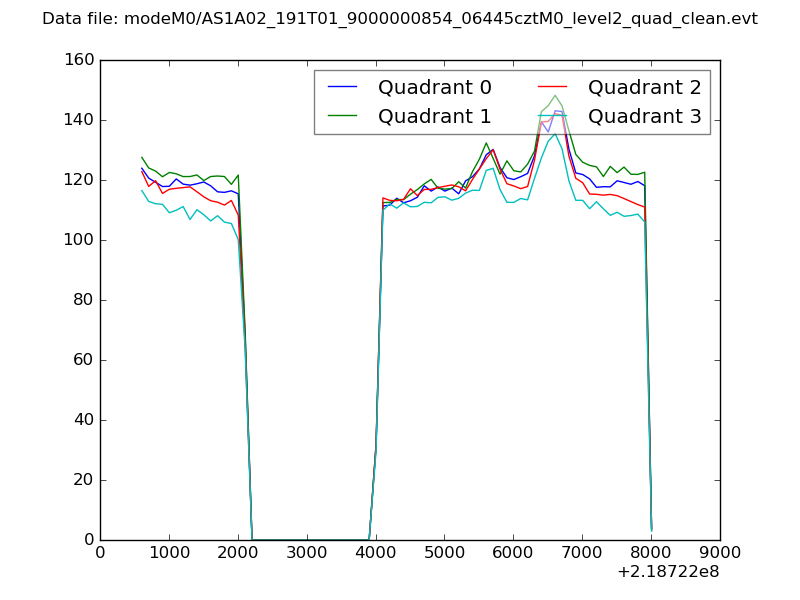
| Quadrant-wise count rates Data is divided into 100 sec bins |
 |
|
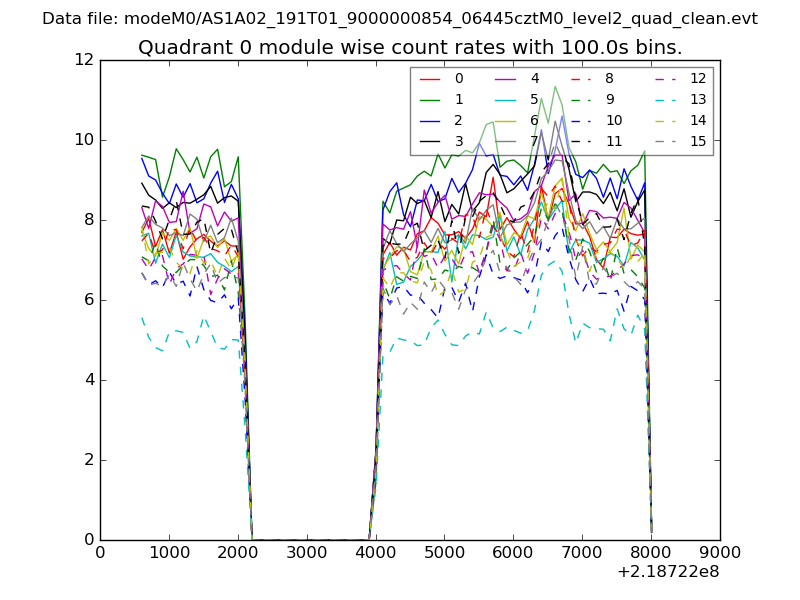
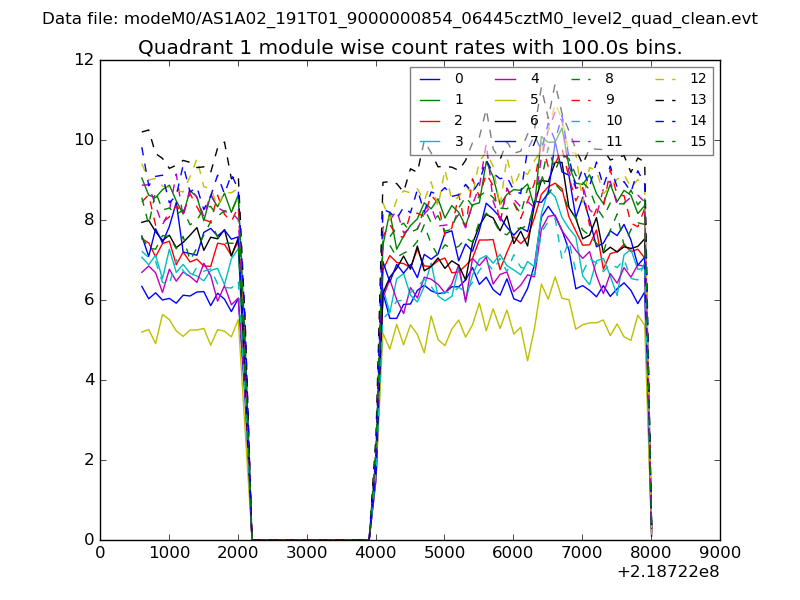
| Module-wise count rates for Quadrant A Data is divided into 100 sec bins |
 |
 |
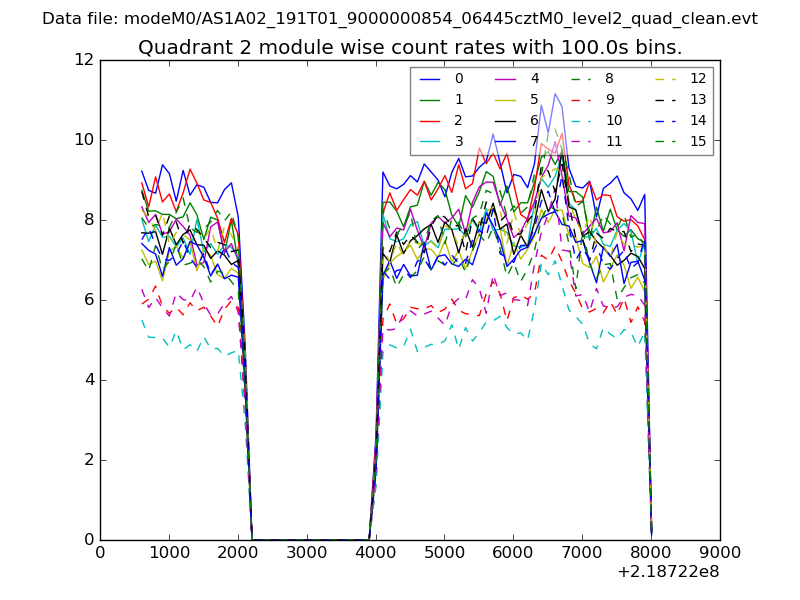
| Module-wise count rates for Quadrant B Data is divided into 100 sec bins |
 |
 |
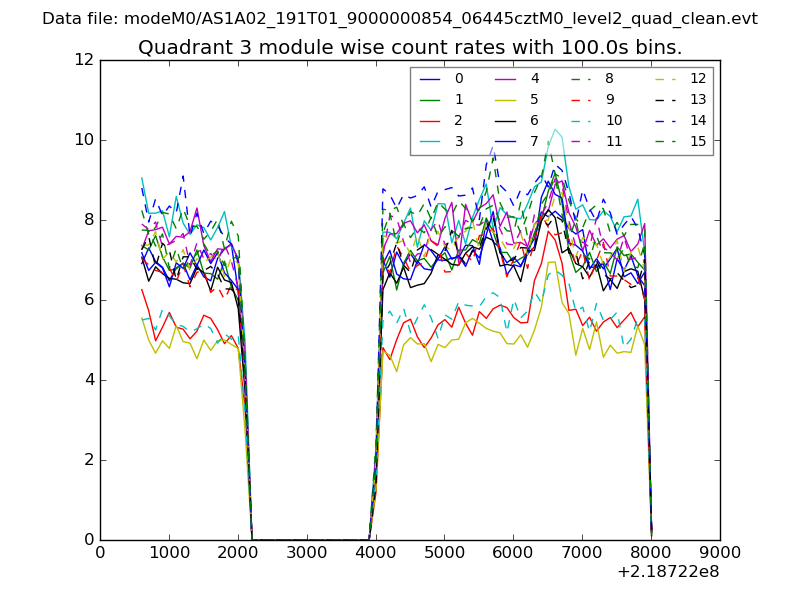
| Module-wise count rates for Quadrant C Data is divided into 100 sec bins |
 |
 |
| Module-wise count rates for Quadrant D Data is divided into 100 sec bins |
 |
 |
| Parameter | Plot |
|---|---|
| CZT HV Monitor | 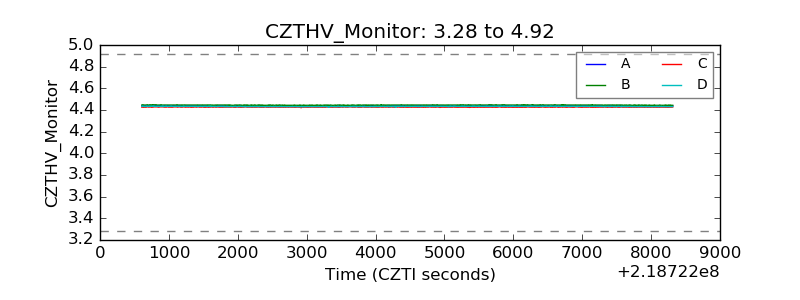 |
| D_VDD | 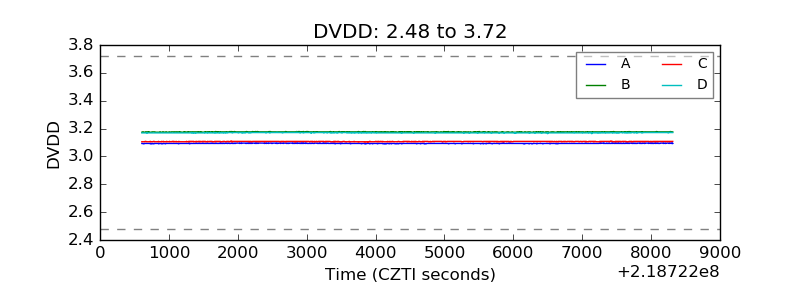 |
| Temperature 1 | 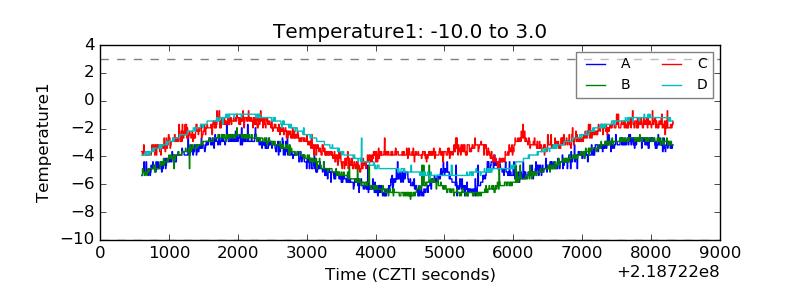 |
| Veto HV Monitor | 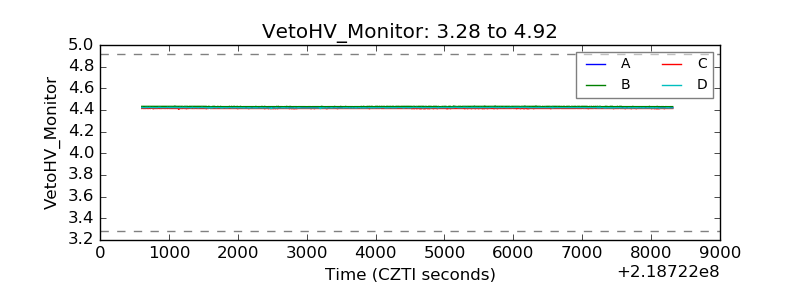 |
| Veto LLD | 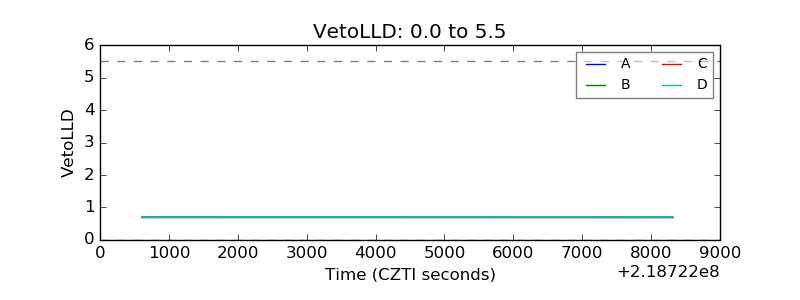 |
| Alpha Counter | 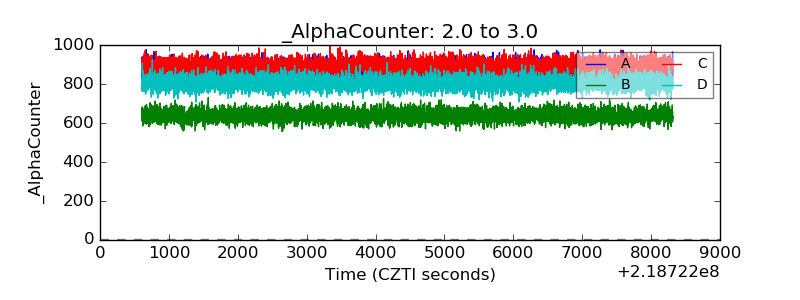 |
| _CPM_Rate | 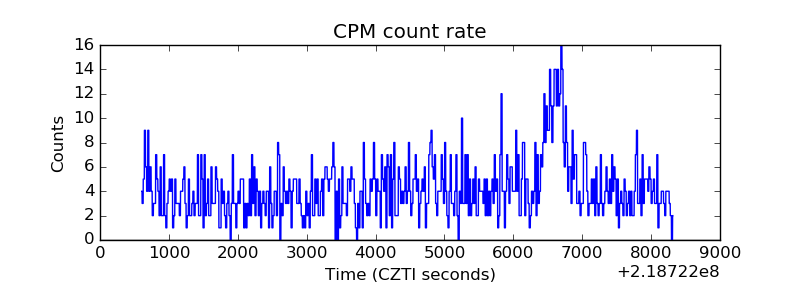 |
| CZT Counter | 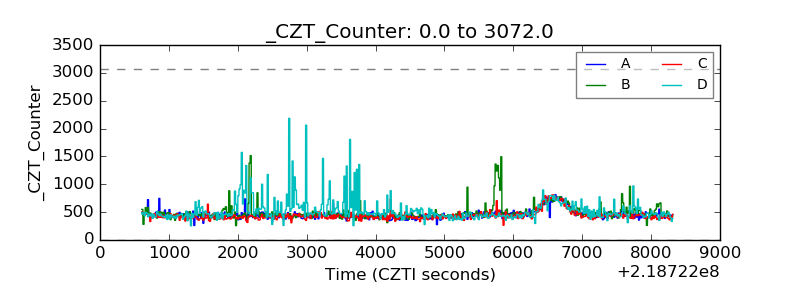 |
| +2.5 Volts monitor |  |
| +5 Volts monitor | 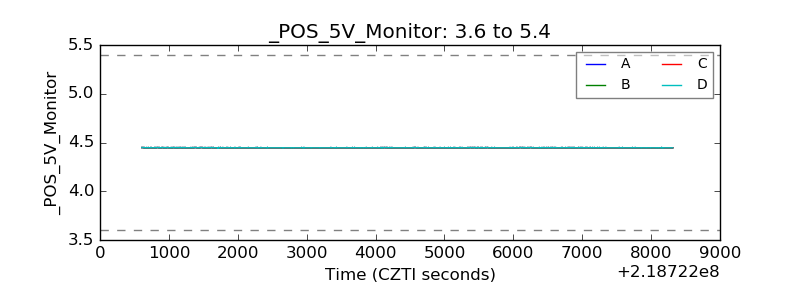 |
| _ROLL_ROT | 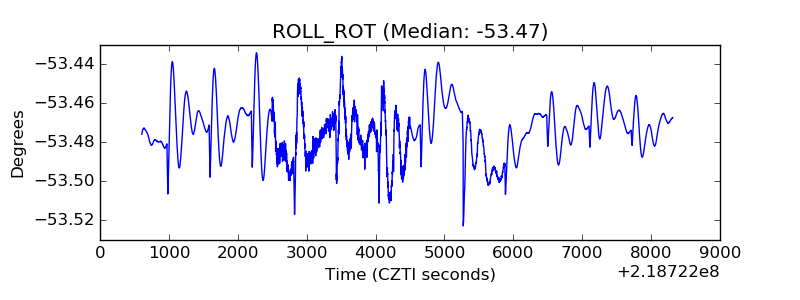 |
| _Roll_DEC | 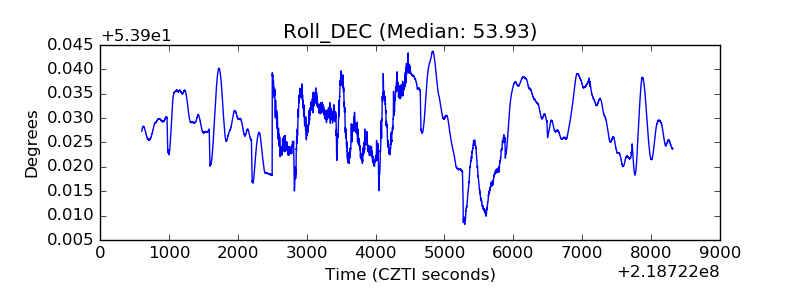 |
| _Roll_RA | 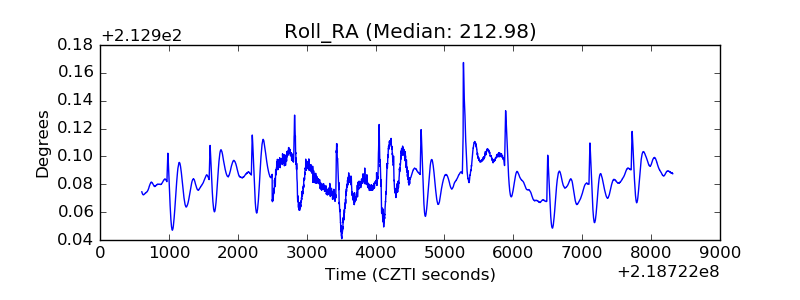 |
| Veto Counter | 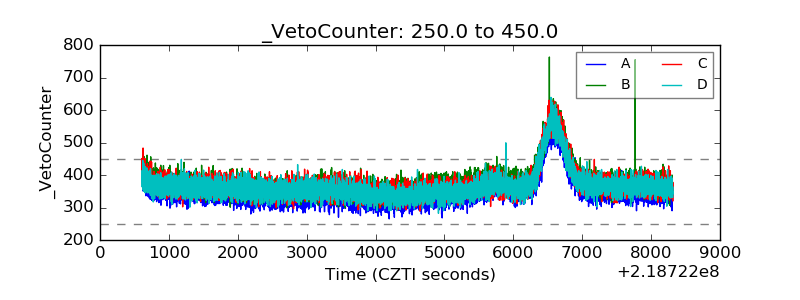 |